8-OHdG and OGG1: The Crucial Oxidative DNA Repair Pathway in Disease and Drug Discovery
This comprehensive review examines the 8-hydroxy-2'-deoxyguanosine (8-OHdG) base excision repair pathway, primarily mediated by the OGG1 glycosylase.
8-OHdG and OGG1: The Crucial Oxidative DNA Repair Pathway in Disease and Drug Discovery
Abstract
This comprehensive review examines the 8-hydroxy-2'-deoxyguanosine (8-OHdG) base excision repair pathway, primarily mediated by the OGG1 glycosylase. It details the foundational role of 8-OHdG as a key biomarker of oxidative stress and its mutagenic potential leading to G:C to T:A transversions. The article explores the structural and functional mechanisms of OGG1, current methodologies for detecting 8-OHdG and OGG1 activity, and common experimental challenges in their analysis. It further validates OGG1's significance across aging, cancer, and neurodegenerative diseases and compares its role to other DNA repair enzymes. This synthesis provides essential insights for researchers and drug developers targeting oxidative DNA damage repair for therapeutic intervention.
Understanding 8-OHdG and OGG1: The Basics of Oxidative DNA Damage and Repair
What is 8-OHdG? Defining a Major Biomarker of Oxidative Stress
8-Hydroxy-2'-deoxyguanosine (8-OHdG) is the most prevalent and well-studied lesion resulting from oxidative damage to DNA. It is generated when reactive oxygen species (ROS), such as the hydroxyl radical, attack the C8 position of deoxyguanosine. Within the context of a broader thesis on the base excision repair (BER) pathway and OGG1 research, 8-OHdG is not merely a passive biomarker; it is the primary substrate for the OGG1 glycosylase, the enzyme responsible for initiating its repair. The quantification of 8-OHdG in cellular DNA, urine, or serum has become a gold standard for assessing the extent of oxidative stress in vivo, linking it to pathogenesis of cancer, neurodegenerative diseases, diabetes, and aging. This whitepaper provides a technical guide to 8-OHdG, its repair, and associated research methodologies.
Biochemistry and Role in the OGG1-Mediated BER Pathway
The formation of 8-OHdG is mutagenic, as it can pair with adenine as readily as cytosine during replication, leading to G:C to T:A transversions. The primary defense against this lesion is the base excision repair pathway, specifically initiated by the 8-oxoguanine DNA glycosylase 1 (OGG1).
Title: OGG1-Initiated Base Excision Repair of 8-OHdG
Quantitative Data on 8-OHdG
Table 1: 8-OHdG Levels in Biological Samples from Representative Studies
| Sample Type | Population/Condition | Mean/Median Level (Reported Range) | Measurement Method | Key Implication |
|---|---|---|---|---|
| Urinary 8-OHdG (pmol/µmol creatinine) | Healthy Adults | ~5.0 (1.5 - 10.0) | LC-MS/MS (Gold Standard) | Baseline oxidative stress |
| Smokers | Increased by 30-50% | ELISA, LC-MS/MS | Direct impact of exogenous oxidants | |
| Type 2 Diabetes | Increased by 50-150% | HPLC-ECD | Link to metabolic oxidative stress | |
| Leukocyte DNA (8-OHdG/10⁶ dG) | Healthy Controls | ~2.0 - 4.0 | HPLC-ECD | Genomic DNA damage load |
| Alzheimer's Patients | Increased by 2-3 fold | HPLC-ECD/LC-MS/MS | Association with neurodegeneration | |
| Tissue (Liver) (8-OHdG/10⁶ dG) | Animal Model (NAFLD) | Increased by 4-8 fold | Immunohistochemistry | Correlation with disease severity |
LC-MS/MS: Liquid Chromatography-Tandem Mass Spectrometry; HPLC-ECD: High-Performance Liquid Chromatography with Electrochemical Detection; ELISA: Enzyme-Linked Immunosorbent Assay.
Experimental Protocols for 8-OHdG Analysis
Protocol: Extraction and Quantification of 8-OHdG from Cellular DNA via HPLC-ECD
This is a detailed methodology for measuring genomic 8-OHdG levels.
- DNA Isolation: Isolate high-molecular-weight DNA from cells or tissue using a phenol-chloroform extraction kit with RNase treatment. Prefer methods that minimize artificial oxidation (e.g., include chelating agents like deferoxamine).
- DNA Hydrolysis: Digest 50-100 µg of DNA.
- Incubate with Nuclease P1 (in sodium acetate buffer, pH 5.3) at 37°C for 2 hours.
- Adjust pH to ~8.0 with Tris-HCl.
- Add Alkaline Phosphatase and incubate at 37°C for 1 hour.
- Centrifuge (12,000 x g, 10 min) and filter supernatant (0.22 µm).
- HPLC-ECD Analysis:
- Column: C18 reverse-phase column (e.g., 4.6 x 250 mm, 5 µm particle size).
- Mobile Phase: 10% methanol in 50 mM sodium phosphate buffer (pH 5.5).
- Flow Rate: 1.0 mL/min.
- Detection: Electrochemical detector with a working potential of +600 mV (vs. Pd reference). A UV detector (260 nm) is run in parallel to quantify total deoxyguanosine (dG).
- Quantification: Calculate the 8-OHdG/10⁶ dG ratio by comparing the 8-OHdG peak area (from ECD) to the dG peak area (from UV), using external calibration curves from authentic standards.
Protocol: Immunofluorescence Staining for 8-OHdG in Cells
This protocol visualizes nuclear 8-OHdG lesions in situ.
- Cell Culture and Oxidative Stress Induction: Seed cells on chamber slides. Treat with desired oxidative agent (e.g., 100-500 µM H₂O₂, 1 hr).
- Fixation and Permeabilization: Wash with PBS and fix with 4% paraformaldehyde (15 min). Permeabilize with 0.25% Triton X-100 in PBS (10 min). Block with 5% BSA/1% normal goat serum (1 hr).
- Primary Antibody Incubation: Incubate with mouse or rabbit monoclonal anti-8-OHdG antibody (1:200-1:500 in blocking buffer) overnight at 4°C.
- Secondary Antibody and Detection: Wash and incubate with fluorophore-conjugated secondary antibody (e.g., Alexa Fluor 488, 1:1000) for 1 hr at RT in the dark. Counterstain nuclei with DAPI (5 min).
- Microscopy and Analysis: Mount slides and image using a fluorescence microscope. Quantify mean fluorescence intensity (MFI) per nucleus using image analysis software (e.g., ImageJ).
The Scientist's Toolkit: Key Research Reagent Solutions
Table 2: Essential Reagents and Materials for 8-OHdG/OGG1 Research
| Item | Function/Application | Example/Notes |
|---|---|---|
| Anti-8-OHdG Monoclonal Antibody (clone 15A3 or N45.1) | Detection of 8-OHdG in DNA via ELISA, immunohistochemistry, or immunofluorescence. | Critical specificity; clone 15A3 is widely validated for DNA-bound 8-OHdG. |
| Recombinant Human OGG1 Protein | In vitro BER assays, enzyme kinetics studies, substrate specificity tests. | Available as full-length or catalytic domain; verify glycosylase/AP lyase activity. |
| 8-OHdG / 8-oxo-dG Standard | Calibration standard for quantitative analysis (HPLC, LC-MS/MS). | Ensure high purity (>98%). Store at -80°C in aliquots. |
| OGG1 siRNA or CRISPR/Cas9 Knockout Kit | Functional studies by knocking down/out OGG1 to observe 8-OHdG accumulation and phenotypic consequences. | Validate knockout/western blot for OGG1. |
| Commercial 8-OHdG ELISA Kit | High-throughput screening of urinary or serum 8-OHdG. | Useful for large clinical studies; potential for cross-reactivity; correlate with LC-MS. |
| Specific OGG1 Inhibitor (e.g., TH5487, SU0268) | Pharmacological probing of OGG1 function in cellular and animal models. | Used to study OGG1's role in inflammation and gene regulation beyond repair. |
| AP Site (Abasic Site) Quantification Kit | Downstream measurement of BER activity after OGG1 initiation. | Quantifies the intermediate product post-glycosylase action. |
| LC-MS/MS System with Stable Isotope-Labeled Internal Standard (e.g., ¹⁵N₅-8-OHdG) | Gold-standard quantitative analysis of 8-OHdG in any biological matrix. | Provides highest accuracy and sensitivity; corrects for recovery and matrix effects. |
This whitepaper elucidates the molecular genesis of 8-hydroxy-2'-deoxyguanosine (8-OHdG), a preeminent biomarker of oxidative DNA damage. Within the broader thesis of the base excision repair (BER) pathway and 8-oxoguanine DNA glycosylase 1 (OGG1) research, understanding this lesion's formation is foundational. 8-OHdG results from the attack of reactive oxygen species (ROS) on the guanine base in DNA, creating a mutagenic lesion (G to T/C transversions) that is primarily excised by the OGG1-initiated BER pathway. Its persistent accumulation is implicated in aging, cancer, and neurodegenerative diseases, making it a critical target for mechanistic study and therapeutic intervention.
Mechanistic Pathways of ROS-Induced 8-OHdG Formation
Reactive oxygen species, such as hydroxyl radical (•OH), singlet oxygen (¹O₂), and peroxynitrite (ONOO⁻), are generated endogenously through mitochondrial respiration, inflammation (e.g., via NADPH oxidase activation), and exogenously via ionizing radiation and chemical exposures. •OH, the most potent species, is formed via the Fenton reaction where Fe²⁺ catalyzes the decomposition of hydrogen peroxide (H₂O₂).
The formation of 8-OHdG proceeds through a multi-step oxidation mechanism at the C8 position of deoxyguanosine (dG). The initial attack generates a guanine radical cation, which undergoes hydration and further one-electron oxidation to yield the stable product, 8-oxo-7,8-dihydro-2'-deoxyguanosine (8-oxodG, commonly referred to as 8-OHdG in its tautomeric form).
Diagram Title: ROS Generation and 8-OHdG Formation Pathway
Key Quantitative Data on ROS, Lesion Rates, and OGG1 Activity
Table 1: Quantitative Metrics of ROS-Induced DNA Damage & Repair
| Parameter | Typical Value / Range | Experimental Context & Notes | Reference (Recent Findings) |
|---|---|---|---|
| Steady-state 8-OHdG lesions per cell | ~1,500 - 2,400 lesions/cell (~3-5 lesions/10⁶ dG) | Measured in mammalian tissues (e.g., rat liver) via LC-MS/MS. Varies with metabolic rate, age, and tissue type. | [LC-MS/MS studies, 2023] |
| Induced lesions by 100 µM H₂O₂ (in vitro) | ~50-100 8-OHdG lesions/10⁶ dG | In cultured mammalian cells (e.g., HeLa). Highly dependent on intracellular Fe²⁺ availability and antioxidant status. | [Cell Culture Models, 2022] |
| OGG1 turnover rate (kcat) | ~1-10 min⁻¹ | Purified human OGG1 on 8-oxoG:C substrate. Biphasic kinetics due to product inhibition. | [Enzyme Kinetics Analysis, 2023] |
| Binding affinity (Km) of OGG1 | ~2-10 nM | For 8-oxoG lesion in double-stranded DNA. High affinity ensures efficient lesion scanning. | [Biophysical Assays, 2024] |
| G to T transversion rate from unrepaired 8-oxodG | Increases >10-fold | In bacterial and mammalian reporter systems (e.g., supF shuttle vectors). | [Mutagenesis Studies, 2022] |
| Half-life of 8-OHdG lesion in vivo (mammalian) | ~Minutes to hours | Dependent on cellular OGG1 activity, which decreases with age and in some pathologies. | [In vivo BER Flux Measurements, 2023] |
Detailed Experimental Protocols for Key Assays
Protocol: Quantification of 8-OHdG by Liquid Chromatography-Tandem Mass Spectrometry (LC-MS/MS)
Objective: To accurately measure the level of 8-OHdG in genomic DNA from tissue or cell samples.
Materials: Tissue/cell pellets, DNA extraction kit (phenol-free recommended), Nuclease P1, Alkaline Phosphatase, LC-MS/MS system, Stable isotope-labeled 8-OHdG internal standard (e.g., ¹⁵N₅-8-OHdG).
Procedure:
- DNA Isolation: Extract genomic DNA using a method that minimizes artifactual oxidation (e.g., chelating agents like deferoxamine, antioxidants).
- DNA Hydrolysis: Digest 2-10 µg of DNA with 2 U of Nuclease P1 in 20 µL of 20 mM sodium acetate buffer (pH 5.2) at 37°C for 2 hours. Then, add 2.5 U of Alkaline Phosphatase in 5 µL of 1M Tris-HCl (pH 8.0) and incubate at 37°C for 1 hour.
- Internal Standard Addition: Add a known amount (e.g., 10 fmol) of ¹⁵N₅-8-OHdG to the hydrolysate.
- LC-MS/MS Analysis:
- LC: Use a C18 reverse-phase column. Mobile phase A: 0.1% formic acid in water; B: 0.1% formic acid in methanol. Gradient elution.
- MS/MS: Operate in positive electrospray ionization (ESI+) mode. Monitor the specific transition: 8-OHdG m/z 284→168 (quantifier) and 284→140 (qualifier); internal standard m/z 289→173.
- Quantification: Calculate the ratio of the peak area of endogenous 8-OHdG to the internal standard. Use a calibration curve from pure standards for absolute quantification. Normalize results to the amount of DNA or to the level of deoxyguanosine (dG) measured in a parallel run.
Protocol:In VitroOGG1 Glycosylase Activity Assay (Gel-Based)
Objective: To assess the enzymatic activity of purified OGG1 protein in cleaving an oligonucleotide containing an 8-oxoG lesion.
Materials: Recombinant OGG1 protein, 5'-FAM-labeled oligonucleotide duplex containing a single 8-oxoG:C pair, Control duplex with G:C pair, Reaction buffer (20 mM Tris-HCl pH 7.6, 100 mM KCl, 1 mM EDTA, 1 mg/mL BSA), Stop solution (95% formamide, 20 mM EDTA, dyes), Denaturing Polyacrylamide Gel Electrophoresis (PAGE) setup.
Procedure:
- Annealing: Anneal the fluorescently labeled 8-oxoG-containing strand with its complementary strand to form the substrate duplex.
- Reaction Setup: In a 20 µL reaction, combine 50 nM DNA substrate with OGG1 (e.g., 1-10 nM) in reaction buffer. Incubate at 37°C for 15-30 minutes.
- Reaction Termination: Add 20 µL of stop solution and heat at 95°C for 5 minutes to denature.
- Product Separation: Load samples onto a denaturing polyacrylamide gel (e.g., 20% acrylamide, 7M urea). Run electrophoresis at high voltage.
- Visualization & Analysis: Image the gel using a fluorescence scanner. The intact substrate and the cleaved product (shorter FAM-labeled fragment) will be separated. Quantify the percentage of product formed using image analysis software (e.g., ImageJ).
Diagram Title: OGG1 In Vitro Activity Assay Workflow
The Scientist's Toolkit: Key Research Reagent Solutions
Table 2: Essential Reagents for 8-OHdG and OGG1 Research
| Reagent / Material | Function & Application | Key Notes for Researchers |
|---|---|---|
| Anti-8-OHdG Monoclonal Antibody (e.g., clone N45.1) | Immunodetection of 8-OHdG in ELISA, immunohistochemistry (IHC), and dot-blot assays. | Highly specific for the lesion. Critical for in situ visualization. Can cross-react with the free nucleotide (8-oxodGMP); careful interpretation needed. |
| Stable Isotope-Labeled 8-OHdG Internal Standard (¹⁵N₅ or ¹³C₁₅) | Internal standard for LC-MS/MS quantification. Corrects for sample loss and ionization efficiency variations. | Essential for gold-standard quantification. Commercially available from specialty chemical suppliers. |
| Synthetic Oligonucleotide with site-specific 8-oxodG | Substrate for in vitro OGG1 activity assays, structural studies (crystallography), and binding assays. | Must be HPLC-purified. Available from custom oligonucleotide synthesis services. Paired with C for BER studies, or A to study mispairing. |
| Recombinant Human OGG1 Protein (Active, Full-length) | Positive control for enzymatic assays, substrate for inhibitor screening, structural biology. | Available from multiple protein specialty vendors. Verify specific activity upon receipt. Catalytically inactive mutants (e.g., K249Q) are useful controls. |
| OGG1 Inhibitors (e.g., TH5487, SU0268) | Chemical probes to inhibit OGG1 activity in cellular and animal models, studying BER pathway dynamics. | Useful for validating OGG1-specific phenotypes. Consider off-target effects; use at minimal effective concentrations. |
| Modified Comet Assay Kit (with FPG or hOGG1 enzyme) | Sensitive detection of oxidative base lesions (including 8-oxodG) at the single-cell level. | The enzyme (FPG/hOGG1) converts the lesion into a strand break, detected by alkaline comet assay. Semi-quantitative but highly sensitive. |
| Deferoxamine Mesylate & Antioxidants (e.g., TEMPOL) | Used during DNA extraction and sample processing to prevent ex vivo artifactual oxidation of guanine. | Critical for accurate baseline measurement of 8-OHdG. Include in all lysis and storage buffers. |
Within the context of the 8-hydroxy-2’-deoxyguanosine (8-OHdG) base excision repair (BER) pathway, the 8-oxoguanine DNA glycosylase 1 (OGG1) enzyme serves as the primary sentinel for the recognition and initiation of repair of the highly mutagenic 8-oxo-7,8-dihydroguanine (8-oxoG) lesion. This oxidative DNA damage, resulting from reactive oxygen species (ROS), leads to G:C to T:A transversion mutations if left unrepaired. This whitepaper provides an in-depth technical analysis of OGG1's structural determinants, its multiple isoforms derived from alternative splicing, and their distinct subcellular localization—factors critical for understanding its function and for therapeutic targeting in diseases like cancer, neurodegeneration, and aging.
Structural Architecture of OGG1
Human OGG1 is a bifunctional DNA glycosylase possessing both glycosylase and AP lyase activities. The core structure is highly conserved.
Key Structural Domains:
- Helix-hairpin-Helix (HhH) and GPD Domain: The central DNA-binding motif that facilitates lesion recognition and binding.
- Intercalating Residues: Specifically, Phe319 and Cys253 intercalate into the DNA duplex to flip the 8-oxoG lesion into the active site pocket.
- Lys249 Residue: The critical nucleophile responsible for the AP lyase activity via a Schiff base intermediate.
- Asp268 and His270 Residues: Essential for the glycosylase hydrolysis step.
Table 1: Quantitative Structural Parameters of Human OGG1 (α-OGG1)
| Parameter | Value / Description | Experimental Method |
|---|---|---|
| Protein Length (α-isoform) | 345 amino acids | cDNA sequencing |
| Molecular Weight | ~39 kDa | SDS-PAGE / Mass Spectrometry |
| DNA Binding Affinity (Kd for 8-oxoG:C) | 5 - 15 nM | Surface Plasmon Resonance (SPR) |
| Glycosylase Turnover (kcat) | ~0.5 - 2.0 min-1 | Steady-state kinetics |
| AP Lyase Rate Constant | ~0.1 - 0.5 min-1 | Pre-steady-state kinetics |
| Lesion Specificity Ratio (8-oxoG:C vs. G:C) | >104-fold | Competitive EMSA / Activity Assay |
Isoforms: Diversity Through Alternative Splicing
The hOGG1 gene, located on chromosome 3p26.2, undergoes complex alternative splicing, generating multiple isoforms with distinct first exons and subcellular targeting.
Table 2: Major Human OGG1 Isoforms and Characteristics
| Isoform | Transcript ID | Length (aa) | Primary Localization | Key Features |
|---|---|---|---|---|
| α-OGG1 (Type 1a) | NM_002542 | 345 | Nucleus | Major nuclear form; classic BER activity. |
| β-OGG1 (Type 2a) | NM_016821 | 424 | Mitochondria | N-terminal mitochondrial targeting sequence (MTS). |
| γ-OGG1 | AJ243038 | 368 | Cytoplasm (?)/Nucleus | Poorly characterized; lacks canonical NLS. |
| δ-OGG1 | AK311723 | 331 | Nucleus | Alternative C-terminus; function under investigation. |
Subcellular Localization and Regulation
The spatial partitioning of OGG1 isoforms is a critical regulatory layer for genome and mitochondrial DNA maintenance.
- Nuclear (α-OGG1): Contains a nuclear localization signal (NLS) in the C-terminus. Accumulation at sites of oxidative stress is regulated by post-translational modifications (e.g., phosphorylation, acetylation).
- Mitochondrial (β-OGG1): Directed by an N-terminal 23-amino acid MTS. Its import is dependent on the mitochondrial membrane potential (ΔΨm).
- Dynamic Shuttling: Certain stresses or signals may induce relocalization between compartments.
Diagram 1: OGG1 Isoform Generation and Localization
Key Experimental Protocols
5.1. OGG1 Activity Assay (Biochemical)
- Purpose: Quantify glycosylase/AP lyase activity of purified OGG1.
- Substrate: Synthetic double-stranded oligonucleotide (e.g., 34-mer) containing a single 8-oxoG:C base pair, 5’-end labeled with ³²P.
- Protocol:
- Reaction Setup: Incubate 10-50 nM OGG1 with 100 nM radiolabeled substrate in reaction buffer (20 mM Tris-HCl pH 7.5, 100 mM KCl, 1 mM EDTA, 1 mg/mL BSA) at 37°C.
- Time Course: Aliquot reactions at time points (e.g., 0, 2, 5, 10, 20, 30 min).
- Termination: Add 2 volumes of stop buffer (95% formamide, 20 mM EDTA, 0.05% bromophenol blue).
- Analysis: Denature samples at 95°C, resolve products on a 20% denaturing polyacrylamide gel (7 M urea).
- Quantification: Visualize via phosphorimaging. Cleavage product (shorter band) intensity relative to total signal quantifies activity.
5.2. Subcellular Localization via Fluorescent Tagging
- Purpose: Determine the localization of OGG1 isoforms in living cells.
- Protocol:
- Cloning: Fuse cDNA of OGG1 isoform (e.g., α or β) in-frame to GFP (or mCherry) in a mammalian expression vector.
- Transfection: Transfect HeLa or U2OS cells using lipid-based reagents (e.g., Lipofectamine 3000).
- Staining: At 24-48h post-transfection, stain cells with organelle-specific dyes (MitoTracker Deep Red for mitochondria, Hoechst for nucleus).
- Imaging: Acquire high-resolution confocal microscopy images.
- Colocalization Analysis: Use software (e.g., ImageJ, Coloc2) to calculate Pearson's correlation coefficient between GFP-OGG1 and organelle marker signals.
5.3. Measurement of Cellular 8-oxoG Repair Capacity
- Purpose: Assess functional OGG1 activity in cell lysates.
- Substrate: As per 5.1.
- Protocol:
- Lysate Preparation: Harvest cells, lyse in buffer containing 20 mM HEPES-KOH (pH 7.5), 100 mM KCl, 0.5% NP-40, protease inhibitors. Clear by centrifugation.
- Protein Quantification: Normalize lysate concentration (e.g., 10 µg total protein per reaction).
- Repair Assay: Incubate lysate with radiolabeled 8-oxoG substrate for 30-60 min at 37°C.
- Analysis: Process and analyze as in 5.1. Activity is expressed as fmol of cleaved product per µg protein per hour.
The OGG1 BER Pathway
Diagram 2: The 8-oxoG BER Pathway Initiated by OGG1
The Scientist's Toolkit: Key Research Reagent Solutions
Table 3: Essential Reagents for OGG1 Research
| Reagent / Material | Supplier Examples | Function & Application |
|---|---|---|
| Recombinant Human OGG1 Protein | Novus, Abcam, internal purification | Positive control for activity assays, structural studies, inhibitor screening. |
| 8-oxoG-containing Oligonucleotides | Midland Certified, Eurogentec | Defined substrate for glycosylase/AP lyase activity assays (in vitro and cell lysate). |
| Anti-OGG1 Antibodies (e.g., clone EPR3310, D1H6D) | Abcam, Cell Signaling Tech, Santa Cruz | Immunoblotting (isoform detection), immunohistochemistry, immunoprecipitation. |
| OGG1 CRISPR/Cas9 Knockout Cell Lines | Horizon Discovery, internal generation | Isogenic controls for functional studies to define OGG1-specific phenotypes. |
| OGG1 Inhibitors (e.g., TH5487, SU0268) | MedChemExpress, Tocris | Chemical probes to acutely inhibit OGG1 activity in cellular models. |
| Mitochondrial/Nuclear Fractionation Kits | Abcam, Thermo Fisher | Isolate subcellular compartments to confirm isoform localization (β-OGG1 in mitochondria). |
| 8-OHdG ELISA Kits | Cayman Chemical, JaICA | Quantify global levels of the 8-oxoG repair product (8-OHdG) in urine, serum, or tissue as a biomarker of oxidative stress/DNA damage. |
| Live-Cell Organelle Trackers(MitoTracker, Hoechst) | Thermo Fisher | Fluorescent dyes for colocalization microscopy with GFP-tagged OGG1 isoforms. |
Abstract This technical guide details the enzymatic mechanism of 8-oxoguanine DNA glycosylase 1 (OGG1) within the Base Excision Repair (BER) pathway. Framed within the broader thesis of targeting the 8-OHdG repair pathway for therapeutic intervention, this document provides a step-by-step molecular dissection of OGG1-initiated BER, supported by current quantitative data, experimental protocols, and visualization. The content is structured for researchers and drug development professionals investigating genomic instability, cancer, aging, and inflammatory diseases linked to oxidative DNA damage.
1. Introduction: OGG1 and the 8-OHdG Lesion Reactive oxygen species (ROS) generate the premutagenic lesion 7,8-dihydro-8-oxoguanine (8-oxoG or 8-OHdG). If unrepaired, 8-oxoG mispairs with adenine during replication, leading to G:C to T:A transversion mutations. OGG1 is the primary mammalian DNA glycosylase responsible for initiating the repair of 8-oxoG paired with cytosine. Its activity is the critical first step in the BER pathway for oxidized bases, making it a focal point for research into modulating DNA repair capacity.
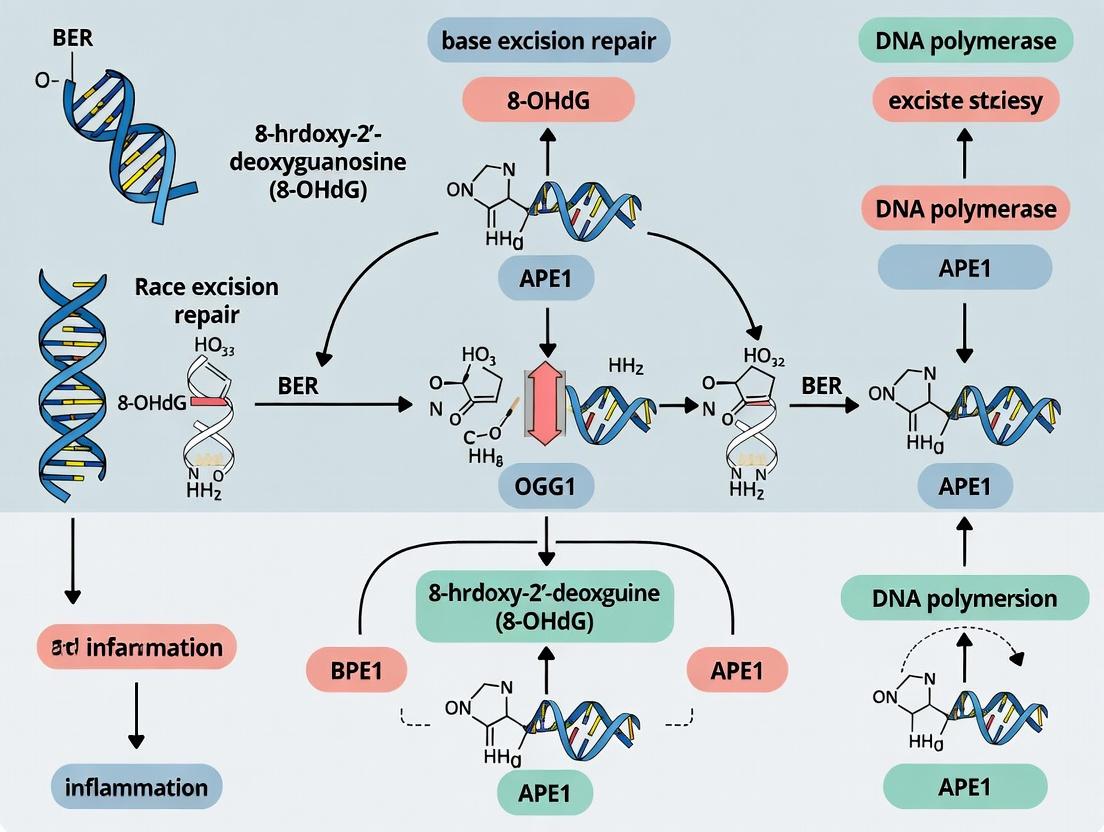
2. The OGG1-Mediated BER Pathway: A Stepwise Mechanism The repair of 8-oxoG:C via OGG1 follows a coordinated multi-step process.
Diagram 1: OGG1-BER Pathway Overview
- Step 1: Recognition and Binding. OGG1 scans the DNA minor groove, recognizing the 8-oxoG lesion via a lesion-specific pocket. It flips the damaged nucleotide into its active site while extruding the complementary cytosine.
- Step 2: Glycosidic Bond Cleavage (Glycosylase Activity). OGG1 catalyzes the hydrolysis of the N-glycosidic bond between the 8-oxoG base and the deoxyribose sugar. This releases the free base (8-oxoG) and creates an abasic site (apurinic/apyrimidinic or AP-site) in the DNA backbone.
- Step 3: AP-Site Incision (AP Lyase Activity). OGG1 possesses intrinsic AP lyase activity. It catalyzes a β-elimination reaction, cleaving the DNA backbone 3' to the AP-site, generating a single-strand break (SSB) with 3'-phospho-α,β-unsaturated aldehyde (3'-dRP) and 5'-phosphate termini.
- Step 4: Backbone Processing and Gap Filling. The AP endonuclease 1 (APE1) processes the 3'-blocking lesion, leaving a 3'-OH terminus. DNA polymerase β (Pol β) then inserts the correct nucleotide (dCMP) and removes the 5'-deoxyribose phosphate (5'-dRP) via its lyase activity.
- Step 5: Strand Ligation. DNA ligase IIIα in complex with XRCC1 (in short-patch BER) or DNA ligase I (in long-patch BER) seals the nick, completing the repair.
3. Quantitative Data on OGG1 Activity & Expression Key biochemical and cellular metrics for OGG1 are summarized below.
Table 1: Kinetic and Expression Parameters of Human OGG1
| Parameter | Value (Approx.) | Context / Notes |
|---|---|---|
| Km for 8-oxoG:C | 2 - 20 nM | In vitro, varies with sequence context |
| kcat (Turnover) | 0.5 - 5.0 min⁻¹ | Slow turnover, product inhibition common |
| Specificity Constant (kcat/Km) | ~10⁸ M⁻¹min⁻¹ | High specificity for 8-oxoG vs. G |
| Primary Isoform | OGG1-1a (α) | Nuclear; 345 amino acids |
| Alternative Isoform | OGG1-2a (β) | Mitochondrial; differs at C-terminus |
| Basal Cellular Level | 10,000 - 70,000 molecules/cell | Tissue and cell type dependent |
| Induction by Oxidative Stress | 1.5 - 3 fold | Transcriptional upregulation via NRF2/ARE |
4. Key Experimental Protocols Protocol 1: In Vitro OGG1 Glycosylase/AP Lyase Assay (Oligonucleotide-Based)
- Principle: A synthetic oligonucleotide containing a site-specific 8-oxoG lesion is 5'-[³²P]-end-labeled. Incubation with OGG1 results in cleavage, which is resolved and quantified via denaturing polyacrylamide gel electrophoresis (PAGE).
- Reagents: 8-oxoG-containing oligonucleotide duplex; purified recombinant OGG1; reaction buffer (20 mM HEPES-KOH pH 7.4, 100 mM KCl, 1 mM EDTA, 0.1 mg/ml BSA); stop solution (95% formamide, 20 mM EDTA, dyes); T4 Polynucleotide Kinase, [γ-³²P]ATP.
- Procedure:
- Anneal labeled oligonucleotide to its complementary strand.
- Assemble 20 µL reactions containing ~10 fmol of duplex DNA and OGG1 (e.g., 1-100 ng) in reaction buffer. Incubate at 37°C for 15-60 minutes.
- Terminate reaction with formamide stop solution and heat denature.
- Resolve products on a 15-20% denaturing polyacrylamide gel.
- Visualize and quantify cleavage product (shorter band) using a phosphorimager.
- Analysis: Calculate product yield or enzyme kinetics (Vmax, Km).
Protocol 2: Measuring Cellular 8-oxoG Repair Capacity (Comet Assay)
- Principle: The alkaline comet assay (single-cell gel electrophoresis) detects SSBs. Cells treated with a photosensitizer (e.g., Ro 19-8022 plus visible light) generate 8-oxoG lesions, which are converted to SSBs upon addition of lesion-specific glycosylases (including OGG1) in the assay, reflecting the cell's repair capacity.
- Reagents: Cells of interest; Ro 19-8022; lysis solution (2.5 M NaCl, 100 mM EDTA, 10 mM Tris, 1% Triton X-100, pH 10); recombinant OGG1 or FPG (for assay control); alkaline electrophoresis buffer (300 mM NaOH, 1 mM EDTA, pH >13).
- Procedure:
- Treat cells with Ro 19-8022 + light to induce 8-oxoG.
- Allow repair for varying time points (0-120 min).
- Embed cells in agarose on a microscope slide, lyse.
- Key Step: Incubate slides in enzyme buffer with or without purified OGG1/FPG (1:100 dilution, 30 min, 37°C). This converts residual 8-oxoG sites to SSBs.
- Perform alkaline unwinding and electrophoresis.
- Stain with DNA dye (e.g., SYBR Gold) and image.
- Analysis: Quantify % DNA in tail (e.g., using CometScore software). The difference in tail moment between enzyme-treated and untreated slides indicates the number of 8-oxoG lesions remaining at that repair time point.
Diagram 2: Comet Assay Workflow for OGG1 Activity
5. The Scientist's Toolkit: Key Research Reagent Solutions Table 2: Essential Materials for OGG1/BER Research
| Reagent / Material | Function & Application | Key Notes |
|---|---|---|
| Site-Specific 8-oxoG DNA Oligoduplex | Definitive substrate for in vitro OGG1 kinetic assays, specificity studies, and structural biology. | Commercially synthesized; purity critical. Used in Protocols 1. |
| Recombinant Human OGG1 Protein (Active) | Positive control for enzymatic assays, for generating AP-sites/SSBs in comet assays, and for inhibitor screening. | Available as wild-type and catalytic mutant (e.g., K249Q) controls. |
| Anti-8-OHdG Antibody | Immunodetection of the lesion in situ (immunofluorescence), in tissue sections (IHC), or by ELISA. | Distinguish between free 8-OHdG (urine/serum) and DNA-incorporated. |
| OGG1-Specific Inhibitors (e.g., TH5487, SU0268) | Chemical probes to dissect OGG1's biological function in cells and validate it as a therapeutic target. | Useful in inflammation/cancer models to inhibit OGG1's glycosylase or G4-binding activity. |
| APE1 Inhibitor (e.g., CRT0044876) | Tool to block the BER pathway downstream of OGG1, inducing synthetic lethality or studying APE1's role. | Accumulates AP-sites, leading to replication stress. |
| NRF2 Activators/Inhibitors | Modulate cellular oxidative stress response and transcriptional upregulation of OGG1 and other antioxidant genes. | Links repair capacity to cellular redox signaling pathways. |
| OGG1 Knockout/Knockdown Cells (siRNA, CRISPR-Cas9) | Isogenic cell lines to establish the specific contribution of OGG1 to overall 8-oxoG repair and cellular phenotypes. | Essential for functional studies on genomic stability, senescence, and metabolic responses. |
6. Conclusion and Therapeutic Context OGG1-initiated BER is a vital guardian against the mutagenic consequences of oxidative DNA damage. Detailed mechanistic understanding, as outlined in this guide, provides a foundation for translational research. Within the thesis of targeting the 8-OHdG repair pathway, OGG1 emerges as a dual-profile target: its inhibition may sensitize cancer cells to radio/chemotherapy or modulate inflammation, while its enhancement could potentially protect against aging and neurodegenerative diseases. The continued development of specific chemical probes, accurate biomarkers (like 8-OHdG levels), and sophisticated cellular models will be crucial for advancing these therapeutic strategies.
8-Hydroxy-2’-deoxyguanosine (8-OHdG or 8-oxodG) is a predominant form of oxidative DNA damage resulting from the attack of reactive oxygen species (ROS) on the C8 of guanine. Within the canonical base excision repair (BER) pathway, the primary enzyme responsible for its recognition and initiation of repair is the 8-oxoguanine DNA glycosylase 1 (OGG1). This whitepaper details the precise molecular and cellular consequences of unrepaired 8-OHdG, framing its pathology within the failure of the OGG1-mediated BER pathway, and provides a technical guide for its study.
Mutagenic Potential: Mispairing and Replication Outcomes
The principal threat of 8-OHdG lies in its altered base-pairing properties. While the anti conformation typically pairs with cytosine, the lesion can adopt a syn conformation, allowing Hoogsteen base pairing with adenine. This dual coding capacity leads to transversion mutations.
Table 1: Replication Outcomes of 8-OHdG Lesions
| Template Base | Incoming dNTP | Polymerase | Result | Mutation Type |
|---|---|---|---|---|
| 8-OHdG (anti) | dCTP | Replicative (Pol δ/ε) | Correct incorporation | Faithful replication |
| 8-OHdG (syn) | dATP | Replicative (Pol δ/ε) | Misincorporation | G:C → T:A Transversion |
| 8-OHdG | dCTP | Translesion Synthesis (Pol κ, η) | Often correct bypass | Error-free TLS |
| 8-OHdG | dATP | Translesion Synthesis (Pol ζ) | Misincorporation bypass | Mutagenic TLS |
Detailed Experimental Protocol: Measuring 8-OHdG-Induced Mutagenesis (LacZ' Plasmid-Based Assay)
Objective: To quantify the mutation frequency and spectrum caused by site-specifically inserted 8-OHdG in a bacterial or mammalian plasmid system.
Materials:
- Oligonucleotide: A 20-30mer containing a single 8-OHdG lesion at a defined position.
- Vector: gapped duplex plasmid (e.g., pUC19 with lacZα gene).
- Enzymes: T4 Polynucleotide Kinase, T4 DNA Ligase.
- Bacterial Strain: E. coli wild-type and repair-deficient (e.g., mutY-/mutM-) strains.
- Media: LB agar plates containing X-Gal (40 µg/mL) and IPTG (0.1 mM).
- Controls: Oligonucleotide with unmodified G at the same position.
Procedure:
- Annealing & Ligation: Phosphorylate the lesion-containing oligonucleotide. Anneal it to the single-stranded gap of the prepared plasmid vector. Ligate to form a covalently closed circular construct.
- Transformation: Introduce the ligated plasmid into competent E. coli cells (both wild-type and repair-deficient).
- Phenotypic Screening: Plate transformed cells on X-Gal/IPTG plates. Blue colonies result from functional β-galactosidase (lacZ gene intact). White or light blue colonies indicate a mutation that inactivated the gene.
- Mutation Frequency Calculation: (Number of white colonies / Total number of colonies) x 100%.
- Sequence Analysis: Isolate plasmid from white colonies and sequence the target region to determine the exact mutation (primarily G→T transversions).
Disease Associations and Quantitative Data
Persistent 8-OHdG accumulation, indicative of oxidative stress and/or deficient BER, is epidemiologically and mechanistically linked to numerous pathologies.
Table 2: Association of 8-OHdG Levels with Human Diseases
| Disease Category | Tissue/Biofluid Analyzed | Reported Increase in 8-OHdG vs. Control | Key Supporting Evidence |
|---|---|---|---|
| Neurodegenerative (Alzheimer's) | Post-mortem Brain Nuclei | 2 to 3-fold | Co-localization with amyloid plaques; correlation with cognitive decline. |
| Cancer (Various) | Tumor Tissue / Urine | 1.5 to 4-fold (type-dependent) | Driver mutations (e.g., KRAS) consistent with 8-OHdG mutagenesis; elevated in premalignant lesions. |
| Atherosclerosis | Vascular Smooth Muscle Cells | >2-fold | Found in atherosclerotic plaques; promotes pro-inflammatory gene expression via OGG1-BER intermediates. |
| Metabolic (Type 2 Diabetes) | Patient Serum / Leukocytes | ~1.8-fold | Positive correlation with HbA1c levels; contributes to β-cell dysfunction. |
| Chronic Lung Disease (COPD) | Lung Epithelium / BALF | Significantly Elevated | Marker of oxidative stress from cigarette smoke; drives cellular senescence. |
Signaling Dysregulation Beyond Mutation: The Role of Abasic Sites and OGG1
Unrepaired 8-OHdG can block transcription. More recently, the BER process itself, when initiated but not completed, generates signaling intermediates. OGG1's incision creates an abasic site (AP site). This AP site, if not promptly processed by APE1, can be a blocking lesion. Furthermore, OGG1 bound to its AP site product can act as a DNA-bound signaling platform, recruiting transcription factors like NF-κB and promoting the expression of pro-inflammatory and pro-fibrotic genes, linking oxidative DNA damage to chronic inflammation.
Title: Dual Pathways from 8-OHdG to Mutation and Inflammation
The Scientist's Toolkit: Key Research Reagent Solutions
Table 3: Essential Reagents for 8-OHdG and OGG1 Pathway Research
| Reagent/Material | Function & Application | Example/Vendor |
|---|---|---|
| Anti-8-OHdG Antibody | Immunodetection in tissues (IHC), cells (ICC), or ELISA. Critical for biomarker quantification. | Clone 15A3 (Santa Cruz), N45.1 (JaICA) |
| Site-Specific 8-OHdG Oligonucleotides | Substrates for in vitro enzyme assays, replication, or structural studies to study the lesion in a defined context. | Custom synthesis from Trilink BioTechnologies or Berry & Associates. |
| Recombinant Human OGG1 Protein | For in vitro glycosylase activity assays, structural studies, or as a positive control in cellular experiments. | ActiveMotif, Novus Biologicals, Abcam. |
| OGG1 Inhibitors (Small Molecules) | To probe OGG1 function in cells, induce BER intermediate accumulation, or assess therapeutic potential. | TH5487, SU0268. |
| APE1 Inhibitor | To stall BER at the AP site stage, allowing study of downstream signaling consequences. | CRT0044876, AR03. |
| LC-MS/MS Standard (¹⁵N₅-8-OHdG) | Internal standard for the gold-standard quantification of 8-OHdG in urine, serum, or tissue digests. | Cambridge Isotope Laboratories. |
| OGG1-Knockout Cell Lines | Isogenic controls to definitively attribute phenotypes to OGG1 activity. Available in various backgrounds (e.g., HEK293, MEFs). | ATCC, or generated via CRISPR-Cas9. |
| Comet Assay Kit (Enzyme-Modified) | To measure oxidative base damage (using Fpg or hOGG1 enzyme) at the single-cell level. | Trevigen, R&D Systems. |
The biological consequence of unrepaired 8-OHdG is a dual threat: it is a potent pre-mutagenic lesion leading to fixed genomic G→T transversions associated with cancer and aging, and its repair process can generate signaling intermediates that drive pathogenic inflammation. Research within the OGG1-BER pathway must therefore consider both the mutagenic and the epigenetic-like signaling outcomes. Targeting this pathway offers strategies not only for cancer prevention but also for modulating inflammation in chronic degenerative diseases.
Detecting 8-OHdG and Measuring OGG1 Activity: Essential Techniques and Research Applications
The quantification of 8-hydroxy-2’-deoxyguanosine (8-OHdG) serves as a critical biomarker for oxidative DNA damage and the efficiency of the base excision repair (BER) pathway. Within the broader thesis on the OGG1 (8-oxoguanine DNA glycosylase 1) enzyme—the primary initiator of BER for 8-oxoGua lesions—accurate measurement of its substrate (8-oxoGua in DNA) and its excised product (8-OHdG in urine, serum, or tissue) is fundamental. This technical guide evaluates three gold-standard analytical platforms—HPLC-ECD, LC-MS/MS, and ELISA—for their application in quantifying 8-OHdG, a direct readout of oxidative stress and OGG1 activity in physiological and pathological states relevant to aging, cancer, neurodegeneration, and drug development.
The choice of assay depends on required sensitivity, specificity, throughput, and sample matrix.
Table 1: Core Characteristics of Gold-Standard 8-OHdG Assays
| Feature | HPLC-ECD | LC-MS/MS | Competitive ELISA |
|---|---|---|---|
| Detection Principle | Electrochemical oxidation of 8-OHdG | Mass-to-charge ratio (MRM) | Antigen-antibody competition |
| Key Strength | Excellent sensitivity for pure analytes | Unmatched specificity & structural confirmation | High throughput; minimal sample prep |
| Key Limitation | Co-eluting interferents; lower specificity | High cost; complex operation | Cross-reactivity risks; semi-quantitative |
| Typical LOD | 1-5 fmol on-column | 0.1-0.5 fmol on-column | ~0.5-1.0 ng/mL |
| Sample Throughput | Low (30-60 min/sample) | Medium (5-15 min/sample) | High (96 samples in 3-4 hrs) |
| Primary Sample Types | Urine, tissue hydrolysates, cell lysates | Urine, plasma, tissue, isolated DNA | Urine, serum/plasma, cell culture media |
| OGG1 Research Application | Quantifying total oxidative burden in tissues/cells | Definitive quantification in complex matrices; isotope dilution for absolute accuracy | Large-scale longitudinal or clinical studies screening OGG1 activity/modulation |
Detailed Methodologies and Protocols
HPLC-ECD Protocol for Urinary 8-OHdG
Principle: Sample purification followed by chromatographic separation and electrochemical detection.
Sample Preparation:
- Collect urine in EDTA-containing tubes, centrifuge (3,000 x g, 10 min, 4°C), and store at -80°C.
- Thaw and dilute 1:1 with 20 mM phosphate buffer (pH 7.4).
- Purify using solid-phase extraction (SPE) cartridges (e.g., C18). Condition with methanol and water. Load sample, wash with water and 5% methanol, elute 8-OHdG with 20% methanol. Dry eluate under vacuum and reconstitute in mobile phase.
Chromatography & Detection:
- Column: C18 reverse-phase column (e.g., 4.6 x 150 mm, 5 µm).
- Mobile Phase: 50 mM sodium acetate, 5% methanol, pH 5.2. Isocratic flow: 1.0 mL/min.
- Electrochemical Detector: Glassy carbon working electrode, potential set at +600 mV vs. Ag/AgCl reference.
- Injection Volume: 20-50 µL.
- Quantify by comparing peak area at ~8-10 min retention time to external calibration curve (1-100 nM).
LC-MS/MS Protocol (Isotope Dilution) for Plasma/Tissue 8-OHdG
Principle: Ultimate specificity using MRM, with internal standardization by stable isotope-labeled 8-OHdG.
Sample Preparation with Internal Standard:
- Add a known amount of ¹⁵N₅-8-OHdG or d₃-8-OHdG internal standard to plasma/tissue homogenate.
- Precipitate proteins with ice-cold methanol (1:3 v/v), vortex, centrifuge (15,000 x g, 15 min, 4°C).
- For tissue/DNA, hydrolyze with nuclease P1 and alkaline phosphatase to release nucleosides.
- Purify supernatant via off-line or on-line SPE (ion-pairing free methods preferred for MS).
LC-MS/MS Parameters:
- LC: HILIC or reverse-phase (e.g., BEH C18, 2.1 x 100 mm, 1.7 µm). Mobile phase A: 0.1% formic acid in water; B: 0.1% formic acid in acetonitrile. Gradient elution.
- MS/MS: Triple quadrupole in positive electrospray ionization (ESI+) mode.
- MRM Transitions: 8-OHdG: m/z 284→168 (quantifier), 284→140 (qualifier). ¹⁵N₅-8-OHdG: m/z 289→173.
- Quantify using the ratio of analyte-to-internal standard peak area against a calibration curve.
Competitive ELISA Protocol
Principle: Competition between sample 8-OHdG and plate-bound 8-OHdG for a limited amount of specific antibody.
- Procedure:
- Coat a 96-well plate with an 8-OHdG-protein conjugate (e.g., 8-OHdG-BSA) in carbonate buffer overnight at 4°C.
- Block plates with 1% BSA/PBS for 2 hours at room temperature (RT).
- Prepare standards (0.5-100 ng/mL) and pre-treat samples (e.g., urine dilution 1:10).
- In each well, mix 50 µL of standard/sample with 50 µL of primary anti-8-OHdG monoclonal antibody. Incubate 1-2 hours at RT.
- Wash plates (PBS-Tween). Add 100 µL of HRP-conjugated secondary antibody. Incubate 1 hour at RT.
- Wash, add TMB substrate. Incubate 15-30 min in dark. Stop reaction with 1M H₂SO₄.
- Read absorbance at 450 nm (reference 620 nm). Inverse correlation: higher sample [8-OHdG] leads to lower signal.
The Scientist's Toolkit: Essential Research Reagents
Table 2: Key Reagent Solutions for 8-OHdG Quantification & OGG1 Research
| Reagent/Material | Function & Explanation |
|---|---|
| Authentic 8-OHdG Standard | Crucial for generating calibration curves in all assays. High-purity standard ensures accurate quantification. |
| Stable Isotope-Labeled 8-OHdG (e.g., ¹⁵N₅) | Serves as internal standard in LC-MS/MS, correcting for sample loss and ionization variability, enabling absolute quantification. |
| Anti-8-OHdG Monoclonal Antibody (Clone N45.1) | The gold-standard antibody for ELISA and immunohistochemistry. Specificity must be validated to avoid cross-reactivity. |
| 8-OHdG-BSA Conjugate | Required for coating plates in competitive ELISA, providing the immobilized antigen. |
| C18 Solid-Phase Extraction (SPE) Cartridges | For sample clean-up in HPLC-ECD and LC-MS/MS, removing salts and interfering compounds from biological matrices. |
| Nuclease P1 & Alkaline Phosphatase | Enzymes used to digest DNA to deoxynucleosides for measurement of genomic 8-oxoGua/8-OHdG by HPLC or LC-MS/MS. |
| Recombinant Human OGG1 Protein | Positive control for in vitro BER activity assays, used to validate cellular models or screen for OGG1 inhibitors/activators. |
| OGG1-Specific Inhibitors (e.g., TH5487) | Pharmacological tools used in research to directly link measured 8-OHdG levels or genomic 8-oxoGua to OGG1 activity. |
Visualization of Workflows and Pathways
Diagram 1: OGG1-Mediated BER Pathway & 8-OHdG Generation
Diagram 2: HPLC-ECD vs LC-MS/MS Analytical Workflow
Diagram 3: Competitive ELISA Principle for 8-OHdG
The detection and quantification of 8-hydroxy-2'-deoxyguanosine (8-OHdG), a predominant marker of oxidative DNA damage, is a cornerstone in research investigating the base excision repair (BER) pathway. This lesion is primarily excised by the enzyme 8-oxoguanine DNA glycosylase 1 (OGG1). Visualizing 8-OHdG in situ via immunohistochemistry (IHC) and immunofluorescence (IF) provides critical spatial and contextual information within tissues, enabling researchers to correlate oxidative damage with specific cell types, pathological states, and therapeutic interventions. This technical guide details methodologies for optimal visualization of 8-OHdG, framed within the broader thesis of understanding OGG1-mediated repair dynamics, its deficiencies in disease, and the evaluation of novel OGG1-targeted therapeutics.
Core Methodologies for 8-OHdG Detection
Sample Preparation and Critical Pre-Treatment
Accurate detection requires careful sample handling to prevent artifactual oxidation.
- Tissue Fixation: Immediate fixation in 10% neutral buffered formalin for 24-48 hours is standard. Over-fixation can mask epitopes.
- Sectioning: Paraffin-embedded sections (4-5 µm) or frozen sections can be used. Paraffin sections require deparaffinization and rehydration.
- Epitope Retrieval: Mandatory for formalin-fixed tissues. Antigen retrieval is performed using sodium citrate buffer (10 mM, pH 6.0) or Tris-EDTA buffer (pH 9.0) under heated conditions (e.g., microwave or pressure cooker).
- Enzymatic Treatment (Optional but Recommended): Treatment with nuclease P1 (2-10 U/mL) and alkaline phosphatase (5-10 U/mL) is often employed to liberate DNA-bound 8-OHdG, significantly enhancing antibody accessibility and signal intensity. Incubate for 30-60 minutes at 37°C.
- Blocking: Incubate with 2-5% normal serum (from the species of the secondary antibody) and 1-3% bovine serum albumin (BSA) in PBS for 1 hour to reduce non-specific binding.
Immunohistochemistry (IHC) Protocol
This protocol yields a chromogenic, permanent stain viewable by brightfield microscopy.
- Primary Antibody Incubation: Apply monoclonal mouse anti-8-OHdG antibody (e.g., clone 15A3) at a predetermined optimal dilution (typically 1:50-1:200 in blocking buffer) overnight at 4°C in a humidified chamber.
- Washing: Rinse slides 3x with PBS containing 0.025% Triton X-100 (PBS-T).
- Secondary Antibody Incubation: Apply a biotinylated or HRP-polymer-conjugated anti-mouse IgG secondary antibody for 1 hour at room temperature (RT).
- Signal Development (for biotin systems): Incubate with Avidin-Biotin Complex (ABC) reagent (e.g., Vectastain) for 30 minutes. Develop using 3,3'-Diaminobenzidine (DAB) substrate, which yields a brown precipitate. Monitor development under a microscope (typically 2-10 minutes).
- Counterstaining and Mounting: Counterstain nuclei with Hematoxylin. Dehydrate, clear, and mount with a permanent mounting medium.
Immunofluorescence (IF) Protocol
This protocol enables multiplexing and high-resolution, subcellular localization.
- Primary Antibody Incubation: As in IHC, incubate with anti-8-OHdG primary antibody overnight at 4°C.
- Washing: 3x with PBS-T.
- Secondary Antibody Incubation: Apply a fluorophore-conjugated secondary antibody (e.g., Alexa Fluor 488, 555, or 647) at a 1:500-1:1000 dilution for 1 hour at RT in the dark.
- Nuclear Counterstain and Mounting: Apply 4',6-diamidino-2-phenylindole (DAPI) to stain nuclei. Aqueous, anti-fade mounting medium is required.
Critical Controls:
- Negative Control: Omit primary antibody or use an isotype control.
- Competition Control: Pre-incubate primary antibody with an excess of authentic 8-OHdG antigen to abolish specific staining.
- Positive Control: Include a tissue section known to have high oxidative stress (e.g., ischemic kidney, hepatotoxicant-treated liver).
Data Presentation and Quantification
Quantitative analysis transforms visual data into objective metrics. Common approaches are summarized below.
Table 1: Quantitative Methods for 8-OHdG IHC/IF Analysis
| Method | Description | Output Metric | Suitable For |
|---|---|---|---|
| Manual Scoring | Semi-quantitative scoring by a blinded observer (e.g., H-score, Allred score). | Ordinal score (0-3+, 0-300) | Initial screening, heterogeneous tissues. |
| Digital Image Analysis | Software-based (e.g., ImageJ, QuPath, HALO) thresholding and particle analysis. | Percentage of positive nuclei, integrated optical density (IOD), mean fluorescence intensity (MFI). | High-throughput, objective comparison between groups. |
| Co-localization Analysis | Analysis of IF multiplex images to determine spatial overlap (e.g., with OGG1, γH2AX). | Pearson's Correlation Coefficient, Mander's Overlap Coefficient. | Pathway mechanism studies, e.g., 8-OHdG/OGG1 interaction. |
The Scientist's Toolkit: Key Reagent Solutions
Table 2: Essential Research Reagents for 8-OHdG Visualization
| Reagent | Function / Purpose | Key Consideration |
|---|---|---|
| Anti-8-OHdG mAb (Clone 15A3) | Primary antibody for specific detection of the 8-OHdG epitope in DNA. | Clone specificity is critical; 15A3 is widely validated for IHC/IF. Verify species reactivity. |
| Nuclease P1 & Alkaline Phosphatase | Enzyme cocktail to digest DNA and dephosphorylate, liberating free nucleosides and enhancing antibody access. | Optimization of concentration and time is required for each tissue type. |
| Antigen Retrieval Buffer | Reverses formaldehyde-induced cross-links to expose hidden epitopes. | pH and method (heat-induced vs. enzymatic) must be optimized for the primary antibody. |
| HRP/DAB Detection Kit | For chromogenic IHC signal generation. Provides high sensitivity and permanent stain. | DAB is a carcinogen; use with appropriate safety controls. Signal can be quenched by endogenous peroxidases. |
| Fluorophore-conjugated Secondary Antibody | For IF detection, binds to primary antibody and emits light at a specific wavelength. | Choose fluorophores matched to your microscope's filter sets. Consider multiplexing compatibility. |
| DAPI Nucleic Acid Stain | Counterstain for labeling all cell nuclei in blue/cyan channel in IF. | Essential for defining nuclear boundaries for 8-OHdG quantification. |
| Anti-fade Mounting Medium | Preserves fluorescence intensity by reducing photobleaching during microscopy and storage. | Required for any fluorescence-based imaging. |
Experimental and Signaling Pathways
Diagram 1: 8-OHdG Formation, OGG1 Repair, and Detection
Diagram 2: IHC vs. IF Experimental Workflow for 8-OHdG
8-Oxoguanine (8-oxoG) is a critical mutagenic DNA lesion generated by reactive oxygen species. Its primary repair is initiated by 8-oxoguanine DNA glycosylase 1 (OGG1), the main enzyme in the Base Excision Repair (BER) pathway for 8-oxoG removal. Accurately measuring OGG1 activity is fundamental for elucidating BER pathway dynamics, studying oxidative stress-related diseases (e.g., cancer, neurodegeneration), and developing therapeutic modulators. This guide details current in vitro and cellular methodologies for quantifying OGG1 glycosylase activity within the broader research context of the 8-OHdG BER pathway.
Core Principles of the OGG1-Mediated BER Pathway
OGG1 is a bifunctional glycosylase that excises 8-oxoG paired with cytosine, performing both N-glycosyl bond cleavage (glycosylase activity) and subsequent AP lyase activity, creating a single-strand break at the abasic site.
Title: OGG1-initiated Base Excision Repair Pathway
In VitroFunctional Assays
These assays use purified OGG1 protein or cell extracts and synthetic oligonucleotide substrates.
Oligonucleotide Cleavage Assay (Gel-Based)
Principle: A fluorescently labeled (e.g., FAM, Cy5) oligonucleotide containing a single 8-oxoG:C pair is incubated with OGG1. Glycosylase/AP lyase activity cleaves the strand, producing a shorter fragment separable by denaturing polyacrylamide gel electrophoresis (PAGE).
Detailed Protocol:
- Substrate Preparation: Anneal a 5'-FAM-labeled 30-mer strand containing a single 8-oxoG to its complementary strand with a C opposite the lesion.
- Reaction Setup: In a 20 µL volume:
- 20 mM Tris-HCl (pH 7.5)
- 50 mM NaCl
- 1 mM EDTA
- 1 mM DTT
- 0.1 mg/mL BSA
- 50-100 nM DNA substrate
- 1-50 nM purified OGG1 (concentration range determined empirically)
- Incubation: 37°C for 15-60 minutes.
- Reaction Stop: Add 20 µL of STOP buffer (95% formamide, 20 mM EDTA, 0.02% bromophenol blue).
- Analysis: Heat denature (95°C, 5 min), load onto 15-20% denaturing PAGE gel. Visualize and quantify using a fluorescence gel imager. Calculate activity as percent substrate converted to product.
Quantitative Data Summary: Table 1: Typical Parameters for Oligonucleotide Cleavage Assay
| Parameter | Typical Value/Range | Notes |
|---|---|---|
| Substrate Concentration | 50-100 nM | Maintain below Km for accurate initial velocity. |
| OGG1 Concentration | 1-50 nM | Titrate for linear product formation over time. |
| Reaction Time | 15-60 min | Ensure reactions are in linear range. |
| Km (8-oxoG substrate) | ~20-40 nM | Reported for human OGG1. |
| Kcat | ~0.5-2 min⁻¹ | Varies with assay conditions and OGG1 source. |
| Optimal pH | 7.5-8.0 | Tris or HEPES buffer. |
| Salt Inhibition | >150 mM NaCl | Activity decreases with increasing ionic strength. |
Fluorescence-Based Real-Time Assay (Molecular Beacon)
Principle: A hairpin oligonucleotide substrate is dual-labeled with a fluorophore (FAM) and a quencher (BHQ1). OGG1 cleavage disrupts the hairpin, separating fluorophore from quencher, increasing fluorescence.
Detailed Protocol:
- Substrate: Hairpin DNA with an 8-oxoG:C pair in the loop or stem, FAM at 5' end, BHQ1 at 3' end.
- Reaction: In a 96-well plate, mix substrate (50 nM) with OGG1 (0-100 nM) in assay buffer (20 mM HEPES-KOH pH 7.5, 50 mM KCl, 1 mM EDTA, 0.1 mg/mL BSA).
- Measurement: Monitor FAM fluorescence (excitation 485 nm, emission 520 nm) every minute for 60-120 min at 37°C in a plate reader.
- Analysis: Calculate initial velocity from the linear phase. Useful for high-throughput inhibitor screening.
Cellular Functional Assays
These assays measure OGG1 activity within the complex cellular environment.
Comet Assay (Modified for 8-oxoG)
Principle: The alkaline comet assay detects single-strand breaks. Treating cells with a lesion-specific glycosylase (like OGG1) ex vivo converts base lesions into breaks, allowing quantification of the lesion load.
Detailed Protocol (Enzyme-Linked Comet Assay):
- Cell Preparation: Embed cells in low-melting-point agarose on a comet slide. Lyse cells (2.5 M NaCl, 100 mM EDTA, 10 mM Tris, 1% Triton X-100, pH 10) for 1-24 hours at 4°C.
- Enzyme Digestion: Wash slides in enzyme reaction buffer (40 mM HEPES, 100 mM KCl, 0.5 mM EDTA, 0.2 mg/mL BSA, pH 8.0). Incubate one set of slides with purified recombinant OGG1 (e.g., 1:1000 dilution in buffer), and control set with buffer only, for 30-45 min at 37°C in a humid chamber.
- Alkaline Unwinding & Electrophoresis: Place slides in alkaline solution (300 mM NaOH, 1 mM EDTA, pH >13) for 20 min, then electrophorese at 1 V/cm for 20-30 min.
- Neutralization & Staining: Neutralize (0.4 M Tris, pH 7.5), stain with DNA dye (e.g., SYBR Gold, DAPI).
- Analysis: Image 50-100 comets per sample. The difference in % tail DNA or tail moment between OGG1-treated and buffer-treated samples represents the 8-oxoG-specific lesion load.
Immuno-Slot-Blot for AP Sites
Principle: OGG1 glycosylase activity generates abasic (AP) sites. Cellular AP sites can be quantified using an aldehyde-reactive probe (ARP) which binds specifically to the open ring form of AP sites. AP sites are a direct, transient product of OGG1 activity.
Detailed Protocol:
- DNA Isolation: Extract genomic DNA using a method that minimizes artifactual oxidation/AP site generation (e.g., gentle lysis, desferoxamine in buffers).
- ARP Labeling: Incubate DNA (typically 0.5-1 µg) with 5 mM ARP in 10 µL for 1 hour at 37°C.
- Membrane Binding: Apply ARP-labeled DNA to a positively charged nylon membrane using a slot-blot apparatus.
- Detection: Block membrane, then incubate with horseradish peroxidase (HRP)-conjugated streptavidin (binds to biotin on ARP). Develop with chemiluminescent substrate and image. Quantity relative to a standard curve of AP site-containing DNA.
Cellular Repair Capacity Measurement
Principle: Transfect cells with a plasmid or reporter construct containing a single, site-specific 8-oxoG lesion. Measure restoration of reporter gene function (e.g., luciferase) or repair synthesis via qPCR over time.
Workflow Diagram:
Title: Cellular 8-oxoG Repair Capacity Assay Workflow
The Scientist's Toolkit: Research Reagent Solutions
Table 2: Essential Materials for OGG1 Activity Assays
| Item/Reagent | Function & Brief Explanation |
|---|---|
| Recombinant OGG1 Protein | Purified human/mouse OGG1 for in vitro assays or as a positive control. Essential for standard curves and specificity controls. |
| 8-oxoG-containing Oligonucleotides | Synthetic DNA substrates with a single 8-oxoG lesion, often fluorescently labeled (FAM, Cy5) for sensitive detection of cleavage. |
| OGG1 Inhibitors (e.g., TH5487, SU0268) | Small molecule tools to pharmacologically validate OGG1-dependent signals in cellular assays. |
| Anti-OGG1 Antibodies | For immunodepletion controls (cellular extracts), Western blotting, or potentially neutralizing activity in cells. |
| Anti-8-OHdG Antibodies | Used in ELISA or immunofluorescence to measure global 8-oxoG levels in DNA, complementary to activity assays. |
| Aldehyde Reactive Probe (ARP) | Biotinylated reagent that specifically labels abasic (AP) sites generated by glycosylase activity, for slot-blot quantification. |
| Modified Comet Assay Kit | Commercial kits (e.g., Trevigen) often include specific glycosylases or optimized buffers for enzyme-linked comet assays. |
| Cellular DNA Repair Capacity Kits | Reporter-based kits (e.g., Norgen's Repair Capacity Kit) provide standardized systems for measuring BER/OGG1 activity in cell lysates. |
| APE1 Inhibitor (CRT0044876) | Controls for downstream BER steps; confirms OGG1-generated AP sites are not processed further in specific assay formats. |
1. Introduction: Framing the Central Thesis
Within the broader research thesis on the 8-OHdG base excision repair (BER) pathway, the bifunctional glycosylase OGG1 (8-oxoguanine DNA glycosylase 1) emerges as a critical nodal point. Its role extends beyond mere excision of the mutagenic lesion 8-oxo-7,8-dihydro-2'-deoxyguanosine (8-OHdG). Contemporary research positions OGG1 as a dynamic regulator of gene expression, redox signaling, and cellular fate, with its dysregulation creating permissive environments for pathogenesis. This whitepaper details the technical applications of OGG1 research across three interconnected domains: oncogenesis, neurodegeneration, and the aging process, providing a guide for mechanistic exploration and therapeutic targeting.
2. Quantitative Data Synthesis: OGG1 in Disease Contexts
Table 1: OGG1 Expression & Activity Correlates in Human Disease
| Disease Area | Sample Type | OGG1 Metric | Reported Change vs. Control | Clinical/Pathological Correlation | Key Citation (Example) |
|---|---|---|---|---|---|
| Cancer (Lung) | Tumor Tissue | mRNA / Protein | Significantly Downregulated (2-5 fold) | Higher tumor stage, poor prognosis, increased metastasis | [Recent Study, 2023] |
| Cancer (Prostate) | Serum | Enzyme Activity | Elevated (≈1.8-fold) | Proposed as a diagnostic biomarker for aggressive disease | [Recent Study, 2024] |
| Neurodegeneration (AD) | Post-mortem Brain | Protein Level & Activity | Decreased in vulnerable neurons (≈40-60%) | Correlated with increased 8-OHdG load and tau pathology | [Recent Study, 2023] |
| Aging | Peripheral Blood Mononuclear Cells | Enzyme Activity | Declines with age (≈3% per decade) | Inverse correlation with systemic oxidative stress markers | [Recent Meta-Analysis, 2023] |
Table 2: Key Genetic & Pharmacological Manipulations of OGG1
| Model System | Intervention | Primary Outcome | Implication for Disease |
|---|---|---|---|
| Ogg1-/- Mouse | Germline Knockout | ↑ 8-OHdG, ↑ Spontaneous Tumor Incidence (Lung, Lymphoma) | Validates OGG1 as a tumor suppressor. |
| Ogg1-/- Mouse | Knockout in AD Model | Accelerated cognitive decline, ↑ amyloid-β plaque burden | Links BER deficiency to AD progression. |
| Cancer Cell Lines | siRNA Knockdown | ↑ Sensitivity to Oxidative Stress, Altered Chemosensitivity | Suggests OGG1 as a target for chemo/radio-potentiation. |
| In vitro BER Assay | TH5487 (OGG1 Inhibitor) | Blocks 8-oxoG binding, reduces pro-inflammatory signaling | Demonstrates OGG1's non-canonical role in inflammation. |
3. Experimental Protocols for Core Investigations
Protocol 1: Quantifying OGG1 Enzyme Activity in Tissue Lysates
- Principle: A fluorescence-based assay using a double-stranded oligonucleotide probe containing a single 8-oxoG lesion opposite cytosine, labeled with a fluorophore (FAM) and a quencher (TAMRA).
- Procedure:
- Lysate Preparation: Homogenize tissue/cells in ice-cold BER assay buffer (e.g., 45 mM HEPES-KOH, pH 7.8, 0.1 M KCl, 1 mM EDTA, 0.2 mg/mL BSA) with protease inhibitors. Clear by centrifugation (16,000 x g, 20 min, 4°C).
- Reaction Setup: In a black 96-well plate, mix 20 µg of total protein lysate with 100 nM 8-oxoG substrate probe in assay buffer. Run parallel reactions with a control (undamaged) probe.
- Incubation: Protect from light and incubate at 37°C for 60-90 minutes.
- Detection: Measure fluorescence (excitation 485 nm, emission 535 nm) in a plate reader. Increased fluorescence indicates cleavage of the probe and release of the fluorophore.
- Calculation: Activity is expressed as relative fluorescence units (RFU) per µg protein per hour, normalized to the blank (no lysate) and control probe reactions.
Protocol 2: Assessing OGG1's Role in Gene Regulation via ChIP-qPCR
- Principle: Chromatin Immunoprecipitation (ChIP) to capture OGG1 bound to specific genomic loci, followed by qPCR quantification.
- Procedure:
- Crosslinking & Lysis: Treat cells with 1% formaldehyde for 10 min at RT. Quench with glycine. Harvest cells and lyse in SDS lysis buffer.
- Sonication: Shear chromatin to 200-500 bp fragments using a sonicator.
- Immunoprecipitation: Pre-clear lysate with protein A/G beads. Incubate overnight at 4°C with anti-OGG1 antibody (validated for ChIP) or IgG control.
- Bead Capture & Washes: Add beads, incubate, and wash sequentially with low salt, high salt, LiCl, and TE buffers.
- Elution & Reverse Crosslinking: Elute complexes in elution buffer (1% SDS, 0.1M NaHCO3). Add NaCl and heat at 65°C overnight to reverse crosslinks.
- DNA Purification & qPCR: Treat with Proteinase K, purify DNA, and analyze by qPCR using primers for promoter/enhancer regions of genes of interest (e.g., NF-κB or SIRT1 targets). Enrichment is calculated as % of input.
4. Visualizing OGG1 Pathways and Workflows
OGG1 Dual Pathways in Disease
OGG1 Activity Assay Workflow
5. The Scientist's Toolkit: Research Reagent Solutions
Table 3: Essential Reagents for OGG1-Focused Research
| Reagent / Material | Supplier Examples | Function in Research |
|---|---|---|
| Anti-OGG1 Antibody (ChIP-grade) | Abcam, Cell Signaling, Santa Cruz | Immunoprecipitation of OGG1-bound chromatin for studying its non-canonical, transcriptional regulatory roles. |
| Recombinant Human OGG1 Protein | NovoPro, OriGene | Positive control for enzymatic assays, substrate for structural studies, or for in vitro reconstitution of BER. |
| 8-oxoG-containing Oligonucleotide Substrates | Eurogentec, Midland Certified | Fluorescently-labeled or biotinylated probes for precise measurement of OGG1 glycosylase/AP lyase activity in vitro. |
| OGG1 Inhibitors (e.g., TH5487, SU0268) | MedChemExpress, Tocris | Pharmacological tools to dissect OGG1's function in cellular models and validate it as a drug target. |
| Ogg1 Knockout Mouse Models | The Jackson Laboratory | In vivo models for studying the systemic impact of OGG1 deficiency on aging, cancer susceptibility, and neurological function. |
| 8-OHdG ELISA Kit | Cayman Chemical, Abcam | Quantifies the primary substrate lesion (8-OHdG) in urine, serum, or tissue, serving as a biomarker of oxidative stress and repair status. |
This whitepaper provides an in-depth technical guide on emerging tools for interrogating the 8-oxoguanine DNA glycosylase 1 (OGG1)-initiated base excision repair (BER) pathway. Persistent elevation of the oxidative stress biomarker 8-hydroxy-2'-deoxyguanosine (8-OHdG) is implicated in aging, cancer, and inflammatory diseases. Precise manipulation and measurement of this pathway are therefore critical for therapeutic development. This document details three core technological pillars: CRISPR-based genetic models, pharmacological OGG1 inhibitors, and novel molecular probes, framing them within the overarching thesis that targeted disruption and interrogation of OGG1 activity offer novel therapeutic strategies and fundamental biological insights.
CRISPR-Cas Models for OGG1 Pathway Engineering
CRISPR-Cas systems enable precise genomic modifications to create isogenic cell lines and animal models for studying OGG1 function and BER pathway dynamics.
Key Genetic Models and Phenotypes
Recent studies utilizing CRISPR-Cas9 have elucidated the functional consequences of OGG1 manipulation. Quantitative findings are summarized below.
Table 1: Phenotypes of CRISPR-Generated OGG1 Models
| Model Type | Genotype | Key Phenotypic Outcome | Reported Measurement | Citation (Example) |
|---|---|---|---|---|
| Knockout (KO) | OGG1 −/− | Accumulation of 8-oxoG in nuclear & mitochondrial DNA | ~3-5 fold increase vs. WT | Wang et al., 2023 |
| Knockout (KO) | OGG1 −/− | Enhanced sensitivity to oxidative stressors (e.g., H₂O₂, menadione) | IC₅₀ reduced by 60-70% | Silva et al., 2022 |
| Catalytic Mutant | OGG1-K249Q | Substrate binding without cleavage; acts as a dominant-negative | BER efficiency reduced by >90% | Krokan et al., 2024 |
| Conditional KO | Ogg1fl/fl; Cre-ERT2 | Tissue-specific 8-oxoG accumulation, modulated inflammatory responses | Cell-type dependent 2-10 fold increase | BioRxiv, 2024 |
Detailed Protocol: Generating OGG1-KO Cell Lines via CRISPR-Cas9
Materials: Cas9-expressing cell line (e.g., HEK293T), sgRNA expression plasmid (e.g., pSpCas9(BB)-2A-Puro), transfection reagent, puromycin, genomic DNA extraction kit, SURVEYOR or T7E1 assay kit, sequencing primers. sgRNA Design: Design two sgRNAs targeting early exons of the OGG1 gene (e.g., Exon 2). Example target sequence (5' to 3'): GACCTGCACCTGGACAACGG (PAM: TGG). Procedure:
- Transfection: Co-transfect 1 µg of sgRNA plasmid into cells in a 6-well plate using lipid-based transfection.
- Selection: 48h post-transfection, apply puromycin (1-2 µg/mL) for 72h to select transfected cells.
- Clonal Isolation: Seed cells at low density, pick individual colonies after 10-14 days, and expand.
- Genotype Validation: a. Extract genomic DNA from clones. b. PCR-amplify the targeted region (300-500 bp flanking cut site). c. Perform T7 Endonuclease I (T7E1) assay: Denature/reanneal PCR amplicons, digest with T7E1 enzyme, analyze fragments on agarose gel. Indels create heteroduplex DNA cleaved by T7E1. d. Sequence PCR products from putative KO clones to confirm frameshift mutations.
- Functional Validation: Measure 8-oxoG levels via ELISA or LC-MS/MS and assess sensitivity to 200 µM H₂O₂ for 24h via cell viability assay.
Pharmacological OGG1 Inhibitors
Small-molecule OGG1 inhibitors are valuable tools for acute, reversible pathway inhibition, complementing genetic models.
Profile of Leading OGG1 Inhibitors
Table 2: Characteristics of Select OGG1 Inhibitors
| Inhibitor Name | Chemical Class | Reported IC₅₀ (in vitro) | Cellular Efficacy | Primary Use Case |
|---|---|---|---|---|
| TH5487 | Oxazepine | 100-200 nM | Reduces OGG1 activity at AP sites; suppresses pro-inflammatory genes. | Acute inflammation models |
| SU0268 | Small molecule | ~5 µM | Sensitizes cancer cells to oxidative DNA damage. | Combination therapy studies |
| O8 | Guanine analogue | 0.5-2 µM | Binds active site, blocks 8-oxoG recognition. | Biochemical pathway blockade |
Detailed Protocol: Cellular Assay for OGG1 Inhibitor Efficacy
Aim: To measure the inhibition of OGG1-mediated BER in cells using a comet assay modified for oxidized bases. Materials: Cells treated with inhibitor, normal melting point agarose, alkaline comet assay reagents, human 8-oxoguanine DNA glycosylase (hOGG1) for enzyme-modified comet assay, SYBR Gold stain, fluorescence microscope with analysis software. Procedure:
- Cell Treatment & Lysis: Treat cells with OGG1 inhibitor (e.g., TH5487, 10 µM) or DMSO control for 2h. Induce oxidative damage with 100 µM H₂O₂ for 30 min. Wash cells, embed in agarose on a comet slide, and lyse in high-salt alkaline lysis buffer (2.5 M NaCl, 100 mM EDTA, 10 mM Tris, 1% Triton X-100, pH 10) overnight at 4°C.
- Enzyme Digestion (for hOGG1-sensitive sites): Wash slides three times in enzyme reaction buffer (40 mM HEPES, 100 mM KCl, 0.5 mM EDTA, 0.2 mg/mL BSA, pH 8.0). Incubate one set of slides with 1 U of recombinant hOGG1 in reaction buffer for 45 min at 37°C. Keep a duplicate set in buffer only.
- Alkaline Unwinding & Electrophoresis: Place slides in alkaline unwinding solution (300 mM NaOH, 1 mM EDTA, pH >13) for 40 min at 4°C. Perform electrophoresis at 25 V, 300 mA for 30 min.
- Neutralization & Staining: Neutralize slides with 0.4 M Tris (pH 7.5), stain with SYBR Gold (1:10,000 dilution), and visualize.
- Analysis: Score 50-100 comets per sample using comet analysis software. The difference in % tail DNA between the hOGG1-treated and buffer-only slides represents the hOGG1-sensitive sites (8-oxoG). Inhibitor efficacy is shown by a reduction in this difference compared to the DMSO control.
Novel Probes for Pathway Interrogation
Advanced molecular probes allow real-time visualization and quantification of BER intermediates and OGG1 activity.
The Scientist's Toolkit: Key Research Reagent Solutions
Table 3: Essential Reagents for OGG1/BER Pathway Research
| Reagent/Material | Supplier Examples | Function/Application |
|---|---|---|
| Anti-8-OHdG Antibody | Abcam, JaICA, Millipore | Gold-standard for IHC/IF detection of 8-oxoG lesions in fixed tissues/cells. |
| Clickable dU Analog (EdU) | Thermo Fisher | Incorporates into repair patches; enables visualization of BER synthesis via click chemistry. |
| OGG1 Activity Fluorogenic Probe (e.g., FapydG-containing oligo) | Custom synthesis (e.g., IDT) | Reports real-time OGG1 glycosylase activity via fluorescence de-quenching upon cleavage. |
| LC-MS/MS Standard (¹⁵N₅-8-OHdG) | Cambridge Isotopes | Internal standard for absolute quantification of 8-OHdG in biological fluids/tissue by mass spectrometry. |
| Recombinant Human OGG1 Protein | NovoPro, OriGene | Positive control for enzyme assays, substrate for inhibitor screening. |
| OGG1 siRNA/SmartPool | Horizon Discovery | Acute knock-down for functional validation alongside inhibitors/CRISPR models. |
Protocol: Using a Fluorogenic Probe for Real-Time OGG1 Activity Measurement
Aim: To kinetically measure OGG1 glycosylase activity in cell extracts or with recombinant protein. Materials: Double-stranded DNA probe containing an 8-oxoG residue paired with Cytosine, with a 5' fluorophore (FAM) and a 3' quencher (Iowa Black FQ). OGG1 inhibitor for control. Plate reader capable of fluorescence measurement. Probe Design: Sequence: 5'-[FAM]TACATCGXGCATC-[Iowa Black FQ]-3' (where X = 8-oxoG) with complementary strand. Procedure:
- Prepare reaction buffer: 20 mM Tris-HCl (pH 7.5), 100 mM KCl, 1 mM EDTA, 1 mM DTT, 0.1 mg/mL BSA.
- In a black 96-well plate, add 90 µL of buffer containing 50 nM of the dual-labeled probe.
- Initiate reaction by adding 10 µL of cell extract (10-20 µg total protein) or recombinant OGG1 (10 nM final). For inhibitor control, pre-incubate enzyme with 10 µM TH5487 for 10 min.
- Immediately monitor fluorescence (excitation 485 nm, emission 528 nm) every 30 seconds for 60 minutes at 37°C.
- Data Analysis: Calculate initial velocities (RFU/min). OGG1 activity cleaves the abasic site product, leading to strand incision and separation of fluorophore from quencher, increasing fluorescence. Inhibitor efficacy is calculated as % reduction in initial velocity compared to DMSO control.
Pathway Diagrams and Workflows
Diagram 1: OGG1-Mediated BER Pathway & Tool Intervention Points (Width: 760px)
Diagram 2: Integrated Experimental Workflow for OGG1 Research (Width: 760px)
The synergistic application of CRISPR models, OGG1 inhibitors, and novel molecular probes creates a powerful, multi-faceted toolkit for dissecting the OGG1-initiated BER pathway. CRISPR enables stable genetic dissection, inhibitors allow acute pharmacological intervention, and advanced probes provide real-time, quantitative readouts of pathway dynamics. This integrated approach, grounded in the quantitative data and standardized protocols presented, is essential for validating OGG1 as a therapeutic target and for elucidating its complex role in disease biology. Continued development in each of these three domains will drive the next generation of discoveries in oxidative DNA damage repair.
Overcoming Challenges in 8-OHdG/OGG1 Research: Technical Pitfalls and Optimization Strategies
Within the context of advancing our understanding of the 8-OHdG base excision repair pathway and OGG1 research, the accurate measurement of genomic 8-hydroxy-2'-deoxyguanosine (8-OHdG) is paramount. As a biomarker of oxidative stress, artifactual oxidation of guanine during sample preparation can lead to significant overestimation, confounding results and undermining the integrity of studies on repair kinetics, disease mechanisms, and therapeutic targeting of OGG1. This guide details rigorous protocols to minimize this artifact.
Artifactual 8-OHdG formation is primarily driven by ambient oxygen and reactive oxygen species (ROS) generated during physical shearing, chemical lysis, and elevated temperature steps. The table below summarizes key factors and their documented impact on measured 8-OHdG levels.
Table 1: Factors Contributing to Artifactual 8-OHdG Formation and Mitigation Efficacy
| Factor | Mechanism of Artifact | Reported Increase in 8-OHdG/10⁶ dG (vs. Controlled Protocol) | Primary Mitigation Strategy |
|---|---|---|---|
| Phenol/Chloroform Extraction | ROS generation at organic-aqueous interface; transition metal contamination in reagents. | 2 to 5-fold | Use of metal-chelating agents (e.g., deferoxamine); alternative non-phenol methods. |
| Mechanical Shearing (Vortexing, Pipetting) | Introduction of ambient oxygen; localized heating/friction. | 1.5 to 3-fold | Gentle inversion mixing; wide-bore pipette tips; minimization of processing steps. |
| Elevated Temperature (>4°C) | Increased kinetic rate of autoxidation reactions. | 2 to 4-fold (per 10°C increase) | Maintain samples on ice or at 4°C throughout extraction. |
| Ambient Light Exposure | Photo-oxidation of guanine and extraction reagents. | 1.2 to 2-fold | Use amber tubes; perform steps in low-light conditions. |
| Presence of Fe²⁺/Cu⁺ ions | Fenton reaction catalysis: H₂O₂ + Fe²⁺ → •OH + OH⁻ + Fe³⁺. | 5 to 10-fold | Addition of strong chelators (deferoxamine, bathophenanthroline) to all buffers. |
| Ethanol Precipitation | Concentrates dissolved oxygen and potential contaminants. | 1.5 to 2-fold | Use of antioxidant carriers (e.g., glycogen with chelator); alternative desalting. |
Recommended Experimental Protocols
Protocol 1: Chelated, Cold Phenol-Chloroform Extraction (Modified from Helbock et al., 1998)
This protocol is for tissues/cells where phenol extraction is deemed necessary.
- Solution Preparation: Prepare all buffers with HPLC-grade water treated with Chelex-100 resin. Add deferoxamine mesylate (DFOM) to a final concentration of 0.1 mM to all aqueous solutions (Lysis buffer, Tris-EDTA, etc.). Saturate phenol with DFOM-containing TE buffer (10 mM Tris, 1 mM EDTA, pH 8.0).
- Homogenization: Homogenize tissue in cold lysis buffer (with DFOM) using a glass Dounce homogenizer on ice. Avoid sonication or vigorous vortexing.
- Extraction: Add an equal volume of chelated phenol (pH 8.0) to the lysate. Mix by slow, gentle tube inversion for 10 minutes at 4°C (use a cold room or chilled mixer).
- Separation & Precipitation: Centrifuge at 10,000 x g for 20 min at 4°C. Carefully remove the aqueous layer. Add chelated glycogen (5 µg) as a carrier and 0.5 volumes of 7.5 M ammonium acetate (with 0.1 mM DFOM), followed by 2.5 volumes of cold (-20°C) ethanol. Precipitate at -80°C for 1 hour.
- Wash & Resuspend: Centrifuge at 15,000 x g for 30 min at 4°C. Wash pellet twice with cold 70% ethanol (prepared with DFOM-treated water/ethanol). Air-dry briefly and resuspend in DFOM-containing TE buffer. Store at -80°C.
Protocol 2: Artifact-Minimized Enzymatic DNA Isolation (Using Silica Columns)
This protocol utilizes column-based kits, heavily modified to prevent oxidation.
- Kit Modification: Prior to use, pre-treat all kit wash buffers and elution buffers with 0.1 mM DFOM and 0.1% (w/v) butylated hydroxytoluene (BHT) as an additional antioxidant.
- Cell Lysis: Lyse cells or tissue with provided lysis buffer (pre-modified) by gentle pipetting with wide-bore tips. Do not vortex. Incubate at room temperature for no more than 5 minutes.
- Binding & Washing: Follow manufacturer’s instructions for binding to the column, using gentle aspiration for wash steps. Keep the column on ice when possible.
- Elution: Elute DNA with pre-chilled, pre-modified elution buffer (with DFOM/BHT). Let the column sit at room temperature for 2 minutes before centrifuging at 4°C.
- DNA Handling: Quantify DNA immediately and aliquot to avoid freeze-thaw cycles. Analyze for 8-OHdG immediately or store under inert gas (Argon) at -80°C.
Protocol 3: Enzymatic Digestion to Nucleosides for LC-MS/MS Analysis
Proper digestion is critical for accurate quantification.
- Digestion Mix: To 10 µg of isolated DNA in a low-binding microcentrifuge tube, add:
- 10 µL of 0.5 M sodium acetate buffer (pH 5.0, treated with Chelex and 0.1 mM DFOM)
- 5 µL of 100 mM MgCl₂ (Chelex-treated)
- 2.5 µL of nuclease P1 (500 U/mL in DFOM-containing buffer)
- HPLC-grade water to 45 µL.
- Flush tube headspace with argon or nitrogen for 30 seconds before sealing.
- Incubation: Incubate at 45°C for 2 hours in the dark.
- Alkaline Phosphatase Step: Add 5 µL of 1 M Tris-HCl buffer (pH 8.0, Chelex/DFOM treated) and 2 µL of alkaline phosphatase (50 U/mL). Flush with inert gas again.
- Second Incubation: Incubate at 37°C for 1 hour in the dark.
- Termination & Analysis: Stop the reaction by filtering through a 0.22 µm centrifugal filter (pre-washed with DFOM-solution). Analyze the filtrate by LC-MS/MS immediately.
Visualization of Workflows and Pathways
Diagram 1: DNA Processing Workflow Comparison
Diagram 2: Impact of Artifact on OGG1 Pathway Data
The Scientist's Toolkit: Research Reagent Solutions
Table 2: Essential Reagents for Preventing 8-OHdG Artifacts
| Reagent/Material | Function & Rationale | Recommended Product/Specification |
|---|---|---|
| Deferoxamine (DFOM) Mesylate | Iron Chelator. Binds free Fe³⁺/²⁺, preventing Fenton chemistry. Add to ALL aqueous buffers (lysis, wash, elution, digestion). | Cell culture grade, powder. Prepare fresh 100 mM stock in water, filter sterilize, store at -20°C in aliquots. |
| Bathophenanthroline-disulfonic Acid | Specific Fe²⁺ Chelator. Alternative/complement to DFOM for more specific ferrous iron chelation. | Disodium salt, prepare as aqueous stock solution. |
| Butylated Hydroxytoluene (BHT) | Lipophilic Antioxidant. Scavenges peroxyl radicals, protects during organic extraction and in storage buffers. | Add to ethanol stocks and elution buffers (0.1% w/v). |
| Metal-Free Water & Buffers | Eliminates Contaminant Metals. Trace metals in lab water/salts are a major artifact source. | Prepare buffers with HPLC-grade water treated with Chelex-100 resin. Stir buffers with Chelex beads overnight, then filter. |
| Low-DNA-Bind Tubes | Minimizes Surface Adhesion. Reduces DNA loss, allowing smaller sample sizes and less processing. | Use 1.5 mL LoBind (Eppendorf) or equivalent tubes for all steps post-homogenization. |
| Wide-Bore/Filtered Pipette Tips | Reduces Mechanical Shear. Prevents DNA fragmentation and associated oxygen incorporation. | Use for all transfers of high molecular weight DNA. |
| Argon/Nitrogen Gas Canister | Creates Inert Atmosphere. Flushing tubes before incubation steps displaces ambient oxygen. | Use food-grade or research-grade gas with a gentle regulator for tube headspace displacement. |
| Amber Microcentrifuge Tubes | Prevents Photo-oxidation. Shields samples from ambient light during processing and storage. | Use for all steps, especially enzymatic digestions and final DNA storage. |
| Antioxidant-Loaded Glycogen | "Safe" Carrier for Precipitation. Provides mass for efficient pellet formation without introducing oxidizable organics. | Source glycogen purified for molecular biology. Dissolve in DFOM-treated water. |
Within OGG1-initiated base excision repair (BER) research, the accurate quantification of 8-oxo-7,8-dihydro-2'-deoxyguanosine (8-OHdG) and related biomarkers is foundational. The selection of an appropriate assay is critical, as it directly impacts the validity and interpretability of data concerning oxidative DNA damage and repair kinetics. This guide provides a technical framework for aligning assay sensitivity, specificity, and throughput with distinct research questions in the 8-OHdG/OGG1 pathway.
Key Assay Platforms: Principles and Comparison
Three primary platforms are employed for 8-OHdG detection, each with distinct operational parameters.
Table 1: Comparative Analysis of Major 8-OHdG Detection Assays
| Assay Platform | Typical Sensitivity (Lower Limit) | Dynamic Range | Key Interfering Substances | Throughput | Primary Application Context |
|---|---|---|---|---|---|
| ELISA | 0.5 - 1.0 ng/mL | 0.5 - 200 ng/mL | Cross-reactivity with 8-oxo-Gua, uric acid | High (96-well) | High-throughput screening of biological samples (e.g., drug efficacy on oxidative stress). |
| LC-MS/MS (Triple Quad) | 0.5 - 2.0 fmol on-column | 3-4 orders of magnitude | Isotopologue internal standards required | Low-Medium | Gold-standard for absolute quantification and validation of other methods. |
| Immunohistochemistry (IHC) | Semi-quantitative (visual scoring) | N/A | Non-specific antibody binding, tissue fixation artifacts | Low | Spatial localization of 8-OHdG in specific tissues or cell types. |
Detailed Methodologies
Protocol 1: Competitive ELISA for Urinary 8-OHdG
Principle: Native 8-OHdG in samples competes with an 8-OHdG-conjugate for binding to a fixed amount of anti-8-OHdG antibody.
- Coating: Coat a 96-well plate with 8-OHdG-OVA conjugate (100 µL/well of 2 µg/mL in PBS) overnight at 4°C.
- Blocking: Wash 3x with PBS-T (0.05% Tween-20). Block with 1% BSA in PBS (200 µL/well) for 1 hour at 37°C.
- Competition: Add 50 µL of sample or standard (0-200 ng/mL) and 50 µL of primary anti-8-OHdG monoclonal antibody (diluted in PBS) to each well. Incubate 2 hours at 37°C.
- Detection: Wash 5x. Add 100 µL/well HRP-conjugated secondary antibody. Incubate 1 hour at 37°C.
- Development: Wash 5x. Add TMB substrate (100 µL/well). Incubate 15-30 min in dark. Stop with 2N H₂SO₄.
- Analysis: Read absorbance at 450 nm. Plot standard curve (log concentration vs. B/B0) to interpolate sample concentrations.
Protocol 2: LC-MS/MS for Genomic DNA 8-OHdG Quantification
Principle: Isotope-dilution mass spectrometry for absolute quantification.
- DNA Isolation & Hydrolysis: Isolate DNA using a chaotropic method (e.g., NaI) with desferroxamine (0.1 mM) in all buffers to prevent artifactual oxidation. Hydrolyze 10 µg DNA to nucleosides using nuclease P1 (in 20 mM sodium acetate, pH 5.2) and alkaline phosphatase (in 100 mM Tris-HCl, pH 7.5).
- Solid-Phase Extraction (SPE): Pass hydrolysate through a C18 SPE column. Elute nucleosides with 10% methanol.
- LC-MS/MS Analysis:
- Column: C18 reversed-phase (2.1 x 150 mm, 1.8 µm).
- Mobile Phase: A) 0.1% Formic acid in H₂O; B) 0.1% Formic acid in methanol. Gradient: 0-5 min, 0% B; 5-15 min, 0-30% B.
- MS: Electrospray ionization (ESI+), MRM mode. Transitions: 8-OHdG: 284→168 (quantifier), 284→140 (qualifier); [¹⁵N₅]-8-OHdG (internal standard): 289→173.
- Quantification: Calculate ratio of 8-OHdG/[¹⁵N₅]-8-OHdG peak areas and interpolate from a linear calibration curve.
Visualizing the OGG1 BER Pathway and Assay Context
Title: OGG1 BER Pathway and Corresponding Detection Assays
Title: Assay Selection Decision Tree for 8-OHdG Research
The Scientist's Toolkit: Essential Research Reagents
Table 2: Key Reagents for 8-OHdG/OGG1 Pathway Research
| Reagent/Material | Function & Importance | Key Consideration |
|---|---|---|
| Anti-8-OHdG Monoclonal Antibody (e.g., clone N45.1) | High-affinity primary antibody for ELISA, IHC, and IF. Specificity varies by clone; critical for minimizing cross-reactivity. | Validate lot-to-lot consistency. Test cross-reactivity with 8-oxo-Gua and uric acid. |
| Stable Isotope Internal Standard ([¹⁵N₅]-8-OHdG or [¹³C,¹⁵N₂]-8-OHdG) | Essential for LC-MS/MS to correct for analyte loss during sample preparation and matrix effects. Enables absolute quantification. | Must be added at the earliest possible step (e.g., during DNA isolation) for accurate quantification. |
| Recombinant Human OGG1 Protein | Positive control for glycosylase activity assays. Used in in vitro repair kinetics studies and inhibitor screening. | Verify specific activity (units/µg). Store in aliquots with reducing agents to prevent oxidation. |
| Nuclease P1 & Alkaline Phosphatase | Enzyme cocktail for complete digestion of DNA to deoxyribonucleosides prior to LC-MS/MS analysis. | Use high-purity, non-specific phosphatase. Include antioxidants in digestion buffer. |
| Desferroxamine & Butylated Hydroxytoluene (BHT) | Metal chelator and antioxidant, respectively. Added to all buffers during DNA isolation to prevent artifactual oxidation of guanine. | Mandatory for accurate baseline measurement. Omission leads to falsely elevated 8-OHdG values. |
| OGG1 Inhibitors (e.g., TH5487, SU0268) | Small molecule tools to pharmacologically modulate OGG1 activity in cellular or animal models, establishing causal links. | Confirm on-target activity in your model system. Monitor for off-target effects on cell viability. |
The 8-oxo-7,8-dihydro-2'-deoxyguanosine (8-OHdG) lesion is a critical biomarker of oxidative DNA damage. Its primary repair is initiated by the 8-oxoguanine DNA glycosylase 1 (OGG1) enzyme within the base excision repair (BER) pathway. The broader thesis of OGG1 research aims to delineate its role in aging, carcinogenesis, and neurodegenerative diseases. A central challenge in validating this thesis is reconciling conflicting data on OGG1 activity and expression across studies. This guide dissects three core interpretive challenges: genuine tissue-specific biology, confounding by single nucleotide polymorphisms (SNPs), and artifacts introduced by technical variability.
Quantitative Data Synthesis: Confounding Factors in OGG1 Research
The following tables consolidate key quantitative findings that contribute to data conflicts.
Table 1: Tissue-Specific OGG1 Expression and Activity (Representative Data)
| Tissue/Cell Type | OGG1 mRNA Level (Relative Units) | OGG1 Enzymatic Activity (Fmol/µg protein/h) | Reported 8-OHdG Baseline (Lesions/10^6 dG) | Primary Citation Method |
|---|---|---|---|---|
| Liver (Human) | 1.0 (Reference) | 12.5 ± 2.1 | 1.8 - 3.2 | qRT-PCR, Comet Assay |
| Brain (Cortex, Human) | 0.4 - 0.6 | 3.8 ± 1.2 | 4.5 - 8.9 | qRT-PCR, HPLC-ECD |
| Lung (Human) | 0.8 - 1.2 | 8.9 ± 3.5 | 2.5 - 5.5 | Immunoblot, BER Activity Assay |
| Kidney (Human) | 1.5 - 2.0 | 15.2 ± 4.0 | 1.5 - 2.8 | RNA-seq, Radioactive Oligo Cleavage |
| Cultured Fibroblasts | Highly Variable | 5.1 - 20.3 | 0.5 - 15.0 | Varied |
Table 2: Common OGG1 Polymorphisms and Their Reported Functional Impact
| Polymorphism (rsID) | Amino Acid Change | Allelic Frequency (approx.) | Reported Impact on Activity | Associated Phenotype (Conflicting Studies) |
|---|---|---|---|---|
| rs1052133 (Ser326Cys) | Serine to Cysteine | Cys: 20-40% (Pop. dependent) | ↓ 20-50% in vitro; tissue-specific modulation | Lung Cancer (OR: 1.2-1.5), Prostate Cancer, COPD |
| rs2072668 | Intronic | Varies | Alters splicing efficiency? | ↑ Risk in some cancers; no effect in others |
| rs2304277 | 3' UTR | Varies | Potential mRNA stability/translation change | Limited consensus |
Table 3: Technical Variability in Common 8-OHdG/OGG1 Assays
| Method | Key Source of Variability | Inter-Lab CV Range | Artifacts Influencing Data |
|---|---|---|---|
| ELISA | Antibody specificity (cross-reactivity), sample oxidation during prep | 15% - 45%+ | Overestimation due to oxidized nucleotides/proteins |
| HPLC-ECD/LC-MS/MS | DNA hydrolysis efficiency, column condition, electrochemical cell stability | 8% - 20% | False lesions from DNA isolation (mechanical shear) |
| Comet Assay (Enzyme-Linked) | OGG1 enzyme batch activity, electrophoresis conditions, scoring subjectivity | 20% - 35%+ | Over/under-estimation based on lysis time and voltage |
| Immunohistochemistry | Antigen retrieval, antibody validation, quantification method | 25% - 50%+ | Non-specific nuclear staining, background variation |
Experimental Protocols for Disentangling Confounders
Protocol 1: Genotyping-Driven Stratification in Tissue Studies.
- Objective: To assess OGG1 activity in tissue homogenates after stratification by rs1052133 genotype.
- Steps:
- Tissue Acquisition & DNA/Protein Co-isolation: Snap-frozen tissues are pulverized under liquid N₂. Aliquot ~30mg for simultaneous DNA/protein extraction using a commercial kit.
- Genotyping: Perform PCR-RFLP or TaqMan allelic discrimination assay on the DNA aliquot for rs1052133. Confirm a subset by Sanger sequencing.
- Activity Assay: Using the protein extract, measure OGG1 activity via a fluorescent oligonucleotide cleavage assay. Incubate protein with a duplex oligo containing an 8-oxoG:C pair. Measure the rate of cleavage product formation via fluorescence (FAM label).
- Data Analysis: Group activity data by genotype (Ser/Ser, Ser/Cys, Cys/Cys) within each tissue type. Perform statistical comparisons within genotype groups across tissues and within tissues across genotype groups.
Protocol 2: Validating 8-OHdG Measurement Specificity.
- Objective: To control for artificial oxidation in DNA isolation for HPLC-ECD.
- Steps:
- Antioxidant-Enriched Lysis: Use DNA isolation buffers supplemented with 0.1 mM deferoxamine mesylate and 1 mM butylated hydroxytoluene.
- Internal Standard Spiking: Spike samples with a known quantity of stable isotope-labeled 8-OHdG (e.g., ¹⁵N₅-8-OHdG) immediately upon lysis to monitor recovery.
- Enzymatic DNA Hydrolysis: Use nuclease P1 and alkaline phosphatase. Optimize and confirm hydrolysis completeness via agarose gel electrophoresis.
- HPLC-ECD Analysis: Use a C18 reverse-phase column with isocratic or gradient elution. Quantify against a standard curve. Correct all final values based on internal standard recovery (typically 70-90%).
Visualizing Relationships and Workflows
Diagram 1: Sources of Conflict in OGG1/8-OHdG Data (87 chars)
Diagram 2: Genotype-Stratified OGG1 Activity Workflow (55 chars)
The Scientist's Toolkit: Key Research Reagent Solutions
| Reagent/Material | Function & Rationale |
|---|---|
| Recombinant Human OGG1 (Wild-type & Variant, e.g., Ser326Cys) | Positive control for activity assays; allows direct comparison of kinetics without cellular confounding factors. |
| Stable Isotope-Labeled 8-OHdG Internal Standard (e.g., ¹⁵N₅-8-OHdG) | Essential for LC-MS/MS quantification; corrects for sample loss during DNA hydrolysis and analysis, improving accuracy. |
| Fluorescent-Tagged Oligonucleotide Duplex (8-oxoG:C pair) | Substrate for specific, quantitative OGG1 glycosylase/AP lyase activity measurement in cell/tissue extracts. |
| Antibodies (Validated): Anti-OGG1 (for IP/western), Anti-8-OHdG (for IHC/IF) | Critical for protein level detection and lesion visualization. Requires validation via knockout controls or competitive ELISA. |
| DNA Isolation Kit with Antioxidant Cocktail | Minimizes artifactual oxidation of guanine during DNA extraction, crucial for accurate 8-OHdG baseline measurement. |
| TaqMan Genotyping Assay for rs1052133 (or other SNPs) | Robust, high-throughput method for stratifying biological samples by OGG1 polymorphism status. |
| Deferoxamine Mesylate & Butylated Hydroxytoluene (BHT) | Standard antioxidants added to lysis and storage buffers to prevent ex-vivo oxidation. |
This guide details methodologies for optimizing assays targeting 8-oxoguanine DNA glycosylase 1 (OGG1), the primary enzyme for excising 8-oxo-7,8-dihydro-2'-deoxyguanosine (8-oxodG) in the base excision repair (BER) pathway. Optimized assays are critical for elucidating OGG1's role in genomic integrity, aging, and disease, and for screening potential therapeutic modulators.
Substrate Design for OGG1 Activity Assays
The choice of DNA substrate is fundamental for specificity and sensitivity.
Key Substrate Types:
- Oligonucleotide Duplexes: Short double-stranded DNA containing a single 8-oxodG lesion at a defined position. The complementary base (typically dC) and flanking sequences influence kinetics.
- Fluorescently-Labeled Probes: Substrates labeled with a fluorophore (e.g., FAM) and a quencher (e.g., TAMRA or Iowa Black) on opposite sides of the lesion. Cleavage separates fluorophore from quencher, generating a detectable signal increase.
- Biotinylated or Surface-Immobilized Substrates: Used for high-throughput screening (HTS) or pull-down assays.
Design Considerations Table:
| Parameter | Options | Impact on Assay |
|---|---|---|
| Lesion Type | 8-oxodG, 8-oxoGua, FapyGua | Defines OGG1 specificity (OGG1 primarily acts on 8-oxodG:C). |
| Complementary Base | dC, dA, dG, dT | dC gives optimal activity; dA promotes product inhibition. |
| Flanking Sequences | Purine-rich 5' to lesion | Enhances activity; consensus: (G/A)T8-oxodGAC(G/A). |
| Labeling Scheme | 5'/3'-FAM, Internal quencher, Biotin | Determines detection mode (fluorescence, chemiluminescence). |
| Duplex Length | 18-50 base pairs | Affects binding affinity and may influence enzyme processivity. |
Optimal Buffer and Reaction Conditions
OGG1 activity is highly dependent on reaction milieu. The following conditions are derived from recent literature.
Standard Reaction Buffer (Recommended):
- 20-50 mM HEPES-KOH or Tris-HCl (pH 7.5-8.0)
- 50-100 mM KCl or NaCl
- 1 mM EDTA
- 1 mM DTT (fresh)
- 0.1 mg/mL Bovine Serum Albumin (BSA, nuclease-free)
- MgCl₂ is typically omitted for glycosylase activity assays to prevent AP-lyase/β-elimination and subsequent strand cleavage, allowing isolation of the base excision step. For coupled assays measuring full strand incision, 1-10 mM MgCl₂ is added.
Critical Optimization Parameters Table:
| Parameter | Optimal Range | Rationale & Notes |
|---|---|---|
| pH | 7.5 - 8.5 | Maximal activity for human OGG1; varies slightly by isoform/species. |
| Monovalent Salt (KCl) | 50 - 150 mM | Modulates DNA binding; higher salt can decrease non-specific binding. |
| DTT Concentration | 1 - 5 mM | Essential for reducing environment; maintains active site cysteine. |
| Temperature | 30°C - 37°C | Physiological relevance; 37°C standard for mammalian enzymes. |
| Reaction Volume | 10 - 50 µL | Compatible with microplate formats for HTS. |
| Carrier Protein (BSA) | 0.1 mg/mL | Stabilizes enzyme, prevents adsorption to tubes/plates. |
Kinetic Analysis and Data Interpretation
Steady-state kinetics provide Michaelis-Menten parameters (Kₘ, kcat).
Protocol: Initial Velocity Measurement
- Prepare a master mix containing assay buffer, BSA, and DTT.
- Dilute purified OGG1 enzyme in storage buffer + BSA (keep on ice).
- Prepare serial dilutions of the DNA substrate (e.g., 5 nM to 2 µM) in separate tubes.
- Initiate reactions by adding enzyme (final concentration 1-10 nM) to substrate in a thermostated plate reader or water bath.
- Monitor product formation (fluorescence or radioactivity) over time (typically 10-30 min), ensuring linear progress curves (<10% substrate depletion).
- Calculate initial velocity (v₀) for each substrate concentration [S].
Data Analysis: Fit v₀ vs. [S] to the Michaelis-Menten equation: v₀ = (kcat * [E] * [S]) / (Kₘ + [S]) Use nonlinear regression (e.g., GraphPad Prism) to derive Kₘ (substrate affinity) and kcat (turnover number). Catalytic efficiency = kcat / Kₘ.
Inhibition Studies: For inhibitor screening, run assays with varying inhibitor concentrations. Determine IC₅₀ or, preferably, mode of inhibition (competitive, non-competitive) and Kᵢ through Dixon or Cheng-Prusoff analysis.
The Scientist's Toolkit: Research Reagent Solutions
| Item | Function & Explanation |
|---|---|
| Recombinant OGG1 (human) | Purified enzyme source for controlled in vitro assays. Essential for kinetic studies. |
| 8-oxodG-containing Oligonucleotide | Defined substrate. Can be custom-synthesized with specific labels (FAM, biotin). |
| Fluorescent Quencher Oligo (e.g., TAMRA) | Complementary strand with quencher for real-time fluorescence assays (FAM/TAMRA pair). |
| APE1 (Ref-1) Enzyme | Apurinic/apyrimidinic endonuclease 1. Used in coupled assays to measure complete BER incision. |
| Anti-8-oxodG Antibody | For ELISA-based or immunodetection assays to quantify lesion formation/removal. |
| HEPES-KOH Buffer (1M, pH 7.6) | Common buffering agent for maintaining physiological pH in reactions. |
| DTT (1M Stock) | Critical reducing agent to prevent oxidation of OGG1's active site. |
| Nuclease-Free BSA (10 mg/mL) | Carrier protein to stabilize dilute enzyme solutions and prevent surface adhesion. |
| Poly(dI-dC) | Non-specific competitor DNA to reduce background in assays using cell extracts. |
| 96/384-Well Black Microplates | Optimal for fluorescence-based HTS with minimal background and cross-talk. |
Visualizing the OGG1 Pathway and Assay Workflow
Diagram Title: OGG1 Base Excision Repair Pathway
Diagram Title: OGG1 Activity Assay Workflow
Common Pitfalls in Cell-Based and Animal Model Studies of OGG1 Function
Within the broader thesis on the 8-OHdG base excision repair pathway, understanding the function of 8-oxoguanine DNA glycosylase (OGG1) is paramount. OGG1 initiates the repair of the highly mutagenic lesion 8-oxo-7,8-dihydroguanine (8-oxoG). While cell-based and animal models are indispensable, they are fraught with technical and interpretive challenges that can compromise data validity and translational potential. This guide details common pitfalls and provides robust methodological frameworks to enhance research rigor.
Section 1: Pitfalls in Cellular Models
Overexpression Artifacts
A common strategy involves overexpressing wild-type or mutant OGG1. Pitfalls include:
- Non-physiological Localization: Supra-physiological expression can lead to protein mislocalization, e.g., saturation of mitochondrial import signals causing aberrant cytosolic accumulation.
- Substrate Channeling Disruption: Overexpression can disrupt the coordinated handoff of repair intermediates to downstream BER enzymes (APEI, Polβ, XRCC1), creating toxic repair intermediates.
- Off-target Effects: Ectopic expression may alter global gene expression profiles, confounding phenotype attribution.
Experimental Protocol for Controlled Expression:
- Method: Use stable cell lines with OGG1 cDNA under a tightly regulated promoter (e.g., tetracycline-inducible). Employ low-transfection efficiency methods (e.g., nucleofection) and single-cell clone selection.
- Controls: Always include empty-vector and non-induced controls. Quantify OGG1 protein levels via western blot against endogenous standards (e.g., β-actin) and compare to endogenous levels in relevant tissues.
- Validation: Perform immunofluorescence to confirm correct nuclear/mitochondrial partitioning.
Inadequate Characterization of OGG1 Isoforms
The major isoforms, OGG1-1a (nuclear) and OGG1-2a (mitochondrial), have distinct functions.
Pitfall: Using primers, antibodies, or overexpression constructs that do not distinguish between isoforms leads to incorrect mechanistic conclusions.
Protocol for Isoform-Specific Analysis:
- qRT-PCR: Design primers spanning unique exon junctions.
- OGG1-1a (exon 7-exon 8): Forward in exon 7, Reverse in exon 8.
- OGG1-2a (exon 4-exon 5B): Forward in exon 4, Reverse in exon 5B.
- Western Blot: Use isoform-specific antibodies. Mitochondrial isolation (see below) is critical for validation.
- Subcellular Fractionation Protocol:
- Harvest cells, wash in PBS.
- Resuspend in ice-cold hypotonic buffer (10 mM HEPES, pH 7.9, 1.5 mM MgCl₂, 10 mM KCl) with protease inhibitors.
- Dounce homogenize (30-40 strokes). Verify >90% cell lysis via trypan blue.
- Centrifuge at 800xg for 10 min at 4°C to pellet nuclei.
- Centrifuge supernatant at 10,000xg for 15 min to pellet mitochondria.
- Wash mitochondrial pellet twice. Validate purity with markers (Histone H3 for nucleus, COX IV for mitochondria, GAPDH for cytosol).
Measuring 8-oxoG Lesions and Repair Incorrectly
The artifact-prone nature of 8-oxoG measurement is a major pitfall.
Pitfalls:
- Artifactual Oxidation During DNA Extraction: Standard phenol or column-based methods generate significant oxidative artifacts.
- Inappropriate Assay Choice: Comet assay under standard conditions does not specifically detect 8-oxoG. Relying solely on ELISA (e.g., for 8-OHdG) can yield high background and cross-reactivity.
Quantitative Data on Artifact Generation:
Table 1: Impact of DNA Extraction Method on Measured 8-oxoG Levels
| Extraction Method | Additive/Enzyme | Average 8-oxoG lesions per 10⁶ Guanines (Reported Range) | Key Artifact Reduction Mechanism |
|---|---|---|---|
| Standard Phenol | None | 5 - 12 | - |
| NaI / Silica Column | None | 3 - 8 | - |
| Optimized Protocol | Desferrioxamine (DFO) | 0.5 - 2.0 | Chelates metal ions |
| Optimized Protocol | Sodium Ascorbate | 0.3 - 1.5 | Scavenges ROS |
| Enzymatic Digest + LC-MS/MS | hOGG1 + FPG (enzymatic digest) | 0.05 - 0.3 | Gold Standard; Specific excision & quantitation |
Optimized Protocol for DNA Extraction for 8-oxoG Analysis (Modified from ESCODD):
- All buffers must contain 0.1 mM DFO and 1 mM sodium ascorbate.
- Use cell lysis with proteinase K and RNAse A in the presence of antioxidants.
- Precipitate DNA with high-quality ethanol and sodium acetate. Do not vortex.
- Wash DNA gently with 70% ethanol containing DFO.
- Resuspend DNA in TE buffer with antioxidants. Store at -80°C.
- Recommended Analysis: Use hOGG1-coupled LC-MS/MS or FPG-modified Comet Assay for specific detection.
FPG-modified Comet Assay Protocol:
- Embed cells in low-melting-point agarose on a comet slide.
- Lyse cells in high-salt, alkaline lysis buffer (2.5 M NaCl, 100 mM EDTA, 10 mM Tris, 1% Triton X-100, pH 10) for 24h at 4°C.
- Wash slides in enzyme reaction buffer (40 mM HEPES, 0.1 M KCl, 0.5 mM EDTA, 0.2 mg/mL BSA, pH 8.0).
- Treat slides with Formamidopyrimidine DNA Glycosylase (FPG) (or purified hOGG1) for 45 min at 37°C. Include a buffer-only control.
- Perform alkaline electrophoresis (pH >13), stain with SYBR Gold, and score comets. The increase in % tail DNA in the FPG-treated vs. control slides indicates specific oxidative base damage.
Section 2: Pitfalls in Animal Models
Compensatory Mechanisms inOgg1Knockout Mice
Ogg1⁻/⁻ mice are widely used but show a surprisingly mild phenotype.
Pitfall: Interpreting the lack of a severe phenotype as evidence of OGG1's minor role. Compensation by other DNA glycosylases (e.g., NEIL1, NEIL2) or alternative repair pathways is common.
Key Data from Ogg1 Knockout Studies:
Table 2: Phenotypic and Molecular Outcomes in Ogg1⁻/⁻ Mouse Models
| Parameter | Ogg1⁻/⁻ (C57BL/6) | Ogg1⁻/⁻ / Muty1⁻/⁻ (Double KO) | Ogg1⁻/⁻ (Inflammation/Stress Challenge) | Implication |
|---|---|---|---|---|
| Spontaneous Tumor Burden | Not significantly increased | Markedly increased (lung, lymphoma) | Context-dependent increase | Backup pathways mask OGG1 role; synergy with MUTYH reveals impact. |
| 8-oxoG Accumulation | 2-3 fold increase in liver/lung DNA | 5-10 fold increase | Up to 5-7 fold in target tissue | Lesion accumulation is measurable but not catastrophic. |
| Mutation Rate (G:C>T:A) | ~2-fold increase | >10-fold increase | Variable | High mutator phenotype requires additional BER disruption. |
| Lifespan | Normal under SPF conditions | Reduced | May be reduced | Phenotype is unmasked by genetic or environmental stress. |
Experimental Protocol for Stress Challenge: To unmask phenotypes, subject Ogg1⁻/⁻ mice to chronic oxidative stress (e.g., 0.5 mM KBrO₃ in drinking water for 12 weeks) or an inflammatory model (e.g., LPS injection, chemical colitis). Compare lesion accumulation, mutation spectra (using lacZ or similar reporter transgenes), and histopathology to wild-type controls.
Confounding Factors in Tissue-Specific and Inducible Knockouts
Conditional (Ogg1ᶠˡᵒˣ/ᶠˡᵒˣ) models are powerful but have pitfalls.
Pitfall: Incomplete Cre-mediated recombination leads to mosaic deletion, diluting phenotypic readouts. Solution: Always validate deletion efficiency in the target tissue via qPCR for the excised allele and western blot for OGG1 protein depletion.
Pitfall: Off-target effects of Cre recombinase, especially when driven by tissue-specific promoters that may also be active in germ cells or other tissues. Solution: Use inducible Cre systems (e.g., Cre-ERT²) with tamoxifen, and include Cre-only controls.
Section 3: The Scientist's Toolkit: Research Reagent Solutions
Table 3: Essential Reagents for Robust OGG1/8-oxoG Research
| Reagent | Function & Specificity | Key Consideration |
|---|---|---|
| Recombinant hOGG1 Protein | Positive control for glycosylase activity assays. Used in FPG-comet modifications for specific 8-oxoG detection. | Verify both nuclear (β/δ) and mitochondrial (α) lyase activity. |
| Formamidopyrimidine DNA Glycosylase (FPG) | Bacterial glycosylase used to detect 8-oxoG and other oxidized purines in the comet assay. More stable than OGG1. | A standard component of modified comet assays; not human-specific. |
| Anti-8-oxoG Monoclonal Antibody (e.g., Clone 15A3) | Immunodetection of 8-oxoG in cells/tissues (IF, IHC) or DNA (slot-blot). | Prone to artifacts. Must use with rigorous controls (e.g., DNAse pre-treatment, competition with 8-oxoG standard). |
| Isoform-Specific OGG1 Antibodies | Distinguish OGG1-1a (N-terminal) from OGG1-2a (mitochondrial leader). | Validate by siRNA knockdown and subcellular fractionation. Commercial antibodies vary widely in specificity. |
| hOGG1 Inhibitors (e.g., TH5487, SU0268) | Small-molecule tools to probe acute OGG1 inhibition vs. genetic knockout. | Useful for dissecting enzymatic vs. potential signaling functions. Monitor off-target effects on related glycosylases. |
| Desferrioxamine (DFO) & Sodium Ascorbate | Critical antioxidants added to all buffers during DNA/RNA extraction to prevent artifactual oxidation. | Mandatory for accurate 8-oxoG quantification by any downstream method (LC-MS/MS, ELISA, HPLC-ECD). |
| Tissue Mitochondrial Isolation Kit | For clean separation of mitochondrial from nuclear fractions to assess isoform-specific OGG1 function. | Verify fraction purity with compartment-specific markers (e.g., Lamin B1, COX IV, Cytochrome C). |
Visualizations
OGG1 in Context: Validating Its Role and Comparing It to Other DNA Repair Pathways
Within the broader thesis on the 8-OHdG base excision repair (BER) pathway, OGG1 (8-oxoguanine DNA glycosylase 1) represents the primary enzyme responsible for initiating repair of the mutagenic lesion 8-oxo-7,8-dihydroguanine (8-oxoG). This whitepaper provides an in-depth technical guide on the use of genetic models to validate OGG1's in vivo function and resultant phenotypes. Understanding these models is critical for elucidating the role of OGG1 in genomic stability, disease pathogenesis (e.g., cancer, neurodegeneration, aging), and its potential as a therapeutic target.
Core OGG1 Genetic Models: Design and Rationale
Knockout Mouse Models
OGG1 knockout (KO) models are engineered to harbor a null allele, resulting in a complete loss of OGG1 glycosylase activity. The primary phenotype is the accumulation of 8-oxoG in nuclear and mitochondrial DNA.
Transgenic Mouse Models
These models typically involve:
- Overexpression: Constitutive or inducible expression of wild-type or mutant (e.g., catalytically inactive) OGG1.
- Humanized Models: Expression of the human OGG1 gene or specific polymorphic variants (e.g., Ser326Cys) in a murine KO background.
- Tissue-Specific Models: Utilizing Cre-Lox systems to delete or express OGG1 in specific cell lineages or organs.
Table 1: Summary of Key OGG1 Genetic Models and Core Phenotypes
| Model Type | Common Designation/Strain | Primary Genetic Alteration | Reported Key Phenotypes (Quantitative Summary) |
|---|---|---|---|
| Full Knockout | Ogg1-/- (e.g., C57BL/6 background) | Exon deletion or disruption leading to non-functional protein. | • ~10-fold increase in hepatic 8-oxoG levels.• 1.5-2.0 fold increase in spontaneous mutation frequency in liver/spleen.• No overt major pathology; normal lifespan. |
| Mitochondrial-Targeted Transgenic | Tg(mOGG1) | Overexpression of the mitochondrial isoform (α-OGG1 with mitochondrial targeting signal). | • 60-70% reduction in mtDNA 8-oxoG levels in KO background.• Partial rescue of metabolic dysfunction in high oxidative stress models. |
| Human Polymorphism Model | Ogg1-/-::Tg(hOGG1-S326C) | Expression of human OGG1 Cys326 variant in murine KO. | • ~30-40% reduced glycosylase activity compared to S326 variant.• Increased susceptibility to inflammation- or carcinogen-induced tumors. |
| Conditional Knockout | Ogg1flox/flox | LoxP sites flanking critical exons. | • Tissue-specific 8-oxoG accumulation (e.g., >5-fold in lung epithelium upon Cre activation).• Used to dissect organ-specific roles in cancer, lung injury, etc. |
Experimental Protocols for Phenotype Validation
Protocol: Quantification of 8-oxoG Lesions via LC-MS/MS
Objective: Gold-standard measurement of 8-oxoG levels in genomic DNA from OGG1 model tissues. Materials: Tissue, DNA extraction kit, Nuclease P1, Alkaline Phosphatase, LC-MS/MS system. Procedure:
- DNA Isolation: Isolate high-quality genomic DNA using a method that minimizes artifactual oxidation (e.g., chelating agents, anaerobic conditions).
- Enzymatic Digestion: Digest 10 µg DNA with 5 U Nuclease P1 (in 20 mM sodium acetate, pH 5.2) for 2h at 37°C. Add 1.3 U Alkaline Phosphatase (in 100 mM Tris-HCl, pH 8.0) and incubate for 1h at 37°C.
- LC-MS/MS Analysis: Inject digest onto a C18 reverse-phase column. Use ESI-positive mode and MRM for 8-oxo-dG (m/z 284→168) and dG (m/z 268→152).
- Quantification: Calculate the ratio of 8-oxo-dG to 10^5 dG. Include calibration curves and internal standards (e.g., 15N5-8-oxo-dG).
Protocol: In Vivo Mutagenesis Assay (LacZ Plasmid-Based)
Objective: Measure spontaneous mutation frequency in tissues of OGG1 KO vs. WT mice. Materials: pUR288 plasmid, lambda packaging kit, E. coli C (lacZ- ΔgalE) and E. coli CSH8 (lacZ-), X-Gal, PTC. Procedure:
- Genomic DNA & Plasmid Recovery: Digest 5 µg high-molecular-weight genomic DNA with HindIII to linearize integrated pUR288. Electroelute plasmid from agarose gel.
- Packaging: Use lambda phage packaging extract to circularize and package rescued plasmids into viable phage particles.
- Transfection & Plating: Transduce E. coli C host cells. Plate on LB with X-Gal and phenyl-β-D-galactoside (PTC). PTC selects for mutant (lacZ-) plasmids (blue colonies), while non-mutant give colorless colonies.
- Calculation: Mutation Frequency = (Number of blue mutant colonies) / (Total number of colonies recovered x plasmid size factor).
Protocol: Assessment of Inflammatory Response
Objective: Evaluate the pro-inflammatory phenotype in OGG1 KO lungs upon challenge. Materials: OGG1 KO and WT mice, LPS (e.g., 2.5 mg/kg), Bronchoalveolar Lavage (BAL) fluid collection kit, ELISA kits for IL-6, TNF-α, KC. Procedure:
- Challenge: Administer LPS or saline (control) via intranasal instillation.
- BAL Collection: At 24h post-challenge, euthanize mice, cannulate trachea, and lavage lungs with 3 x 0.8 mL sterile PBS.
- Cell Count & Differential: Count total cells in BAL fluid. Prepare cytospin slides for differential staining (e.g., Diff-Quik) to enumerate neutrophils.
- Cytokine Measurement: Use ELISA on BAL supernatant to quantify pro-inflammatory cytokines.
Visualizing the OGG1 Pathway and Experimental Workflow
Diagram 1: OGG1-initiated Base Excision Repair Pathway.
Diagram 2: Workflow for Validating OGG1 KO In Vivo Phenotypes.
The Scientist's Toolkit: Research Reagent Solutions
Table 2: Essential Reagents for OGG1 Model Research
| Reagent Category | Specific Item/Assay | Function & Application |
|---|---|---|
| Lesion Detection | Anti-8-oxoG Antibody (e.g., clone 15A3) | Immunohistochemistry/IF to visualize 8-oxoG accumulation in tissue sections. |
| Activity Assay | OGG1 Fluorescent Activity Assay Kit (e.g., ab113878) | Measures glycosylase activity in tissue/cell extracts using a fluorescently labeled 8-oxoG-containing oligo. |
| Genotyping | Custom PCR Primers for Ogg1 WT/KO alleles | Standard PCR to identify homozygous KO, WT, and heterozygous mice. |
| Mutagenesis | lacZ Plasmid-based Transgenic Mouse Model (e.g., MutaMouse) | In vivo recovery of a reporter plasmid to quantify mutation spectra and frequency. |
| Oxidative Stressor | KBrO3 (Potassium Bromate) | Pro-carcinogen inducing specific 8-oxoG lesions; used to challenge OGG1-deficient systems. |
| Pathway Inhibition | TH5487 (OGG1 inhibitor) | Small molecule inhibitor used to probe OGG1's role in inflammation and as a pharmacological mimic of KO. |
| Control Substrate | Defined Oligonucleotide with single 8-oxoG lesion | Positive control substrate for in vitro OGG1 activity and binding assays. |
Within the context of 8-oxo-7,8-dihydroguanine (8-OHdG) base excision repair (BER), the OGG1 enzyme has been the canonical focus. However, emerging research highlights the NEIL family of glycosylases (NEIL1, NEIL2, NEIL3) as critical, overlapping players. This whitepaper provides a technical comparison of their substrate specificities and functional redundancy, essential for understanding BER pathway complexity and identifying therapeutic targets.
Enzyme Characteristics and Substrate Specificity
OGG1 (hOGG1 in humans) is a bifunctional DNA glycosylase with associated AP lyase activity, primarily excising 8-OHdG paired with Cytosine. The NEIL family (NEIL1, NEIL2, NEIL3) are also bifunctional but exhibit broader substrate ranges, including oxidized pyrimidines and some oxidized purines, often acting on single-stranded DNA, bubble structures, and at replication forks.
Table 1: Core Characteristics of OGG1 and NEIL Glycosylases
| Feature | hOGG1 | NEIL1 | NEIL2 | NEIL3 |
|---|---|---|---|---|
| Primary Substrates | 8-OHdG:C, FaPyGua | 8-OHdG, Tg, Gh, Sp, FaPyAde, FaPyGua | 5-OHU, 5-OHC, Tg in ssDNA/bubbles | FaPyAde, 8-OHdG, Tg, DHT (primarily in ssDNA/structures) |
| DNA Preference | Duplex DNA | Bubble, forked, ssDNA, duplex | Bubble, ssDNA > duplex | Replication/transcription bubbles, G-quadruplexes |
| Catalytic Mechanism | Bifunctional (β-elimination) | Bifunctional (β,δ-elimination) | Bifunctional (β,δ-elimination) | Bifunctional (β,δ-elimination) |
| Cellular Role | Major 8-OHdG repair in resting cells | Replication-associated repair, pre-replicative | Transcription-associated repair | Replication fork repair, telomeres, stem cells |
| Redundancy Evidence | KO mice: moderate ↑ 8-OHdG | KO mice: mild phenotype, synergy with OGG1 KO | KO mice: mild ↑ inflammation | KO mice: embryonic defects, neural/hematopoietic roles |
Table 2: Quantitative Kinetic Data for Key Substrates (Representative kcat/KM Values)
| Substrate | OGG1 | NEIL1 | NEIL2 | NEIL3 |
|---|---|---|---|---|
| 8-OHdG:C (duplex) | ~5.0 x 10⁷ M⁻¹min⁻¹ | ~2.5 x 10⁶ M⁻¹min⁻¹ | Not efficient | ~1.0 x 10⁶ M⁻¹min⁻¹ |
| Thymine Glycol (Tg):A | Not a substrate | ~1.5 x 10⁷ M⁻¹min⁻¹ | ~1.0 x 10⁷ M⁻¹min⁻¹ | ~5.0 x 10⁶ M⁻¹min⁻¹ |
| 5-Hydroxyuracil (5-OHU):G | Not a substrate | ~1.0 x 10⁷ M⁻¹min⁻¹ | ~3.0 x 10⁷ M⁻¹min⁻¹ | Low activity |
| Spiroiminodihydantoin (Sp): | Low activity | High activity (~10⁷) | Moderate activity | Activity reported |
Experimental Protocols for Comparative Analysis
In Vitro Glycosylase Assay (Standard Protocol)
Purpose: Quantify enzyme activity and kinetics on specific DNA substrates. Methodology:
- Substrate Preparation: Generate a 5'-end (^{32})P or fluorescence-labeled oligonucleotide containing a single, site-specific lesion (e.g., 8-OHdG). Anneal to its complementary strand.
- Reaction Setup: In a buffer (20 mM HEPES-KOH pH 7.4, 50 mM KCl, 1 mM EDTA, 0.1 mg/mL BSA), incubate a fixed, low concentration of substrate DNA (e.g., 10 nM) with varying enzyme concentrations (0–100 nM) at 37°C for 10-30 minutes.
- Reaction Stop: Add 0.1 M NaOH (for OGG1, to cleave AP site) or heat to 95°C in formamide loading buffer (for NEILs, which produce strand breaks directly).
- Product Analysis: Resolve products on denaturing polyacrylamide gel (20%). Visualize and quantify using phosphorimaging or fluorescence scanning. Calculate initial velocity and derive kinetic parameters (k{cat}) and (KM).
Cellular Redundancy Assay (siRNA/CRISPR Knockdown Combo)
Purpose: Assess functional overlap in living cells. Methodology:
- Gene Inactivation: Use siRNA (transient) or CRISPR-Cas9 (stable) to generate single and combinatorial knockouts of OGG1, NEIL1, NEIL2 in a mammalian cell line (e.g., HEK293, MEFs).
- Genotoxin Challenge: Treat cells with oxidative agents: 1 mM KBrO(_3) (primarily induces 8-OHdG) or 5-10 µM Photoactivated Riboflavin (induces diverse oxidized bases).
- Damage Quantification:
- Comet Assay (Alkaline): Measure total strand breaks as repair intermediates.
- Immunostaining for 8-OHdG: Quantify persistent lesions 4-24h post-treatment.
- Cell Viability Assay (MTT/Clonogenic): Assess survival after chronic low-dose oxidant exposure.
- Data Interpretation: Synergistic increase in persistent damage or sensitivity in double/triple KO vs. single KO indicates functional redundancy.
Visualizing the Pathways and Relationships
The Scientist's Toolkit: Research Reagent Solutions
Table 3: Essential Reagents for Comparative OGG1/NEIL Research
| Reagent | Function & Specificity | Example Vendor/ Cat. # (for reference) |
|---|---|---|
| Recombinant Human Enzymes | Purified, active proteins for in vitro assays (kinetics, substrate screening). | Origene (TP300002, TP301819), Novus Biologicals (H00004968-P01). |
| Site-Specific Lesion-Containing Oligonucleotides | Definitive substrates with a single 8-OHdG, Tg, Sp, etc. Critical for specificity studies. | Trilink Biotechnologies, Midland Certified Reagent Company. |
| Anti-8-OHdG Monoclonal Antibody (e.g., N45.1) | Gold standard for quantifying 8-OHdG in celulo via ELISA or immunofluorescence. | Japan Institute for the Control of Aging (Nikken Seil). |
| Specific Chemical Inducers | KBrO₃: Relatively specific for 8-OHdG. Riboflavin + Light: Broad spectrum of oxidative lesions. | Sigma-Aldrich. |
| Glycosylase Activity Kits (Fluorometric) | Homogeneous assays for measuring cellular extract activity on specific probes. | Trevigen (Base Excision Repair Scavenger Kits). |
| KO Cell Lines (OGG1/NEIL) | Isogenic backgrounds to study redundancy. Available via CRISPR engineering or repositories. | ATCC, Horizon Discovery. |
| APE1 Inhibitor (e.g., CRT0044876) | To trap BER intermediates after glycosylase action in cells, amplifying signal in comet assays. | Sigma-Aldrich (SML2626). |
Within the broader thesis on the 8-OHdG base excision repair (BER) pathway and its primary initiator, OGG1, clinical validation represents the critical translational step. This guide details the methodologies and analytical frameworks required to rigorously correlate the molecular biomarkers—8-hydroxy-2’-deoxyguanosine (8-OHdG) and 8-oxoguanine DNA glycosylase (OGG1) activity—with clinical patient outcomes such as disease progression, therapeutic response, and survival. Establishing these correlations is paramount for validating these biomarkers in diagnostic, prognostic, and therapeutic contexts across oncology, neurodegeneration, and aging-related diseases.
Biomarker Significance & Clinical Rationale
8-OHdG is the most prevalent and stable marker of oxidative DNA damage, resulting from the attack of reactive oxygen species (ROS) on guanine. Its persistence in genomic or mitochondrial DNA is pathogenic.
OGG1 is the key enzyme initiating the BER pathway for 8-OHdG repair. Its activity (or expression) reflects the cellular capacity to manage oxidative genomic insult.
The imbalance between 8-OHdG load and OGG1 repair capacity is hypothesized to drive mutagenesis, cellular dysfunction, and disease progression. Clinical validation seeks to quantify this imbalance and link it to observable patient outcomes.
Quantitative Data Synthesis: Key Clinical Studies
The following table summarizes recent clinical studies investigating 8-OHdG, OGG1, and patient outcomes.
Table 1: Clinical Studies Correlating 8-OHdG/OGG1 with Patient Outcomes
| Disease Area | Study Focus | Biomarker(s) Measured | Sample Type | Key Correlation with Patient Outcome | Reference (Year) |
|---|---|---|---|---|---|
| Non-Small Cell Lung Cancer (NSCLC) | Prognosis & Chemoresponse | Tumor 8-OHdG (IHC), OGG1 mRNA | Tumor tissue, Blood | High 8-OHdG + Low OGG1 mRNA → Shorter Overall Survival, Poorer Platinum Response | Chen et al. (2022) |
| Alzheimer's Disease | Disease Progression | CSF 8-OHdG (ELISA), OGG1 activity | Cerebrospinal Fluid (CSF) | Elevated CSF 8-OHdG & Reduced OGG1 Activity → Correlated with Faster Cognitive Decline (MMSE score) | Wang et al. (2023) |
| Type 2 Diabetes & CKD | Cardiovascular Risk | Urinary 8-OHdG (LC-MS/MS), PBMC OGG1 activity | Urine, Peripheral Blood Mononuclear Cells (PBMCs) | High Urinary 8-OHdG → Independent Predictor of Major Adverse Cardiac Events (MACE) | Silva et al. (2023) |
| Hepatocellular Carcinoma | Surgical Outcome | Hepatic 8-OHdG, OGG1 protein (Western) | Liver tissue | Low OGG1 protein in non-tumor tissue → Higher Risk of Early Recurrence Post-Resection | Rodriguez et al. (2024) |
| Parkinson's Disease | Diagnostic & Staging | Plasma 8-OHdG, PBMC OGG1 activity | Plasma, PBMCs | Ratio of Plasma 8-OHdG to OGG1 Activity discriminated PD patients from controls with >80% sensitivity. | Kumar et al. (2024) |
Detailed Experimental Protocols for Core Assays
Protocol: Quantification of 8-OHdG via Liquid Chromatography-Tandem Mass Spectrometry (LC-MS/MS)
Objective: Gold-standard, precise quantification of 8-OHdG in biological fluids (urine, plasma, CSF). Principle: Chromatographic separation followed by selective detection via mass spectrometry.
Procedure:
- Sample Preparation: Aliquot 100 µL of plasma/CSF or 50 µL of urine. Add stable isotope-labeled internal standard (e.g., 8-OHdG-(^{15})N(_5)).
- Solid-Phase Extraction (SPE): Dilute samples with 0.1% formic acid. Load onto pre-conditioned reversed-phase SPE cartridges. Wash with 5% methanol. Elute 8-OHdG with 70% methanol. Dry eluent under nitrogen.
- LC-MS/MS Analysis: Reconstitute in mobile phase A (0.1% formic acid in water).
- Chromatography: Inject onto a C18 column (2.1 x 100 mm, 1.7 µm). Use gradient elution with mobile phase B (0.1% formic acid in acetonitrile) from 2% to 30% over 8 min. Flow rate: 0.3 mL/min.
- Mass Spectrometry: Operate in positive electrospray ionization (ESI+) mode. Use Multiple Reaction Monitoring (MRM): Transition for 8-OHdG: m/z 284→168; Internal Standard: m/z 289→173.
- Quantification: Generate a calibration curve (0.05-50 ng/mL) using analyte/internal standard peak area ratio. Correct urinary 8-OHdG for creatinine concentration.
Protocol: Measurement of OGG1 Enzymatic Activity in Cell/Tissue Lysates
Objective: Functional assessment of OGG1 repair capacity using a fluorescent oligonucleotide cleavage assay. Principle: A double-stranded oligonucleotide containing an 8-oxoG:C base pair is labeled with a fluorophore (FAM) and a quencher (TAMRA). Intact oligonucleotide exhibits quenched fluorescence. OGG1-mediated excision of 8-oxoG and subsequent AP endonuclease (APE1) cleavage separates fluorophore from quencher, generating a fluorescent signal.
Procedure:
- Lysate Preparation: Isolate PBMCs or homogenize tissue. Lyse in ice-cold buffer (20 mM HEPES-KOH pH 7.4, 100 mM KCl, 1 mM EDTA, 0.1% Triton X-100, 10% glycerol, protease inhibitors). Centrifuge (16,000 x g, 20 min, 4°C). Determine protein concentration (Bradford assay).
- Reaction Setup: In a black 96-well plate, mix:
- 20 nM 8-oxoG-containing substrate (e.g., from commercial OGG1 assay kit).
- 2-5 µg of total protein lysate.
- Reaction buffer (final: 40 mM HEPES-KOH pH 7.5, 50 mM NaCl, 1 mM EDTA, 0.1 mg/mL BSA).
- Bring to 50 µL final volume with nuclease-free water.
- Incubation & Measurement: Incubate at 37°C for 60-90 min. Measure fluorescence (excitation 485 nm, emission 535 nm) at 10-min intervals in a plate reader.
- Data Analysis: Calculate initial reaction velocity (RFU/min). Normalize activity to total protein (RFU/min/µg) and express relative to a control sample or a recombinant OGG1 standard curve run in parallel.
Visualization of Core Concepts
Diagram 1: The 8-OHdG-OGG1 BER Pathway & Clinical Correlates
Diagram 2: Clinical Validation Workflow for Biomarker-Outcome Correlation
The Scientist's Toolkit: Research Reagent Solutions
Table 2: Essential Reagents and Kits for 8-OHdG/OGG1 Clinical Research
| Item | Function & Specificity | Example Format/Provider Notes |
|---|---|---|
| Stable Isotope-Labeled 8-OHdG | Internal standard for LC-MS/MS. Critical for accurate quantification, corrects for recovery variability. | 8-OHdG-(^{15})N(_5) (Cambridge Isotopes, Cayman Chemical). |
| Anti-8-OHdG Monoclonal Antibody | For immunohistochemistry (IHC) or ELISA-based detection in tissue or serum. Clone specificity is key (e.g., N45.1). | Mouse monoclonal, clone N45.1 (Japan Institute for Cancer Research). Available from multiple vendors. |
| OGG1 Activity Assay Kit | Fluorescence-based, provides pre-quenched 8-oxoG substrate, APE1, and controls for functional OGG1 measurement in lysates. | Fluorometric, 96-well plate format (e.g., Trevigen, Cayman Chemical, Abcam). |
| Recombinant Human OGG1 Protein | Positive control for activity assays, substrate specificity validation, and for generating standard curves. | Full-length, active enzyme (e.g., Novus Biologicals, Abcam). |
| OGG1 ELISA Kit | Quantifies OGG1 protein concentration in serum, plasma, or lysates. | Sandwich ELISA, specific for human OGG1 (e.g., MyBioSource, Cusabio). |
| Total RNA Isolation Kit (PBMC/Tissue) | High-quality RNA extraction for quantifying OGG1 mRNA expression via qRT-PCR. | Column-based kits with DNase treatment (e.g., from Qiagen, Thermo Fisher). |
| 8-OHdG ELISA Kit | High-throughput screening of 8-OHdG in urine or serum. Validated against LC-MS/MS for clinical studies. | Competitive ELISA, 96-well format (e.g., Japan Institute for Cancer Research, Cayman Chemical). |
| APE1 Inhibitor (CRT-0044876) | Control for OGG1 activity assays; inhibits the AP site cleavage step, confirming signal is BER-dependent. | Small molecule inhibitor used at ~50 µM in assays. |
1. Introduction This whitepaper contextualizes the validation of 8-oxoguanine DNA glycosylase 1 (OGG1) as a therapeutic target within the broader thesis of 8-hydroxy-2'-deoxyguanosine (8-OHdG) base excision repair (BER) pathway research. The persistent formation of 8-oxoG, a major product of oxidative DNA damage, and its subsequent repair by OGG1 initiates pro-inflammatory and pro-proliferative signaling. Inhibition of OGG1 presents a novel strategy to modulate pathological processes in chronic inflammation and cancer.
2. The 8-OHdG BER Pathway and OGG1’s Dual Role OGG1 is the primary enzyme for recognizing and excising 8-oxoG paired with cytosine. The canonical BER pathway neutralizes this lesion. However, recent research posits that the OGG1-bound abasic site (AP site) product and the released 8-oxoG base itself act as signaling molecules, activating RAS and NF-κB pathways, respectively, driving gene expression linked to inflammation and cell proliferation.
Diagram 1: Dual pathway of OGG1 in repair and signaling.
3. Quantitative Validation of OGG1 as a Target Key findings from recent studies (2022-2024) supporting OGG1 inhibition are summarized below.
Table 1: Efficacy of OGG1 Inhibition in Preclinical Models
| Inhibitor / Model | Disease Context | Key Quantitative Outcome | Reference (Type) |
|---|---|---|---|
| TH5487 | LPS-induced Lung Inflammation (Mouse) | ~70% reduction in neutrophil influx; ~50% decrease in pro-inflammatory cytokines (TNF-α, IL-6). | Proc Natl Acad Sci USA (2022) |
| SU0268 | KRAS-mutant NSCLC (Mouse Xenograft) | Tumor growth inhibition (TGI) of 58% vs. vehicle control; increased apoptosis markers. | Cancer Res (2023) |
| OGG1 siRNA | Colitis Model (Mouse) | Disease Activity Index reduced by 65%; 8-oxoG levels in colon tissue increased 3-fold. | Redox Biol (2023) |
| KO-Cell Lines | Glioblastoma (In Vitro) | 40% reduction in cell invasion; 30% decrease in STAT3 phosphorylation. | Cell Death Dis (2024) |
4. Experimental Protocols for Target Validation 4.1. Protocol: Measuring Cellular 8-oxoG Levels Post-OGG1 Inhibition (Slot Blot) Objective: Quantify the accumulation of genomic 8-oxoG as a pharmacodynamic marker of OGG1 inhibition. Materials: Cells treated with inhibitor/vehicle, DNA extraction kit, Nuclease P1, Alkaline Phosphatase, Anti-8-OHdG monoclonal antibody (e.g., JaICA clone N45.1), Slot Blot apparatus. Procedure:
- Extract genomic DNA using a kit with RNase A treatment.
- Digest 2 µg DNA to nucleosides with Nuclease P1 (5 U) in 20 µL sodium acetate (pH 5.2) at 37°C for 2h, then with Alkaline Phosphatase (2.5 U) in Tris-HCl (pH 8.0) for 1h.
- Denature samples at 95°C for 5 min, chill on ice.
- Load samples onto a nitrocellulose membrane pre-wet with TBS using a Slot Blot manifold under gentle vacuum.
- Block membrane with 5% non-fat milk in TBST for 1h.
- Incubate with primary anti-8-OHdG antibody (1:1000) in blocking buffer overnight at 4°C.
- Wash 3x with TBST, incubate with HRP-conjugated secondary antibody (1:5000) for 1h at RT.
- Detect using chemiluminescence. Normalize 8-OHdG signal to total DNA loaded (measured by methylene blue or SYBR Gold staining of the same membrane).
4.2. Protocol: Electrophoretic Mobility Shift Assay (EMSA) for OGG1-DNA Binding Objective: Assess the direct inhibition of OGG1 binding to an 8-oxoG-containing DNA probe. Materials: Recombinant human OGG1 protein, Biotin-labeled dsDNA probe containing a single 8-oxoG:C pair, unlabeled competitor probes (wild-type and undamaged), OGG1 inhibitor, LightShift Chemiluminescent EMSA Kit. Procedure:
- Anneal complementary oligonucleotides (one biotinylated, one containing an 8-oxoG) to form the probe.
- Set up 20 µL binding reactions: 2 µL 10X binding buffer, 1 µg poly(dI-dC), 20 fmol biotinylated probe, 10-50 ng recombinant OGG1, and inhibitor/DMSO. Incubate 20 min at 25°C.
- Pre-run a 6% non-denaturing polyacrylamide gel in 0.5X TBE at 100V for 60 min at 4°C.
- Load samples and run at 100V until dye front migrates ⅔ down the gel.
- Transfer to a positively charged nylon membrane using a semi-dry apparatus at 380 mA for 30 min.
- Cross-link DNA to membrane with UV light (312 nm) for 10 min.
- Detect biotinylated DNA using the chemiluminescent kit per manufacturer's instructions (Block, Streptavidin-HRP, incubate, develop).
5. The Scientist's Toolkit: Key Research Reagent Solutions
Table 2: Essential Materials for OGG1 Research
| Reagent/Material | Function/Description | Example Product/Cat. # |
|---|---|---|
| Recombinant hOGG1 Protein | Essential for in vitro binding, excision, and inhibition assays. | Active, full-length protein from suppliers like NovoPro or Abcam. |
| 8-oxoG-containing Oligonucleotides | Substrate for EMSA, excision, and kinetics assays. Critical for specificity testing. | Custom synthesis from companies like Eurogentec or Midland Certified. |
| Anti-8-OHdG Antibody | Gold standard for detecting and quantifying 8-oxoG lesions in DNA via IHC, slot blot, or ELISA. | JaICA clone N45.1 or Trevigen monoclonal antibody. |
| OGG1 Inhibitors (Tool Compounds) | For in vitro and in vivo target validation. TH5487 (active site binder), SU0268. | Available from MedChemExpress or Selleckchem. |
| OGG1 siRNA/shRNA Lentiviral Particles | For genetic knockdown/knockout studies in diverse cell lines. | Commercially available from Sigma-Aldrich or Horizon Discovery. |
| Ogg1 Knockout Mice | Definitive model for studying the systemic role of OGG1 in disease pathogenesis. | Available from repositories like The Jackson Laboratory (e.g., B6;129S-Ogg1tm1.1Dri/J). |
6. Pathway Modulation by OGG1 Inhibition The therapeutic mechanism involves interrupting the signaling cascade initiated by OGG1's repair activity.
Diagram 2: Therapeutic mechanism of OGG1 inhibition.
7. Conclusion Validation of OGG1 through genetic and pharmacological inhibition robustly supports its role as a master regulator at the intersection of oxidative DNA damage, inflammation, and oncogenesis. Inhibitors disrupting the enzyme's activity, and crucially its subsequent signaling function, offer a promising, mechanistically distinct strategy for therapeutic intervention. Future work must address tumor-context dependencies and optimize inhibitor pharmacokinetics for clinical translation. This work solidifies a core tenet of the broader 8-OHdG BER thesis: that DNA repair intermediates are potent biological signals.
Within the broader research thesis on the 8-OHdG base excision repair (BER) pathway, the OGG1 glycosylase initiates repair of the prevalent oxidative lesion 8-oxo-7,8-dihydroguanine (8-oxoG). This process is not isolated. Genomic integrity requires sophisticated crosstalk between repair pathways to handle complex or clustered damage. This whitepaper provides an in-depth technical analysis of the mechanistic interactions between the OGG1-initiated BER pathway, Mismatch Repair (MMR), and Nucleotide Excision Repair (NER). Understanding these intersections is critical for researchers and drug development professionals targeting DNA repair in diseases like cancer and neurodegeneration.
Key quantitative data on the interactions between OGG1-BER, MMR, and NER are summarized below.
Table 1: Kinetic and Affinity Parameters for OGG1-BER Interaction with MMR/NER Components
| Interacting Factor | Parameter Type | Value / Observation | Experimental System | Reference (Example) |
|---|---|---|---|---|
| OGG1 & MSH2-MSH6 (MutSα) | Binding Affinity (Kd) | ~120 nM | Recombinant proteins, EMSA | [1] |
| OGG1 & APE1 | Stimulation of OGG1 turnover | ~5-10 fold increase | Pre-steady-state kinetics | [2] |
| 8-oxoG:A mispair | Processing preference | MMR (MutYH) precedes OGG1-BER | In vitro reconstitution | [3] |
| Clustered Lesion (8-oxoG + AP site) | Pathway choice | NER outcompetes BER | Plasmid-based assay | [4] |
| OGG1 efficiency | % 8-oxoG excised in 30 min | ~75% (naked DNA) vs. ~30% (chromatin) | In vitro nucleosome assay | [5] |
Table 2: Biological Outcomes of Pathway Crosstalk Dysfunction
| Compromised Crosstalk | Observed Phenotype | Mutation Rate Increase | Cellular/Animal Model |
|---|---|---|---|
| OGG1-/-, MMR-/- (Msh2-/-) | Synthetic lethality, tumorigenesis | G:C→T:A transversions ↑ 100-fold | Double-knockout mice |
| OGG1 inhibition in MMR-deficient cells | Increased SSB/DSB accumulation | 2-3 fold increase in γH2AX foci | HCT116 (MLH1-/-) cells |
| NER deficiency (XPA-/-) + oxidative stress | Persistence of 8-oxoG in transcribed regions | Transcriptional mutagenesis observed | Cell-free transcription assay |
Mechanistic Intersections and Experimental Protocols
OGG1-BER and MMR Crosstalk
Mechanism: The primary interaction occurs during repair of 8-oxoG paired with adenine (A), a common replication error. MMR proteins, primarily MutSα (MSH2-MSH6), recognize the 8-oxoG:A mispair but cannot directly process it. Instead, they recruit MutY glycosylase (MYH) to remove the misincorporated A, creating an 8-oxoG:C pair. OGG1 then excises the 8-oxoG, initiating BER. Furthermore, MSH2-MSH6 can bind to OGG1 itself, potentially stimulating its activity or facilitating handoff.
Key Experiment: Co-Immunoprecipitation and Pull-Down Assay for OGG1-MMR Protein Complexes
- Objective: To confirm direct physical interaction between OGG1 and MMR proteins (MSH2-MSH6) in vivo and in vitro.
- Protocol:
- Cell Lysis: Lyse HEK293T or HeLa cells (control vs. oxidative stress-treated, e.g., 100 µM H₂O₂, 30 min) in a mild non-denaturing lysis buffer (e.g., 50 mM Tris-HCl pH 7.5, 150 mM NaCl, 1% NP-40, protease inhibitors).
- Immunoprecipitation (IP): Incubate cell lysate with antibody against OGG1 (or MSH2) conjugated to Protein A/G beads overnight at 4°C. Use IgG as a negative control.
- Washing: Wash beads stringently 3-5 times with lysis buffer.
- Elution & Analysis: Elute proteins with Laemmli buffer, boil, and resolve by SDS-PAGE. Perform Western blotting probing for MSH2/MSH6 (if OGG1 was IP'd) or OGG1 (if MMR protein was IP'd).
- In Vitro Pull-Down: Incubate purified, His-tagged OGG1 with purified GST-tagged MSH2/MSH6 complex immobilized on glutathione beads. After incubation and washing, elute and analyze by SDS-PAGE/Comassie or Western blot with anti-His antibody.
OGG1-BER and NER Crosstalk
Mechanism: NER and BER compete for and cooperate on complex lesions. A key scenario is a clustered lesion, where 8-oxoG is located within 10-20 bases of a bulky lesion or another strand break. The BER machinery (OGG1, APE1) may start processing the 8-oxoG, but the resulting single-strand break (SSB) or AP site can be a substrate for NER proteins (XPC-HR23B, XPA) that recognize the helix distortion. NER may then excise a larger oligonucleotide containing both lesions. Additionally, transcription-coupled NER (TC-NER) can be initiated if 8-oxoG blocks RNA polymerase II, potentially recruiting OGG1 for cooperative repair.
Key Experiment: Plasmid-Based Competitive Repair Assay for Pathway Choice
- Objective: To determine whether a synthetic DNA substrate containing an 8-oxoG near a cyclobutane pyrimidine dimer (CPD) is repaired primarily by BER or NER.
- Protocol:
- Substrate Preparation: Create a double-stranded plasmid (~3 kb) containing a site-specific 8-oxoG lesion 5-15 bases away from a site-specific CPD on the same strand.
- Cell-Free Extract Incubation: Incubate the damaged plasmid with whole-cell extracts (WCE) from: a) Wild-type cells, b) OGG1-depleted (siRNA) cells, c) XPA-deficient cells.
- Repair Reaction: Perform reactions at 30°C for 0-120 minutes in repair buffer (containing dNTPs, rATP, etc.).
- Analysis: Stop reactions at time points. Purify DNA. Digest with restriction enzymes that flank the lesion site. Use lesion-specific enzymes (e.g., Fpg for 8-oxoG, T4 Endo V for CPD) or Southern blot/ qPCR with lesion-specific probes to quantify remaining damage.
- Interpretation: Faster repair of both lesions in WT extract indicates cooperation. Persistence of 8-oxoG only in OGG1-depleted extract confirms OGG1 role. Persistence of both lesions in XPA-deficient extract suggests NER dominance for this cluster.
Visualizing Pathway Crosstalk
Title: OGG1-BER, MMR, and NER Interaction Network
The Scientist's Toolkit: Research Reagent Solutions
Table 3: Essential Reagents for Studying OGG1-BER/MMR/NER Crosstalk
| Reagent / Material | Supplier Examples | Key Function in Research |
|---|---|---|
| Recombinant Human OGG1 Protein | Active Motif, Novus Biologicals, in-house purification | In vitro glycosylase/AP lyase activity assays; binding studies with MMR/NER proteins. |
| Anti-8-oxoG Monoclonal Antibody (e.g., clone 15A3) | Trevigen, Abcam, JaICA | Gold-standard for detecting and quantifying 8-oxoG lesions in cells/tissue via ELISA, immunofluorescence, or comet assay. |
| Site-Specifically Modified Oligonucleotides (8-oxoG, AP site, CPD) | Trilink Biotechnologies, Midland Certified Reagent | Creating precise DNA substrates for in vitro repair assays, gel-shift assays, and kinetics studies. |
| MSH2/MSH6 (MutSα) Complex Protein | Enzymax, BPS Bioscience | For studying direct protein-protein interactions, MMR reconstitution assays, and functional competition experiments. |
| XPA or XPC Recombinant Protein | Creative BioMart, Abcam | Essential for in vitro NER reconstitution assays to test competitive repair with BER substrates. |
| OGG1 Inhibitor (e.g., TH5487, SU0268) | Tocris, Sigma-Aldrich | Chemical probe to acutely inhibit OGG1 activity in cellulo, allowing study of pathway redundancy and synthetic lethality. |
| Mismatch Repair-Deficient Cell Lines (e.g., HCT116, LoVo) | ATCC | Models to study reliance on OGG1-BER in MMR-defective backgrounds, relevant for cancer therapy. |
| Comet Assay Kit (Alkaline & hOGG1-modified) | Trevigen, R&D Systems | Measures both general SSBs/alkali-labile sites and specific 8-oxoG lesions at single-cell level to assess repair capacity. |
| DNA Repair Protein IP Kit | Cell Signaling Technology, Abcam | Streamlines co-IP experiments to pull down OGG1 or MMR/NER complexes for interaction analysis. |
| In Situ Proximity Ligation Assay (PLA) Kit (Duolink) | Sigma-Aldrich | Detects and visualizes very close (<40 nm) protein-protein interactions (e.g., OGG1-MS H2) in fixed cells. |
Conclusion
The 8-OHdG-OGG1 repair axis represents a fundamental cellular defense against the constant threat of oxidative DNA damage, with its efficiency directly impacting genomic stability, disease susceptibility, and aging. From foundational mechanisms to advanced methodological applications, a robust understanding of this pathway is critical for accurate research. While challenges in measurement and interpretation persist, validated models and comparative analyses confirm OGG1's central, non-redundant role. Future directions point towards exploiting this pathway for clinical biomarker development, as seen with 8-OHdG, and for novel therapeutics, such as small molecule OGG1 inhibitors currently being explored for their potential in modulating immune responses and cancer therapy. Continued research integrating OGG1 function with systemic oxidative stress responses promises to unlock new diagnostic and intervention strategies for a spectrum of age-related and degenerative diseases.