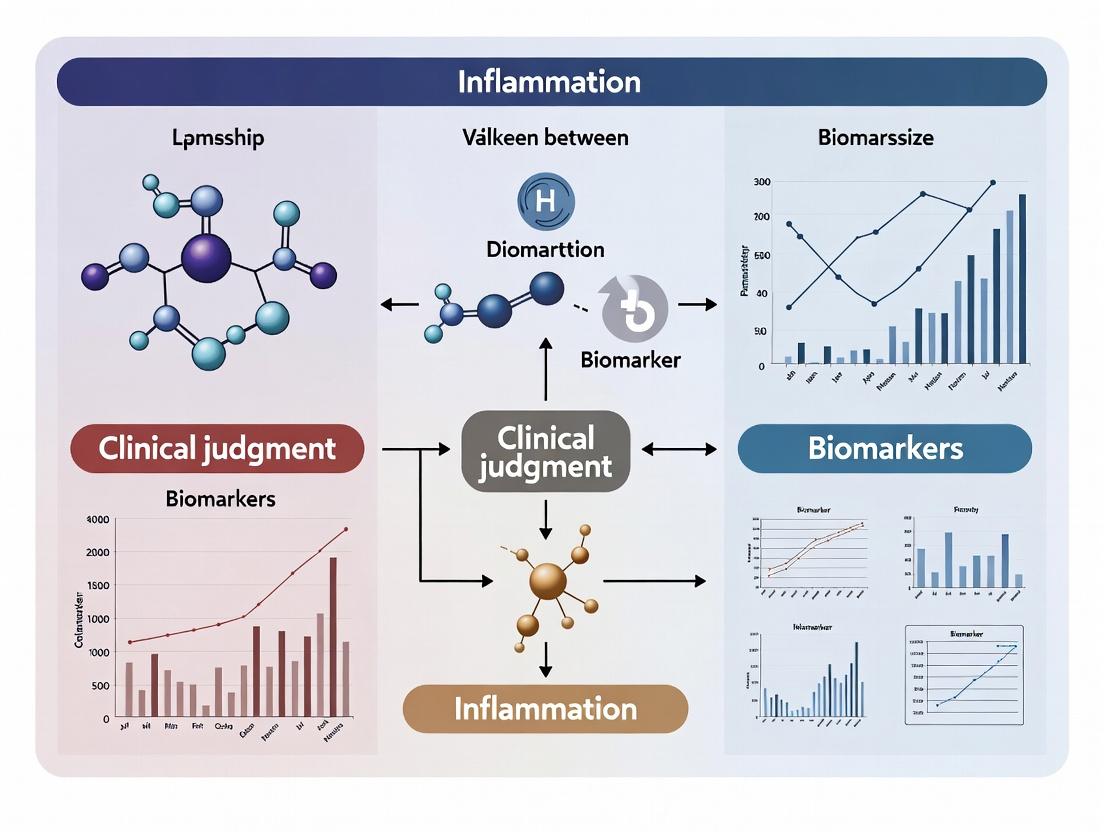
GLIM Inflammation Criterion: Clinical Judgment vs Biomarkers in Malnutrition Diagnosis | 2024 Research Insights
This article provides a comprehensive analysis for researchers and drug development professionals on the critical debate surrounding the Global Leadership Initiative on Malnutrition (GLIM) inflammation criterion.
GLIM Inflammation Criterion: Clinical Judgment vs Biomarkers in Malnutrition Diagnosis | 2024 Research Insights
Abstract
This article provides a comprehensive analysis for researchers and drug development professionals on the critical debate surrounding the Global Leadership Initiative on Malnutrition (GLIM) inflammation criterion. We explore the foundational rationale for the clinical judgment pathway, examine methodological applications and biomarker alternatives, troubleshoot common implementation challenges, and compare validation data for both approaches. The synthesis offers insights into diagnostic accuracy, therapeutic target identification, and implications for clinical trial design and precision nutrition.
The Inflammation Conundrum: Understanding the GLIM Framework and the Rationale for Clinical Judgment
Troubleshooting Guides & FAQs
Q1: During a clinical validation study of the GLIM criteria, we encounter inconsistent classification of patients when using clinical judgment for inflammation versus using CRP/IL-6 biomarkers. How do we resolve this discrepancy? A: This is a core methodological challenge. Follow this protocol:
- Pre-define Inflammation Criteria: Explicitly document the clinical signs/symptoms (e.g., fever, tachycardia, documented infection) that constitute "clinical judgment" before study initiation.
- Blinded Adjudication: Form a panel of 2-3 clinicians to independently review patient files for clinical inflammation, blinded to biomarker results and final GLIM classification.
- Tiered Analysis: Analyze your cohort in three groups: a) Concordant (both clinical and biomarker positive/negative), b) Biomarker+ only, c) Clinical judgment+ only.
- Outcome Correlation: Compare malnutrition severity (e.g., fat-free mass index), functional outcomes, and clinical recovery rates across these three groups. The criterion (or combination) that best predicts poor outcomes is more clinically relevant.
Q2: What is the optimal biomarker panel and threshold for defining inflammation in chronic diseases (e.g., CKD, COPD) for GLIM application? A: There is no universal standard, but a systematic approach is recommended.
- Primary Biomarker: High-sensitivity C-reactive protein (hs-CRP) is most accessible. A threshold of >5 mg/L is commonly used for acute/chronic inflammation, though some chronic disease studies use >3 mg/L.
- Secondary/Confirmatory Panel: Include IL-6 (more proximal in inflammation cascade) and albumin (negative acute phase reactant). Use the following protocol:
- Sample Collection: Morning fasting blood draw. Serum or plasma (EDTA) for hs-CRP/IL-6. Process within 2 hours; store at -80°C for batch analysis.
- Assay: Use validated ELISA or chemiluminescence assays. Run all samples from a single patient cohort in the same batch to minimize inter-assay variance.
- Threshold Determination: For your specific population, use percentile-based analysis (e.g., upper quartile of your cohort's values) or receiver operating characteristic (ROC) curve analysis against a clinical outcome (e.g., 6-month mortality).
Q3: In animal models for drug development, how do we model the inflammation-malnutrition axis as defined by GLIM? A: Utilize a combinatorial model protocol:
- Induce Inflammation:
- Low-grade Chronic: Use a mini-osmotic pump for continuous subcutaneous infusion of low-dose LPS (e.g., 60 µg/kg/day) for 14-28 days.
- Acute-on-Chronic: Inject turpentine (0.1mL/100g, i.m.) in a chronically inflamed or diet-restricted animal.
- Couple with Nutritional Challenge:
- Dietary Restriction: Provide 50-60% of ad libitum protein or calorie intake.
- Anorexia Assessment: Measure daily food intake. Use pair-fed controls to distinguish between inflammation-induced anorexia and direct catabolic effects.
- Endpoint Measurements: Record weight, body composition (EchoMRI), muscle function (grip strength, treadmill), and serum cytokines (TNF-α, IL-1β, IL-6).
Data Tables
Table 1: Comparison of Inflammation Assessment Methods for GLIM Criterion
| Method | Typical Biomarkers/Criteria | Proposed Threshold | Advantages | Limitations |
|---|---|---|---|---|
| Clinical Judgment | Medical diagnosis, fever, tachycardia, wounds. | Clinician assessment. | Fast, no cost, contextual. | Subjective, inter-rater variability. |
| Acute Phase Reactants | C-reactive protein (CRP) | >5 mg/L (acute/chronic) | Standardized, quantitative, low cost. | Non-specific, confounded by liver disease. |
| Albumin | <3.5 g/dL | Prognostic, readily available. | Long half-life, affected by hydration/nutrition. | |
| Cytokines | Interleukin-6 (IL-6) | >4-7 pg/mL (varies by assay) | Proximal in cascade, sensitive. | Costly, short half-life, requires rapid processing. |
Table 2: Experimental Models of Inflammation-Driven Malnutrition
| Model Type | Induction Method | Duration | Key Readouts | Best For |
|---|---|---|---|---|
| Acute Inflammation | Single LPS injection (1 mg/kg, i.p.) | 24-72 hours | Peak cytokine response, acute anorexia, proteolysis markers. | Studying acute catabolic signaling. |
| Chronic Inflammation | Continuous LPS infusion, Genetic models (e.g., IL-10 KO). | 7-28 days | Muscle mass, steady-state cytokine levels, metabolic rate. | Modeling chronic disease cachexia. |
| Disease-Specific | Collagen-Induced Arthritis (CIA), Azoxymethane/Dextran Sulfate (AOM/DSS) for cancer. | Weeks-months | Disease activity score + body composition, muscle function. | Pre-clinical drug efficacy testing. |
Experimental Protocols
Protocol 1: Validating Clinical vs. Biomarker Inflammation in a Hospitalized Cohort
- Recruitment: Consecutively screen adult patients admitted to general wards. Obtain informed consent.
- Baseline Assessment (Day 1):
- Record demographics, primary diagnosis, comorbidities.
- Perform GLIM phenotypic assessment (weight loss, low BMI, reduced muscle mass via anthropometry or BIA).
- Clinical Inflammation: Two independent clinicians assess using a standardized checklist (fever >38°C, WBC >12x10³/µL, physician diagnosis of infection/inflammatory disease).
- Biomarker Inflammation: Draw blood for hs-CRP (threshold >5 mg/L) and IL-6 (threshold >7 pg/mL).
- Follow-up (Day 7, Discharge): Assess functional status (handgrip strength), complications, and length of stay.
- Statistical Analysis: Calculate Cohen's kappa for agreement between clinical and biomarker inflammation. Use multivariate regression to determine which criterion independently predicts functional decline.
Protocol 2: Measuring Proteolysis and Signaling in a Cell-Based Model of Inflammation-Induced Muscle Atrophy
- Cell Culture: Differentiate C2C12 myoblasts into myotubes in DMEM with 10% FBS and 2% horse serum.
- Treatment: Treat mature myotubes for 24-48 hours with:
- Control media.
- Cytokine cocktail: 20 ng/mL TNF-α + 20 ng/mL IFN-γ.
- Conditioned media from LPS-activated macrophages (10% v/v).
- Analysis:
- Protein Degradation: Label proteins with [³H]-tyrosine for 48h, chase with cold tyrosine for 6h. Measure radioactivity in media (degraded) vs. cell lysate.
- Signaling Pathways: Perform Western Blot on lysates for p-STAT3 (Tyr705), p-NF-κB p65 (Ser536), and ubiquitin ligases (MuRF1, Atrogin-1).
- Morphometry: Stain myotubes with MyHC antibody and DAPI; measure myotube diameter.
Diagrams
The Scientist's Toolkit: Research Reagent Solutions
| Item | Supplier Examples | Function & Application |
|---|---|---|
| Recombinant Human/Murine Cytokines | PeproTech, R&D Systems | Induce inflammatory signaling in cell cultures (myotubes, hepatocytes) to study catabolic pathways. Key cytokines: TNF-α, IL-6, IL-1β, IFN-γ. |
| High-Sensitivity CRP (hs-CRP) ELISA Kit | R&D Systems, Abcam, Sigma-Aldrich | Quantify low levels of CRP in human/animal serum/plasma with high precision for chronic inflammation studies. |
| Multiplex Cytokine Assay Panel | Meso Scale Discovery (MSD), Bio-Rad, Luminex | Measure panels of 10-40+ cytokines/chemokines simultaneously from small sample volumes to profile inflammatory status. |
| Phospho-Specific Antibodies | Cell Signaling Technology | Detect activation of signaling pathways (e.g., p-STAT3 Tyr705, p-NF-κB p65 Ser536) via Western Blot in tissue/cell lysates. |
| MuRF1 & Atrogin-1/MAFbx Antibodies | ECM Biosciences, Abcam | Specific markers of muscle ubiquitin-proteasome system activation for immunohistochemistry or Western Blot. |
| LPS (Lipopolysaccharide) | Sigma-Aldrich (E. coli strains), InvivoGen | Gold-standard inflammagen to induce acute or chronic (via osmotic pump) inflammation in animal models. |
| Myosin Heavy Chain (MyHC) Antibody | DSHB, Abcam | Stain differentiated myotubes in vitro or muscle sections to measure diameter/area for atrophy quantification. |
| Proteasome Activity Assay Kit | Cayman Chemical, BioVision | Fluorogenic assay to measure chymotrypsin-like, trypsin-like, and caspase-like activity in tissue homogenates. |
Why Clinical Judgment? Historical and Pathophysiological Rationale in the GLIM Consensus.
Technical Support & Troubleshooting Center
This support center addresses common experimental and methodological challenges in research comparing clinical judgment of inflammation with biomarkers within the GLIM framework.
FAQs & Troubleshooting Guides
Q1: In our cohort study, clinical judgment of inflammation (e.g., infection, burden of disease) shows poor inter-rater reliability. How can we standardize this criterion? A: Implement a pre-study adjudication committee and structured case vignettes. Develop a detailed operational manual defining "clinically significant inflammation" specific to your patient population (e.g., oncologic, post-surgical). Use a Delphi process among your raters to reach consensus on ambiguous cases before the study begins. Periodically assess kappa statistics during the study and re-calibrate.
Q2: We are finding a weak correlation between pro-inflammatory cytokines (e.g., IL-6, CRP) and the clinician's "yes/no" assessment of the GLIM inflammation criterion. Is our biomarker assay faulty? A: Not necessarily. This discrepancy is a core research topic. First, troubleshoot your assay: run known controls, check sample integrity (avoid repeated freeze-thaw), and confirm assay linearity. If the assay is valid, the weak correlation may be biologically meaningful. Clinical judgment captures chronic, localized, or non-cytokine-driven (e.g., TGF-β) inflammatory states that single plasma biomarkers may miss. Consider multiplex panels or transcriptomic approaches.
Q3: What is the optimal blood sample processing protocol for measuring CRP and IL-6 in a malnutrition study? A:
- Sample Type: Serum (for CRP) or Plasma (EDTA for IL-6). Use consistent collection tubes.
- Processing: Centrifuge at 1000-2000 x g for 10 minutes at 4°C within 60 minutes of collection.
- Aliquoting: Immediately aliquot into polypropylene tubes to avoid adsorption losses.
- Storage: Store at -80°C. Avoid repeated freeze-thaw cycles (>2 cycles can degrade IL-6).
- Analysis: Use high-sensitivity (hs) CRP and IL-6 assays to detect sub-clinical inflammation.
Q4: How do we handle the patient with clear clinical signs of inflammation (e.g., pressure injury) but repeatedly normal CRP values? A: This scenario validates the need for clinical judgment. Document the clinical findings thoroughly. Expand your biomarker search beyond acute phase reactants: consider markers of macrophage activation (e.g., neopterin), tissue breakdown products, or perform imaging. This patient is a key case for your research, highlighting the potential limitation of relying solely on CRP.
Q5: What are key confounders when analyzing the relationship between inflammation criteria and mortality? A: See Table 1 for major confounders and suggested adjustments.
Table 1: Key Confounders in Inflammation-Mortality Analysis
| Confounder Category | Specific Examples | Suggested Adjustment Method |
|---|---|---|
| Demographic | Age, Sex, Ethnicity | Include as covariates in Cox regression models. |
| Disease Severity | Tumor Stage, APACHE II/SOFA Score, Comorbidity Index (CCI) | Stratify analysis or use as a covariate. |
| Other GLIM Criteria | Disease Burden, Reduced Food Intake, BMI, Muscle Mass | Analyze in multivariate model to determine independent contribution of inflammation criterion. |
| Treatment | Immunosuppressants, Chemotherapy, Nutrition Support | Document and consider as time-varying covariate or exclusion criterion. |
Experimental Protocols
Protocol 1: Validating Clinical Judgment Against a Composite Biomarker Score Objective: To quantitatively compare the GLIM clinical inflammation criterion against a panel of inflammatory biomarkers. Methods:
- Cohort: Recruit patients at risk of malnutrition (n≥200).
- Clinical Judgment: Two independent clinicians assess the GLIM inflammation criterion (infection/inflammation burden of disease) using pre-defined criteria. Discrepancies are resolved by a third expert.
- Biomarker Analysis: Draw fasting blood at time of assessment.
- Analyze hs-CRP, IL-6, TNF-α, and albumin via multiplex immunoassay or ELISA.
- Calculate a composite z-score for each patient based on log-transformed biomarker values.
- Statistical Analysis: Calculate sensitivity/specificity of clinical judgment using the composite score as a reference (e.g., top quartile of z-score). Perform Cohen's kappa for inter-rater reliability.
Protocol 2: Longitudinal Pathway Analysis of Inflammation in Cachexia Objective: To map the temporal relationship between clinical identification of inflammation, biomarker flux, and muscle mass loss. Methods:
- Design: Prospective observational study in a defined population (e.g., pancreatic cancer).
- Assessments (Monthly for 6 months):
- Clinical: GLIM criteria (including clinical judgment of inflammation), symptom diaries.
- Biomarkers: Plasma for IL-6, hs-CRP, myostatin, GDF-15.
- Body Composition: DEXA or BIA for appendicular skeletal muscle mass.
- Analysis: Use mixed-effects models to determine if the clinical identification of inflammation precedes changes in biomarkers and subsequent muscle loss. Path analysis can model these relationships.
Signaling Pathways in Inflammation-Associated Malnutrition
Title: Inflammatory Signaling in Disease-Associated Malnutrition
The Scientist's Toolkit: Research Reagent Solutions
Table 2: Essential Materials for GLIM Inflammation Research
| Item | Function & Rationale |
|---|---|
| High-Sensitivity CRP (hs-CRP) ELISA Kit | Quantifies low-grade inflammation; critical for detecting subclinical levels missed by standard assays. |
| Multiplex Cytokine Panel (e.g., IL-6, TNF-α, IL-1β) | Allows simultaneous measurement of multiple inflammatory mediators from a small sample volume, enabling composite score analysis. |
| EDTA Plasma Collection Tubes | Preserves cytokine integrity better than serum for certain analytes (e.g., IL-6). |
| Standardized Clinical Assessment Form | Ensures consistent and reproducible application of the GLIM clinical inflammation criterion across raters and sites. |
| Body Composition Analyzer (BIA/DEXA) | Objectively measures the phenotypic criterion of reduced muscle mass, the key outcome of inflammation-driven malnutrition. |
| Case Report Form (CRF) Database | Securely collects linked clinical, biomarker, and outcome data for integrated analysis. |
| Statistical Software (R, SAS, Stata) | For advanced analyses like mixed-effects modeling, survival analysis, and inter-rater reliability (kappa) calculations. |
Troubleshooting Guides & FAQs
FAQ 1: How specific must a clinical diagnosis be for GLIM’s ‘Clinical Evidence’ criterion? Answer: The clinical diagnosis must be of a condition that is known to cause inflammation. Examples include infections (e.g., pneumonia, cellulitis), autoimmune diseases (e.g., rheumatoid arthritis, Crohn's disease), and chronic conditions like chronic heart failure (NYHA Class III-IV). A vague diagnosis like "fatigue" is insufficient. The diagnosis should be clearly documented in the medical record.
FAQ 2: Can we use patient-reported symptoms alone to satisfy this criterion? Answer: No. Patient-reported symptoms (e.g., "I feel feverish") are supportive but insufficient on their own. They must be corroborated by objective clinical signs (e.g., measured fever >38.3°C, documented purulent sputum) or a definitive diagnosis from a clinician. The pathway relies on professional medical judgment.
FAQ 3: What if biomarkers (like CRP) are normal, but clinical signs are strongly suggestive? Answer: According to GLIM, the Clinical Judgment pathway is independent and can be used even if inflammatory biomarkers are not elevated. If clear, documented clinical signs and symptoms of an inflammatory condition are present, the criterion can be met. This highlights the thesis focus on clinical judgment vs. reliance solely on biomarkers.
FAQ 4: How do we handle common comorbidities like chronic kidney disease (CKD) where inflammation may be subtle? Answer: This is a common experimental challenge. For CKD, you cannot assume inflammation is present. You must document specific, active clinical evidence—such as a diagnosis of pericarditis, vasculitis, or a concurrent active infection—to meet the criterion. The underlying condition alone does not qualify.
FAQ 5: What is the most frequent error in applying this criterion in research settings? Answer: The most frequent error is equating the presence of a chronic disease with the presence of active disease-related inflammation. For example, a patient with a history of stable rheumatoid arthritis not on active therapy, and with no current joint swelling or synovitis on exam, would not qualify. You must document active inflammatory states.
Data Presentation: Key Inflammatory Conditions and Qualifying Evidence
Table 1: Qualifying vs. Non-Qualifying Clinical Evidence for GLIM Inflammation Criterion
| Condition Category | Qualifying Clinical Evidence (Examples) | Non-Qualifying Evidence |
|---|---|---|
| Infection | Physician diagnosis of pneumonia + fever >38°C; CT-confirmed abscess; Positive blood culture with clinical signs. | Positive serology without symptoms; Colonization without infection (e.g., MRSA in nares). |
| Autoimmune | Active synovitis on rheumatologist exam; Radiographic evidence of new inflammatory bowel disease lesions; Biopsy-proven vasculitis. | History of disease in remission; Positive ANA titer without organ involvement. |
| Organ Failure | NYHA Class IV heart failure with increased diuretic requirement; Acute-on-chronic liver failure with documented SIRS. | Stable chronic disease without acute decompensation. |
| Other | Major pressure injury with erythema, induration, and purulence; Post-operative state with SIRS criteria. | Routine post-operative state without signs of infection/SIRS. |
Experimental Protocols
Protocol 1: Retrospective Validation of Clinical Judgment vs. CRP in GLIM
- Cohort Selection: Identify a cohort of patients with GLIM-defined malnutrition.
- Data Extraction: Blind reviewers extract two datasets:
- Clinical Judgment Dataset: Physician notes, nursing assessments, radiology/pathology reports for signs/symptoms in Table 1.
- Biomarker Dataset: Highest CRP value within the same assessment window.
- Adjudication: An expert panel reviews the Clinical Judgment Dataset to classify patients as "Inflammation Present" or "Absent" per GLIM.
- Analysis: Calculate concordance (Cohen's kappa) between clinical adjudication and CRP-based classification (using cut-off >5 mg/L).
Protocol 2: Prospective Standardization of Clinical Signs Documentation
- Tool Development: Create a standardized checklist based on Table 1 for use at patient assessment.
- Training: Train clinical research staff on identifying and documenting specific signs (e.g., how to assess synovitis).
- Implementation: Use the checklist prospectively in a new patient cohort.
- Outcome Measurement: Measure inter-rater reliability for the "Clinical Evidence" criterion and its correlation with 6-month mortality vs. CRP correlation.
Mandatory Visualization
Title: GLIM Clinical Judgment Pathway Logic Flow
Title: Research Framework: Comparing GLIM Assessment Paths
The Scientist's Toolkit: Research Reagent Solutions
| Item | Function in GLIM Inflammation Research |
|---|---|
| High-Sensitivity CRP (hsCRP) Assay | Quantifies low levels of inflammation; used as the primary biomarker comparator against clinical judgment. |
| Electronic Health Record (EHR) Data Abstraction Tool | Standardized software (e.g., REDCap) for reliable, auditable extraction of clinical signs and diagnoses. |
| Standardized Physical Exam Protocol | A checklist to ensure consistent assessment and documentation of inflammatory signs (e.g., joint swelling, wound characteristics). |
| Inter-Rater Reliability (IRR) Kit | Training materials and statistical packages (e.g., Kappa coefficient calculation) to ensure consistency in clinical evidence adjudication among researchers. |
| Biobank Specimen Collection Kit | Allows for parallel banking of serum/plasma for future validation or discovery of novel inflammatory biomarkers. |
Troubleshooting & Technical Support Center
This support center is designed for researchers investigating the inflammatory burden within the GLIM (Global Leadership Initiative on Malnutrition) framework, specifically focusing on the integration of clinical judgment versus biomarker-based assessment.
FAQs & Troubleshooting Guides
Q1: In our cohort study, we see a discrepancy between elevated CRP (a GLIM-supported biomarker) and the absence of phenotypic criteria for malnutrition. How should we adjudicate GLIM diagnosis? A: This is a core challenge in applying the GLIM criteria. Follow this decision protocol:
- Verify Pre-Step: Confirm the patient has a positive screening result (e.g., MUST, NRS-2002).
- Re-examine Phenotypic Criteria: Rigorously re-assess for non-volitional weight loss, low BMI, or reduced muscle mass (using a validated method). Subtle losses may be missed.
- Contextualize the Inflammation:
- Use the GLIM etiology-based criterion for "inflammatory burden." Determine if the inflammation is acute (e.g., post-surgery, infection) or chronic (e.g., from CKD, cancer, rheumatoid arthritis).
- Current consensus suggests: In the presence of chronic disease-related inflammation, even without dramatic phenotypic change, the "inflammatory burden" criterion can be met to support diagnosis. Document the chronic disease source.
- Action: Classify as "Malnutrition with Inflammation" and note the discordance for your research analysis. This data point is valuable for the clinical vs. biomarker debate.
Q2: What are the best practices for standardizing muscle mass measurement in aging populations with chronic inflammation for GLIM studies? A: Variability in body composition assessment is a major source of experimental noise.
- Primary Issue: Technique inconsistency.
- Solution: Implement a strict Standard Operating Procedure (SOP):
- Preferred Method: Bioelectrical Impedance Analysis (BIA) using a phase-sensitive, multi-frequency device. Ensure consistent pre-test conditions: no exercise, empty bladder, stable hydration, measured in the morning.
- Alternative/Complement: Anthropometry (calf circumference) is highly recommended for its simplicity and strong prognostic value. Use a non-stretchable tape, measure at the widest point of the calf, with the patient seated.
- Reference Standards: Use population-specific reference standards (e.g., ESPEN cutoff values for calf circumference: <31 cm for both sexes is a strong indicator of reduced muscle mass).
- Documentation: Record the device model, software version, and measurement conditions for every subject.
Q3: We are investigating novel inflammatory biomarkers beyond CRP. Which show the most promise for quantifying the "inflammatory burden" in chronic disease-related malnutrition? A: Recent research highlights a panel approach. See the table below for quantitative comparisons.
Table 1: Promising Inflammatory Biomarkers for GLIM-Related Research
| Biomarker | Typical Baseline Range (Healthy) | Elevated Range (Inflammatory Burden) | Key Advantage for Research | Practical Limitation |
|---|---|---|---|---|
| C-Reactive Protein (CRP) | <3 mg/L | 3-10 mg/L (low-grade), >10 mg/L (high) | Widely available, GLIM-supported. | Acute phase reactant; non-specific. |
| Interleukin-6 (IL-6) | <1-5 pg/mL | >5-10 pg/mL | Proximate driver of CRP synthesis; key in inflammaging. | Requires sensitive ELISA; levels can be transient. |
| Soluble Tumor Necrosis Factor Receptors (sTNFR1/2) | Varies by assay | Elevated in chronic conditions | More stable than TNF-α; strong link to muscle wasting. | Research-use primarily; costlier. |
| Neopterin | <10 nmol/L | >10 nmol/L | Marker of cell-mediated immune activation (Th1). | Influenced by renal function. |
| GDF-15 | ~200-1200 pg/mL | >1200 pg/mL | Highly responsive to cellular stress; emerging link to anorexia. | Not routinely available; reference intervals evolving. |
Experimental Protocols
Protocol 1: Assessing the Inflammatory Burden in a Rodent Model of Cancer Cachexia Objective: To quantify the relationship between tumor-induced inflammation, metabolic dysregulation, and malnutrition phenotypes.
- Animal Model: Inject murine colon-26 adenocarcinoma cells subcutaneously into syngeneic mice. Use sham-injected controls.
- Phenotypic Tracking (Twice Weekly):
- Food Intake: Measure daily consumption per cage.
- Body Weight: Record on a precision scale.
- Body Composition: Use non-invasive quantitative magnetic resonance (EchoMRI) to measure lean and fat mass.
- Terminal Biomarker Analysis (Day 21):
- Collect blood via cardiac puncture. Serum is separated by centrifugation (3000g, 15 min, 4°C).
- Assays: Quantify murine IL-6, TNF-α, and CRP using multiplex immunoassay or ELISA kits.
- Muscle Analysis: Harvest gastrocnemius and tibialis anterior muscles. Weigh immediately. Snap-freeze in liquid N2 for later analysis of proteolytic pathways (e.g., MuRF-1/MAFbx mRNA via qPCR).
- Data Correlation: Correlate serum cytokine levels with the rate of lean mass loss and reduction in food intake.
Protocol 2: Ex Vivo Immune Cell Stimulation to Profile Inflammatory Capacity in Aged vs. Young Subjects Objective: To test the hypothesis that inflammaging contributes to malnutrition pathogenesis by creating a persistent, low-grade inflammatory milieu.
- Subject Grouping: Recruit older adults (>65y) with GLIM-defined malnutrition (with inflammation) and age-matched healthy controls. Include a young healthy cohort.
- Blood Collection: Draw venous blood into sodium heparin tubes.
- PBMC Isolation: Layer blood over Ficoll-Paque PLUS density gradient medium. Centrifuge at 400g for 30 min at room temperature (brake off). Harvest the PBMC layer, wash twice with PBS.
- Stimulation Assay:
- Plate PBMCs at 1x10^6 cells/well in RPMI-1640 + 10% FBS.
- Stimuli: Use LPS (100 ng/mL) for myeloid cell activation, or PHA (5 µg/mL) for T-cell activation. Include an unstimulated control.
- Incubate for 24h (37°C, 5% CO2).
- Analysis:
- Supernatant: Collect and analyze for IL-1β, IL-6, TNF-α, and IL-10 using a multiplex assay.
- Cells: Analyze for surface activation markers (e.g., CD86 on monocytes) via flow cytometry.
- Outcome: Compare the magnitude and cytokine profile of the immune response between groups.
The Scientist's Toolkit: Research Reagent Solutions
Table 2: Essential Reagents for Inflammatory Burden Research
| Item | Function/Application | Example Vendor/Product |
|---|---|---|
| Multiplex Cytokine Assay Kits | Simultaneous quantification of multiple inflammatory mediators (IL-6, TNF-α, IL-1β, etc.) from small sample volumes. | Bio-Plex Pro Human Cytokine Assays (Bio-Rad), V-PLEX Human Biomarker Panels (Meso Scale Discovery) |
| CRP (High-Sensitivity) ELISA Kit | Accurate quantification of low-grade CRP levels critical for assessing chronic inflammation. | Human CRP ELISA Kit (Abcam), Quantikine ELISA (R&D Systems) |
| Recombinant Inflammatory Cytokines | Used as positive controls in assays or for in vitro stimulation experiments (e.g., inducing muscle cell atrophy). | PeproTech, R&D Systems |
| LPS (Lipopolysaccharide) | Toll-like receptor 4 agonist used to stimulate a robust innate immune response in in vitro cell models. | Sigma-Aldrich (from E. coli), InvivoGen (ultra-pure) |
| Protease & Phosphatase Inhibitor Cocktails | Added to tissue homogenization buffers to preserve phosphorylation states and prevent protein degradation during analysis of signaling pathways. | Halt Protease Inhibitor Cocktail (Thermo Fisher Scientific) |
| Antibodies for Immunoblotting (p-NF-κB, p-STAT3, IkBα) | Key for analyzing activation states of inflammatory signaling pathways in tissue samples (e.g., muscle, liver). | Cell Signaling Technology |
| SYBR Green or TaqMan Master Mix | For qPCR analysis of inflammatory gene expression (e.g., Il6, Tnf, Nfkb1) and atrogenes (e.g., Fbxo32/Atrogin-1). | PowerUp SYBR Green (Thermo Fisher), TaqMan Universal PCR Master Mix |
Visualizations
Title: Inflammatory Burden Signaling Pathway to Malnutrition
Title: GLIM Diagnosis Workflow with Inflammation Criterion
Technical Support Center: Troubleshooting Guides & FAQs
FAQ 1: Discrepancy between CRP levels and clinical assessment of inflammation in GLIM-defined patients. Issue: My cohort shows a subset of patients clinically judged as having significant inflammation (e.g., due to pressure ulcers, chronic infection) but with high-sensitivity C-reactive protein (hs-CRP) levels consistently below the 5 mg/L cutoff. Which GLIM criterion should be prioritized? Answer: This is a core research gap. The current GLIM framework does not provide a hierarchy. For consistency, document both the clinical rationale (including the specific condition) and the biomarker value. In analysis, flag these cases as "clinical inflammation only" for subgroup analysis. This discrepancy is a primary target for research into novel, more sensitive biomarkers.
FAQ 2: High inter-rater variability in assigning the "clinical judgment" component of the inflammation/infection criterion. Issue: Different clinicians in our multicenter trial categorize the same patient data differently, reducing reliability. Answer: Implement a standardized adjudication protocol. See the Experimental Protocol below (Protocol A). This protocol is designed to minimize variability and generate a reproducible "clinical inflammation score" for correlation with biomarker panels.
FAQ 3: Novel biomarker (e.g., IL-6, PCT) shows promise in a pilot but fails to correlate with clinical outcomes in the validation cohort. Issue: Our targeted cytokine panel did not predict weight loss trajectory or complication rates better than hs-CRP alone. Answer: This may indicate the biomarker reflects inflammation type but not nutritional impact. Revisit your outcome measures. Consider if the biomarker is tracking a different biological pathway. Ensure pre-analytical variables (sample processing time, fasting status) were identical between pilot and validation phases. See the Research Reagent Solutions table for critical assay controls.
Experimental Protocols
Protocol A: Adjudicated Clinical Inflammation Assessment for GLIM Criterion Objective: To standardize the assignment of the GLIM clinical inflammation/infection criterion.
- Independent Chart Review: Two blinded clinicians separately review the patient's medical record for a defined period (e.g., 7 days pre-assessment).
- Structured Data Extraction: Reviewers complete a form documenting: a) Active infections (type, site, severity), b) Non-infectious inflammatory conditions (e.g., active rheumatoid arthritis, pressure ulcers ≥ Stage 2), c) Anti-inflammatory medication use.
- Adjudication Meeting: Reviewers meet. Cases with concordance are classified. Discordant cases are reviewed with a third senior clinician. A final consensus classification (Yes/No for "significant inflammation") is reached.
- Score Generation: Assign a simple score (0=No, 1=Yes) or a graded scale (e.g., 0=none, 1=moderate, 2=severe) based on pre-defined criteria for the consensus outcome.
Protocol B: Multiplex Biomarker Validation vs. Clinical Judgment Objective: To validate a panel of candidate biomarkers against adjudicated clinical inflammation status.
- Sample Collection: Draw fasting blood serum/plasma at time of GLIM assessment. Process within 2 hours; aliquot and store at -80°C.
- Batch Analysis: Analyze samples in a single batch to reduce inter-assay variance. Measure: hs-CRP, IL-6, TNF-α, Serum Amyloid A (SAA), and Albumin.
- Data Normalization: Log-transform skewed biomarker data (e.g., CRP, IL-6).
- Statistical Modeling: Use logistic regression with adjudicated clinical inflammation (from Protocol A) as the dependent variable and the biomarker panel as independent variables. Calculate AUC for the panel vs. individual markers.
Data Presentation
Table 1: Comparison of Inflammatory Assessment Methods in Recent GLIM Studies
| Study (Year) | Population | Clinical Judgment Rate | CRP (>5 mg/L) Rate | Concordance Rate (Kappa) | Key Discrepancy Note |
|---|---|---|---|---|---|
| Xu et al. (2023) | GI Cancer | 42% | 31% | 0.65 (Moderate) | Post-op patients with wounds showed high clinical/low CRP. |
| Silva et al. (2024) | Elderly ICU | 78% | 85% | 0.82 (High) | Sepsis drove high concordance; non-infectious inflammation was discordant. |
| Park et al. (2023) | COPD | 28% | 22% | 0.48 (Fair) | Chronic lung inflammation was frequently clinically judged without elevated CRP. |
Table 2: Diagnostic Performance of Biomarkers vs. Adjudicated Clinical Inflammation (Hypothetical Data)
| Biomarker | AUC | Optimal Cut-off | Sensitivity | Specificity | P-Value vs. CRP Alone |
|---|---|---|---|---|---|
| hs-CRP | 0.76 | 4.1 mg/L | 0.70 | 0.79 | (Reference) |
| IL-6 | 0.71 | 4.8 pg/mL | 0.65 | 0.82 | 0.12 |
| Clinical Score (Protocol A) | 0.85 | Score ≥2 | 0.81 | 0.88 | 0.03 |
| Combined Panel (CRP+IL-6+Clinical Score) | 0.92 | -- | 0.89 | 0.91 | <0.01 |
Mandatory Visualizations
Diagram Title: GLIM Inflammation Assessment Research Workflow
Diagram Title: Inflammation to Biomarker & Clinical Phenotype Pathway
The Scientist's Toolkit: Research Reagent Solutions
| Item / Reagent | Function & Rationale |
|---|---|
| High-Sensitivity CRP (hs-CRP) Assay | Quantifies CRP at low levels (<5 mg/L) essential for detecting subclinical inflammation. |
| Multiplex Cytokine Panel (IL-6, TNF-α, IL-1β) | Measures multiple inflammatory mediators from a single sample to profile inflammation type and intensity. |
| Procalcitonin (PCT) ELISA | Helps distinguish bacterial infection from other inflammatory states, refining the "infection" component of GLIM. |
| Standardized Biobank Tubes (e.g., EDTA, Serum Separator) | Ensures pre-analytical consistency for biomarker stability across multicenter studies. |
| Clinical Adjudication Case Report Form (CRF) | Standardized document (from Protocol A) to capture clinical judgment data objectively and reproducibly. |
Algorithm Validation Software (R/Python with pROC, caret) |
For robust statistical comparison of biomarker panels vs. clinical judgment using AUC and machine learning models. |
From Theory to Practice: Implementing GLIM Inflammation Assessment in Research & Clinical Trials
Technical Support Center: Troubleshooting Guides & FAQs
FAQs on GLIM Inflammation Criterion Application
Q1: What are the most common inconsistencies in applying the GLIM clinical judgment criterion for inflammation across study sites? A: Inconsistencies most frequently arise in:
- Interpreting non-specific symptoms (e.g., fatigue, anorexia) in the context of comorbidities.
- Grading the severity of inflammation (mild vs. moderate vs. severe).
- Documenting the rationale for concluding inflammation is present or absent.
- Handling cases where clinical judgment and biomarker data (e.g., CRP, albumin) appear discordant.
Q2: Our site’s clinical judgment assessments show poor agreement with biomarker data (CRP). How should we troubleshoot this? A: Follow this systematic troubleshooting guide:
- Review Protocol Training: Ensure all assessors have completed centralized training on the operational definitions of "clinical signs of inflammation" as per your study’s SOP.
- Audit Documentation: Review case report forms for completeness and clarity of the narrative justifying the clinical judgment.
- Reconcile with Comorbidities: Create a table to cross-reference clinical judgment calls with active comorbid conditions (e.g., infection, rheumatoid arthritis) to identify confounding factors.
- Implement a Blinded Review: Have a central adjudication committee review a subset of discordant cases blinded to biomarker results.
Q3: What is the recommended experimental protocol to validate the consistency of clinical judgment application in a multi-site study? A: Implement a Clinical Judgment Validation and Calibration Protocol.
Title: Protocol for Inter-Rater Reliability (IRR) Assessment of GLIM Clinical Judgment Criterion Objective: To quantify and improve consistency in the application of the GLIM clinical judgment criterion across raters and sites. Methodology:
- Case Development: A central committee develops a set of 20-30 detailed patient vignettes, covering a spectrum from clear inflammation to clear non-inflammation, with intentional edge cases.
- Blinded Rating: All clinical assessors from participating sites independently review each vignette and answer: "Are clinical signs of inflammation present? (Yes/No)" and "What is the primary clinical rationale?"
- Data Analysis: Calculate Fleiss' Kappa (κ) statistic for multi-rater agreement on the binary outcome.
- Calibration Workshop: Host a virtual workshop reviewing vignettes with low agreement. Discuss rationale and align on application of the criterion.
- Re-assessment: Re-run the IRR assessment with new vignettes post-workshop to measure improvement.
Table 1: Example Inter-Rater Reliability (IRR) Results Before and After Calibration
| Site / Rater Cohort | Number of Raters | Fleiss' Kappa (Initial) | Fleiss' Kappa (Post-Calibration) | Agreement Interpretation |
|---|---|---|---|---|
| All Sites (Pooled) | 45 | 0.45 | 0.72 | Moderate → Substantial |
| Site A | 8 | 0.60 | 0.78 | Moderate → Substantial |
| Site B | 10 | 0.35 | 0.65 | Fair → Substantial |
| Site C | 9 | 0.50 | 0.75 | Moderate → Substantial |
Q4: How should we design an experiment to directly compare the prognostic value of clinical judgment vs. biomarkers? A: Prospective Cohort Study Protocol for Head-to-Head Comparison.
Title: Protocol for Comparing Clinical Judgment vs. Biomarkers in GLIM Study Design: Prospective, observational cohort in patients at risk for malnutrition (e.g., oncology, gastroenterology). Primary Endpoint: 6-month all-cause mortality or major morbidity (e.g., unplanned hospitalization). Key Assessments at Baseline:
- GLIM Clinical Judgment: Performed independently by two trained clinicians blinded to biomarker results. Resolution by third adjudicator if discordant.
- Biomarker Panel: Venous blood draw for CRP, albumin, prealbumin (transthyretin).
- Phenotypic Criteria: Weight loss, BMI, muscle mass (via BIA or DXA). Analysis: Calculate and compare the Hazard Ratios (HR), sensitivity, specificity, and area under the curve (AUC) of Cox regression models using: a) clinical judgment alone, b) biomarker criteria alone (e.g., CRP >5 mg/L), c) a combined model.
Table 2: Example Prognostic Performance Comparison (Hypothetical Data)
| Diagnostic Criterion for Inflammation | Sensitivity (%) | Specificity (%) | AUC for Predicting 6-Mo. Mortality | Hazard Ratio (HR) [95% CI] |
|---|---|---|---|---|
| Clinical Judgment (Standardized) | 78 | 82 | 0.80 | 3.2 [2.1-4.9] |
| CRP > 5 mg/L | 85 | 75 | 0.77 | 2.8 [1.9-4.2] |
| Albumin < 3.5 g/dL | 65 | 88 | 0.76 | 2.5 [1.7-3.8] |
| Clinical Judgment OR CRP >5 | 92 | 70 | 0.81 | 3.5 [2.3-5.3] |
Signaling Pathways & Workflows
Title: Decision Workflow for GLIM Inflammation Criterion
Title: Inflammation Biology & GLIM Assessment Paths
The Scientist's Toolkit: Research Reagent Solutions
| Item / Reagent | Primary Function in GLIM Research |
|---|---|
| High-Sensitivity CRP (hs-CRP) Immunoassay Kit | Quantifies low levels of C-reactive protein with high precision, essential for capturing subclinical inflammation. |
| Albumin & Prealbumin Assay Kits | Measures visceral protein pools. Prealbumin (transthyretin) has a shorter half-life and may reflect rapid nutritional changes. |
| Multiplex Cytokine Panel (IL-6, TNF-α, IL-1β) | Profiles upstream inflammatory mediators to understand drivers of the acute phase response and correlate with clinical signs. |
| Bioelectrical Impedance Analysis (BIA) Device | Provides a portable, low-cost estimate of fat-free muscle mass for assessing the GLIM phenotypic criterion of reduced muscle mass. |
| Standardized Patient Vignette Repository | A curated set of detailed clinical cases used for training and testing inter-rater reliability of clinical judgment. |
| Electronic Case Report Form (eCRF) with Logic | Ensures systematic, auditable data capture for clinical judgment, forcing structured rationale entry before proceeding. |
| Central Adjudication Committee Charter | Defines the protocol for resolving discordant assessments between local clinical judgment and biomarker data. |
Technical Support Center: Troubleshooting & FAQs for Inflammatory Biomarker Assays in GLIM Research
Q1: Our CRP ELISA results are consistently higher than expected in our GLIM-defined patient cohort. What could be causing this interference? A: Common issues include:
- Sample Hemolysis: Red blood cells contain CRP. Use gentle collection and processing. Centrifuge samples at 2000-3000 x g for 10 mins promptly after clotting.
- Lipemic/Rheumatoid Factor Interference: Check kit specifications for interference claims. Use a kit with an RF-blocking agent or perform a serial dilution to check for linearity. If recovery is poor, consider ultracentrifugation to remove lipids.
- Matrix Effects: Ensure the calibrator matrix matches your sample type (e.g., serum vs. plasma). Re-calibrate with an alternate lot of standards.
- Protocol Adherence: Strictly follow incubation times and temperatures. Automate washing steps to minimize variability.
Q2: When measuring IL-6, our data shows high variability between duplicate wells, especially in samples from patients with severe inflammation. How can we improve precision? A: High cytokine levels can be at the assay's upper limit. Troubleshoot as follows:
- Repeat with Dilution: Dilute samples 1:10 or 1:100 in the assay's recommended diluent (often zero standard) and re-run. Calculate back using the dilution factor.
- Vortex and Centrifuge: Before aliquoting for the assay, vortex the thawed sample thoroughly, then briefly centrifuge to collect liquid at the tube bottom.
- Check Pipette Calibration: Low-volume pipetting for high-plex panels is critical. Re-calibrate pipettes, especially those used for standards and samples.
- Homogeneous Reagent Warming: Ensure all reagents (except standards) are at room temperature for 30 minutes before use to prevent condensation and ensure uniform viscosity.
Q3: We are validating a novel 10-plex inflammatory panel against individual ELISAs for CRP, IL-6, and TNF-α. What is the accepted correlation coefficient (R²) for clinical research validation? A: For biomarker discovery and clinical research validation, an R² ≥ 0.85 is generally considered acceptable for agreement between methods. However, also assess the slope and intercept of the Deming or Passing-Bablok regression.
Table 1: Expected Performance Metrics for Method Correlation Studies
| Metric | Target for Acceptance | Investigation Required If |
|---|---|---|
| Correlation (R²) | ≥ 0.85 | R² < 0.80 |
| Slope (Linear Regression) | 0.90 - 1.10 | Slope < 0.85 or > 1.15 |
| Percent Recovery | 85% - 115% | Consistently outside 80-120% |
| Coefficient of Variation (CV) | < 15% (Inter-assay) | CV > 20% |
Q4: What is the optimal sample collection and processing protocol for TNF-α measurement to ensure stability? A: TNF-α is labile. Follow this protocol:
- Collection: Draw blood into serum separator tubes or EDTA/K2-EDTA plasma tubes.
- Processing: Centrifuge at 4°C at 1000-2000 x g for 15 minutes within 30 minutes of collection.
- Aliquoting: Immediately aliquot supernatant into pre-chiced polypropylene tubes.
- Storage: Flash-freeze aliquots in liquid nitrogen or dry ice and store at -80°C. Avoid freeze-thaw cycles (>2 cycles significantly degrade analyte).
Q5: How do we interpret discordant results where a patient meets the GLIM phenotypic criterion (e.g., weight loss) but our chosen inflammatory panel (CRP, IL-6) shows values within the "normal" reference range? A: This directly speaks to the thesis context of clinical judgment vs. biomarkers.
- Review Panel Sensitivity: "Normal" ranges are population-derived. For inflammation-driven malnutrition, a higher, pathology-specific cut-off may be needed (e.g., CRP > 5 mg/L vs. lab's normal < 3 mg/L).
- Consider Biomarker Timing: The phenotypic criterion may reflect chronic inflammation, while CRP/IL-6 indicate acute phase. Consider adding a biomarker of chronic immune activation (e.g., soluble cytokine receptors like sTNF-R, neopterin).
- Clinical Integration: Per GLIM, the inflammation criterion can be fulfilled by either biomarker or clinical diagnosis. Discordance reinforces the need for clinician's judgment (e.g., diagnosis of infection, disease burden) as a valid criterion alongside lab data.
Experimental Protocol: Validating a Novel Panel Against Gold-Standard Assays
Title: Protocol for Correlation of Multiplex Panel with ELISA for GLIM Biomarkers.
Objective: To determine the correlation and agreement between a novel multiplex immunoassay panel and established single-analyte ELISAs for CRP, IL-6, and TNF-α in human serum/plasma.
Materials: See "The Scientist's Toolkit" below. Methods:
- Sample Cohort: N=40-50 samples from a biobank covering a wide concentration range (low, medium, high) for each analyte, as determined by prior ELISA.
- Assay Execution:
- Run all samples in duplicate on the novel multiplex panel according to the manufacturer's protocol.
- Run the same samples in duplicate on the validated, gold-standard ELISA for each individual analyte (CRP, IL-6, TNF-α).
- Perform both assays within the same week to minimize sample degradation.
- Data Analysis:
- Calculate mean concentration for each duplicate.
- Perform linear regression and Deming regression analysis for each analyte (Multiplex result vs. ELISA result).
- Calculate Pearson's correlation coefficient (R) and R².
- Assess bias using Bland-Altman plots.
Visualizations
Diagram 1: Inflammatory Signaling Pathways in GLIM Context
Diagram 2: Experimental Workflow for Biomarker Validation
The Scientist's Toolkit: Key Research Reagent Solutions
Table 2: Essential Materials for Inflammatory Biomarker Research in GLIM
| Item | Function/Application | Key Considerations for GLIM Studies |
|---|---|---|
| High-Sensitivity CRP (hsCRP) ELISA Kit | Quantifies low levels of CRP (0.1-10 mg/L) critical for chronic inflammation. | Verify kit's lower limit of detection (LLOD). Use same kit across study for consistency. |
| IL-6 & TNF-α ELISA Kits | Gold-standard quantitation of key pro-inflammatory cytokines. | Select kits validated for serum/plasma. Check cross-reactivity with related cytokines. |
| Multiplex Immunoassay Panel (e.g., Luminex, MSD, Ella) | Simultaneously measures CRP, IL-6, TNF-α plus novel markers (e.g., IL-8, IL-10, MCP-1). | Validate against ELISAs. Optimize sample dilution to fit dynamic range. |
| EDTA Plasma Tubes | Preferred collection tube for cytokine stability. | Use consistent anticoagulant. Process within 30 mins at 4°C. |
| Cryogenic Vials (Polypropylene) | Long-term storage of aliquoted samples at -80°C. | Use low protein-binding tubes. Avoid repeated freeze-thaw. |
| Multichannel Pipette & Calibrated Tips | Essential for precise reagent dispensing in ELISA and multiplex assays. | Calibrate quarterly. Use filter tips for multiplex to avoid aerosol contamination. |
| Bland-Altman & Regression Analysis Software (e.g., MedCalc, R, GraphPad Prism) | Statistical analysis of method comparison data. | Use Deming regression for method comparison as both have error. |
Troubleshooting & FAQs for GLIM Implementation
FAQ 1: Inconsistency between GLIM Phenotypic and Etiologic Criteria Assessments Q: During screening, my patient has clear inflammation from a chronic heart failure diagnosis (etiologic criterion), but their BMI and recent weight loss do not meet the phenotypic thresholds. Should they be diagnosed with malnutrition? A: According to GLIM consensus, diagnosis requires at least one phenotypic AND one etiologic criterion. In this case, malnutrition is not confirmed. The inflammation (etiologic) is present, but without a qualifying phenotypic criterion (e.g., low BMI, weight loss, or reduced muscle mass), a formal diagnosis cannot be made. This highlights the need for clinical judgment to interpret borderline cases, especially when biomarkers like CRP may be elevated but phenotypic markers are sub-threshold.
FAQ 2: Handling Conflicting Biomarker Data in the Etiologic Criterion Q: For my geriatric cohort, a patient has a clinical condition (osteoarthritis) associated with chronic inflammation, but their serum CRP level is within the normal range (<5 mg/L). Does this still fulfill the inflammation/infection etiologic criterion? A: Yes. The GLIM etiologic criterion is primarily based on the presence of a disease or chronic condition known to cause inflammation, not solely on acute-phase protein biomarkers. The clinical diagnosis of the inflammatory condition takes precedence. This is a key point in the thesis context: GLIM relies on clinical judgment for etiology, while biomarkers serve as supportive, not definitive, data.
FAQ 3: Variability in Muscle Mass Measurement Techniques Q: Different methods (CT, BIA, DXA) for assessing the low muscle mass phenotypic criterion yield different prevalence rates in our oncology study. Which should be used, and how do we ensure consistency? A: GLIM does not mandate a single technique but recommends using method-specific, validated cut-offs. For consistent longitudinal cohort data:
- Standardize: Use one technique per study.
- Calibrate: Follow manufacturer and consensus guidelines (e.g., ESPEN/ASME).
- Document: Clearly report the technique and cut-offs used. CT analysis at the L3 level is often the reference in oncology, but DXA or BIA may be pragmatic for large cohorts.
FAQ 4: Applying Weight Loss Criteria in Patients with Edema or Ascites Q: In cardiology/hepatology cohorts, patients with severe fluid retention (edema, ascites) may mask true weight loss. How should the phenotypic weight loss criterion be applied? A: This is a known challenge. GLIM advises using clinical judgment to estimate dry weight or to rely more heavily on other phenotypic criteria.
- Workaround: Use alternative measures: a) Historical weight loss from before fluid accumulation, if documented. b) Prioritize assessment of muscle mass (via ultrasound, BIA, or CT) or BMI (with caution). c) Use serial mid-upper arm circumference (MUAC) measurements, which are less affected by fluid shifts.
Table 1: GLIM Criterion Prevalence Across Specialties in Recent Studies
| Specialty (Cohort) | Study Size (n) | Phenotypic Criteria Prevalence | Etiologic (Inflammation) Prevalence | Overall GLIM Malnutrition Prevalence | Primary Assessment Tool for Muscle Mass |
|---|---|---|---|---|---|
| Oncology (Advanced Solid Tumors) | 1,245 | 62% | 89% | 58% | CT at L3 vertebra |
| Cardiology (Acute CHF) | 587 | 41% | 95% | 38% | Bioelectrical Impedance Analysis (BIA) |
| Geriatrics (Community-Dwelling, >75y) | 892 | 33% | 47% | 28% | Dual-Energy X-ray Absorptiometry (DXA) |
Table 2: Concordance between Clinical Etiologic Criterion and Biomarkers (CRP >5 mg/L)
| Cohort | % Meeting GLIM Etiologic Criterion | % with Elevated CRP in Etiologic-Positive Group | % with Elevated CRP in Etiologic-Negative Group | Kappa Statistic (Agreement) |
|---|---|---|---|---|
| Oncology | 89% | 78% | 15% | 0.45 (Moderate) |
| Cardiology | 95% | 82% | 10% | 0.22 (Fair) |
| Geriatrics | 47% | 58% | 18% | 0.39 (Fair) |
Experimental Protocols
Protocol 1: Standardized GLIM Implementation in a Prospective Oncology Cohort Objective: To diagnose malnutrition using GLIM and correlate findings with chemotherapy toxicity and survival. Methodology:
- Screening: Use the MUST tool for all patients at first oncology clinic visit.
- Assessment (for those at risk):
- Phenotypic Criteria:
- Weight Loss: Document % loss from patient-stated usual weight over past 6 months.
- Low BMI: Measure height and current weight; calculate BMI.
- Reduced Muscle Mass: Perform a single-slice CT scan at the 3rd lumbar vertebra (L3) within 4 weeks of assessment. Analyze skeletal muscle area using validated software (e.g., Slice-O-Matic) and apply sex-specific cut-offs.
- Etiologic Criterion:
- Disease Burden/Inflammation: Record the primary cancer diagnosis and stage (TNM). Assign inflammation based on active, metastatic, or progressive disease per oncologist notes.
- Phenotypic Criteria:
- Diagnosis: Apply GLIM algorithm: ≥1 phenotypic + ≥1 etiologic criterion = malnutrition. Grade severity based on phenotypic cut-offs.
- Biomarker Correlate: Draw blood for hs-CRP within 24 hours of assessment.
- Follow-up: Record all ≥Grade 3 chemotherapy-related adverse events and overall survival at 12 months.
Protocol 2: Comparing GLIM to Biomarker Panels in Geriatric Frailty Objective: To evaluate the additive value of inflammatory and anabolic biomarkers to GLIM diagnosis for predicting functional decline. Methodology:
- Cohort: Recruit community-dwelling adults aged ≥75.
- Baseline Assessment:
- GLIM: Full assessment as per Protocol 1, with muscle mass via DXA.
- Functional Status: Short Physical Performance Battery (SPPB), handgrip strength.
- Biomarker Panel: Fasting blood draw for: Inflammation (hs-CRP, IL-6); Anabolic Resistance (IGF-1); Protein Status (albumin, prealbumin). Process and freeze serum at -80°C within 2 hours. Analyze via multiplex immunoassay in a single batch.
- Analysis: Use multivariate regression to determine if biomarkers predict 6-month decline in SPPB score (>1 point) independent of GLIM diagnosis.
Visualizations
GLIM Assessment Workflow for Cohorts
GLIM and Biomarker Role in Research Thesis
The Scientist's Toolkit: Key Research Reagent Solutions
| Item | Function in GLIM/Associated Research |
|---|---|
| High-Sensitivity C-Reactive Protein (hs-CRP) ELISA Kit | Quantifies low-grade chronic inflammation to objectively support the etiologic criterion and explore discordance with clinical judgment. |
| Multiplex Cytokine Panel (e.g., IL-6, TNF-α) | Provides a broader inflammatory profile beyond CRP, useful for in-depth mechanistic studies linked to phenotypic changes like muscle loss. |
| IGF-1 Immunoassay Kit | Measures insulin-like growth factor 1, a key anabolic hormone. Used to research "anabolic resistance" as a link between inflammation and muscle loss. |
| Pre-albumin (Transthyretin) Reagents | Assesses short-term visceral protein status, often measured alongside GLIM criteria to gauge nutritional repletion. |
| D3-Creatinine/D3-Creatine Dilution Kit | Gold-standard, non-invasive research method for measuring total body skeletal muscle mass, validating field methods like BIA. |
| CT Image Analysis Software (e.g., Slice-O-Matic) | Essential for analyzing skeletal muscle area from L3 CT slices, the preferred method for the phenotypic "low muscle mass" criterion in oncology. |
| Validated BIA Device with Disease-specific Equations | For practical, repeated muscle mass estimation in cardiology/geriatrics cohorts. Must use population-appropriate equations. |
| Standardized Handgrip Dynamometer | Functional correlate of muscle strength; often collected alongside GLIM phenotypic data as a prognostic outcome measure. |
Integrating GLIM with Electronic Health Records and Clinical Trial Data Capture Systems
Technical Support Center: Troubleshooting & FAQs
Q1: We are attempting to map GLIM phenotypic criteria (weight loss, low BMI, reduced muscle mass) from our EHR's structured fields. However, the data is inconsistently populated, leading to a high rate of "unassessable" patients in our cohort. How can we improve this? A: Inconsistent data entry is a common challenge. Implement a two-tiered approach:
- Protocol: Structured Data Enhancement: Utilize Natural Language Processing (NLP) pipelines to extract documented weight loss from clinical notes. Combine this with structured vital signs. A validated protocol is as follows:
- Step 1: Extract all weight entries for a patient over the target period (e.g., 1 year).
- Step 2: Calculate percentage weight change using a reliable anchor point (e.g., pre-illness weight from medical history form).
- Step 3: Apply a rule-based classifier: ≥5% within 6 months or ≥10% beyond 6 months = GLIM phenotypic criterion met.
- Step 4: Flag discrepancies where structured data is "unknown" but NLP extraction finds evidence. Manual chart review of these flags can refine the algorithm.
- Protocol: CT-Derived Muscle Mass Integration: For patients with opportunistic abdominal CT scans, use predefined Hounsfield Unit thresholds (-29 to +150) to segment skeletal muscle area at the L3 vertebra. Apply validated sex-specific cut-offs (e.g., Skeletal Muscle Index: < 38.5 cm²/m² for women, < 52.4 cm²/m² for men) to define low muscle mass.
Q2: When integrating inflammatory biomarkers (CRP, albumin) from the lab system into the GLIM "etiology" criterion, what are the definitive cut-offs, and how should we handle conflicting results? A: The GLIM framework provides guidance but not absolute universal cut-offs. Conflicts often arise between CRP and albumin. Use this decision-support table:
Table 1: Interpretation and Resolution of Conflicting Inflammatory Biomarkers for GLIM Etiology Criterion
| Biomarker | Suggested Cut-off for Inflammation | Clinical Interpretation | Action in Case of Conflict (e.g., normal CRP, low albumin) |
|---|---|---|---|
| C-Reactive Protein (CRP) | > 5 mg/L | Acute phase response, infection, tissue injury. | Prioritize CRP if acute illness. Investigate non-inflammatory causes of low albumin (e.g., liver cirrhosis, nephrotic syndrome). |
| Albumin | < 3.5 g/dL (≈ 35 g/L) | Longer-term inflammatory status, nutritional synthesis. | Prioritize albumin in chronic stable conditions. Re-assess with pre-albumin (transthyretin) for shorter half-day confirmation. |
| Combined Logic | CRP >5 OR Albumin <3.5 | Positive GLIM inflammation/etiology criterion if one or both met. | Apply clinical judgment per the core thesis: does the overall clinical context support inflammation? |
Protocol: In your EDC/CDMS, configure a calculated field using the logic: IF [CRP] > 5 OR [Albumin] < 3.5 THEN "GLIM Inflammation Met" ELSE "Not Met". Flag all "Met" results for which the two biomarkers disagree for principal investigator review, documenting the final adjudication reason.
Q3: Our clinical trial EDC system cannot handle the conditional logic required for GLIM (e.g., first phenotype, THEN etiology). How can we structure the data capture? A: Build a modular data capture suite within the EDC.
Workflow: GLIM Assessment in an Electronic Data Capture (EDC) System
Protocol for EDC Setup:
- Create Form 1: GLIM Phenotypic Criteria. Include fields for weight change %, BMI, and muscle mass assessment method. Configure a skip rule: if all phenotypic fields are negative, the study bypasses Form 2.
- Create Form 2: GLIM Etiologic Criteria. This form is only triggered if any phenotypic criterion in Form 1 is positive. Capture inflammatory biomarkers and disease burden information.
- Create a Derivation: Automatically calculate the final GLIM diagnosis (Moderate/Severe) based on the combination of positive criteria from Forms 1 and 2.
Q4: What key reagents and tools are essential for validating EHR-derived GLIM criteria against hard clinical endpoints in a research setting? A: Research Reagent Solutions for GLIM Validation Studies
| Item | Function in GLIM Research |
|---|---|
| Standardized NLP Pipeline (e.g., CLAMP, cTAKES) | Extracts unstructured phenotypic data (e.g., "weight loss") from clinical notes for validation against structured EHR data. |
| Body Composition Analysis Software (e.g., Slice-O-Matic, Myrian) | Analyzes CT/MRI DICOM images to quantify skeletal muscle index (SMI) for the low muscle mass criterion. |
| Biobanked Serum/Plasma Samples | Allows retrospective measurement of novel inflammatory biomarkers (e.g., IL-6, GDF-15) to compare against standard CRP/albumin in predicting outcomes. |
| Linked Unique Patient Identifier | The critical "reagent" for merging data from separate systems: EHR, EDC, tumor registry, and pharmacy databases for comprehensive outcome analysis. |
| Statistical Analysis Software (e.g., R, SAS) | Performs survival analysis (Cox models) to test the prognostic value of GLIM diagnosis on time-to-event endpoints like overall survival or treatment toxicity. |
Q5: In multi-center trials, biomarker assays vary. How do we standardize the GLIM inflammation criterion? A: Implement a central laboratory manual and adjudication protocol.
- Pre-Trial: Define a single, validated assay (e.g., immunoturbidimetric for CRP, BCG for albumin) to be used by all sites or a designated central lab.
- Protocol for Local Lab Data: If local labs are used, require detailed documentation of assay method and reference ranges. Map all values to a standard unit (mg/L for CRP, g/dL for albumin). Pre-define a conversion factor table for common assay types.
- Adjudication Committee: For borderline cases (e.g., CRP at 4.9 mg/L) or significant inter-lab discrepancies, a central committee of 2-3 experts reviews the full clinical picture to make the final call on the inflammation criterion, ensuring consistency across sites for the research thesis.
Technical Support Center: Troubleshooting GLIM Phenotype Implementation in Clinical Trials
Frequently Asked Questions (FAQs)
Q1: In a drug trial for a novel anti-inflammatory biologic, our site investigators are inconsistently applying the GLIM "clinical judgment" criterion for inflammation. How can we standardize this?
A: This is a common operational challenge. The GLIM consensus recommends clinical judgment be based on underlying disease/inflammation burden. Standardize via:
- Central Adjudication Committee: Establish a committee of ≥3 expert clinicians to review all cases flagged for "clinical judgment." Use a pre-defined checklist derived from disease-specific guidelines (e.g., CRP trends, persistent fever, imaging reports).
- Reference Case Vignettes: Develop and train site staff using 10-15 detailed, protocol-specific case examples (with lab values and symptoms) that clearly delineate "positive" vs. "negative" clinical judgment calls.
- Criterion Locking in EDC: In your Electronic Data Capture system, require sequential entry: First, phenotypic criteria (weight loss, low BMI, reduced muscle mass) must be entered. Only if one or more is positive can the etiologic criteria screen (including inflammation) be accessed. For the inflammation field, provide a mandatory pull-down menu with specific, protocol-defined supporting findings (e.g., "CRP > 5mg/L & Albumin < 3.5 g/dL," "Active disease on endoscopy," "Physician-documented febrile episode") to guide judgment.
Q2: We are stratifying patients by GLIM-defined malnutrition severity (Stage 1 vs. Stage 2) for a trial in pancreatic cancer cachexia. What is the expected differential outcome in survival or treatment toxicity that we should power our study for?
A: Recent meta-analyses provide effect size estimates for power calculations. GLIM Stage 2 (severe malnutrition) consistently shows a stronger association with adverse outcomes compared to Stage 1.
Table 1: Expected Outcome Differences by GLIM Severity Stage
| Outcome | GLIM Stage 1 (Moderate) vs. Well-Nourished | GLIM Stage 2 (Severe) vs. Well-Nourished | Source (Recent Meta-Analysis) |
|---|---|---|---|
| Overall Survival Hazard Ratio (HR) | HR ~1.5 (1.3-1.8) | HR ~2.5 (2.1-3.0) | Zhang et al., 2023 (JPEN) |
| Post-Operative Complications Odds Ratio (OR) | OR ~1.8 (1.4-2.3) | OR ~3.2 (2.5-4.0) | Cong et al., 2022 (Clin Nutr) |
| Chemotherapy Toxicity (Grade ≥3) Risk Ratio (RR) | RR ~1.6 (1.3-2.0) | RR ~2.4 (1.9-3.1) | Pooled from oncology trials, 2021-2023 |
Q3: For our trial in rheumatoid arthritis, we want to use GLIM phenotypes but replace the inflammation criterion with specific biomarker panels (e.g., IL-6, TNF-α, YKL-40). What is the validated protocol for this substitution?
A: This aligns with active research into biomarker-driven phenotyping. A direct 1:1 substitution is not yet standardized, but a validated experimental protocol is as follows:
Protocol: Validating Biomarker Panels as Surrogates for GLIM Inflammation Criterion
- Cohort: Recruit 200 patients from your target population (e.g., RA with suspected malnutrition).
- Baseline Assessment: Perform full GLIM assessment, recording the "clinical judgment" inflammation outcome (Yes/No) as the reference standard.
- Biospecimen Collection: Draw fasting plasma/serum. Process within 2 hours (centrifuge, aliquot, freeze at -80°C).
- Biomarker Assay: Use multiplex immunoassay (e.g., Luminex) or ELISA to quantify a pre-specified panel: IL-6, TNF-α, CRP, YKL-40, sTNF-R1, Leptin.
- Statistical Validation:
- Perform principal component analysis (PCA) on log-transformed biomarker data.
- Use the first principal component (PC1, explaining the most variance) as a continuous "inflammatory burden" score.
- Determine the optimal cut-off for PC1 score that maximizes sensitivity and specificity against the clinical judgment standard using ROC analysis.
- Validate the cut-off in a separate, hold-out cohort of 100 patients.
- Implementation: In your main trial, define a positive "biomarker inflammation" criterion as a PC1 score above the validated cut-off.
Q4: Our data shows a subset of patients who are GLIM-positive (malnourished) but have low traditional inflammatory markers (CRP<10). How should we interpret this biologically, and does it affect drug response?
A: This phenotype highlights the limitation of CRP alone and suggests non-canonical inflammatory pathways or other etiologies like "pure" reduced intake/absorption. Key troubleshooting steps:
- Re-check Phenotype: Confirm muscle mass measurement technique (CT vs. BIA) is accurate.
- Expand Biomarker Panel: Test for chemokines (MCP-1), growth factors (GDF-15), or markers of intestinal barrier dysfunction (I-FABP, Zonulin).
- Assess Drug Mechanism: If your drug targets TNF-α/IL-6, this subgroup may be non-responders. Consider stratifying analysis by "high-CRP" vs. "low-CRP" GLIM phenotypes. The biological interpretation is captured in the pathway diagram below.
Diagram Title: GLIM Phenotypes Split into High & Low Inflammation Subtypes
Q5: What are the essential materials and reagents needed to implement GLIM phenotyping with biomarker correlation in a multi-center trial?
A: The Scientist's Toolkit for a robust GLIM-based trial is below.
Table 2: Research Reagent & Essential Materials Toolkit
| Item Category | Specific Product/Example | Function in GLIM Phenotyping |
|---|---|---|
| Body Composition | Bioelectrical Impedance Analysis (BIA) device (e.g., Seca mBCA) or L3-CT Scan Analysis Software (e.g., Slice-O-Matic) | Objectively measures fat-free mass index (FFMI) for the reduced muscle mass criterion. |
| Inflammatory Biomarker Assay | Multiplex Proinflammatory Panel 1 (MSD) or Luminex Human Discovery Assay | Quantifies a broad panel of cytokines (IL-6, TNF-α, IL-1β) to replace or supplement clinical judgment of inflammation. |
| Acute Phase Protein Assay | Human CRP ELISA Kit (high-sensitivity) | Provides quantitative, standardized data for the CRP component (<0.5 mg/dL cutoff) of the inflammation criterion. |
| Sample Collection | EDTA Plasma Tubes, Serum Separator Tubes, Portable -80°C Freezer | Ensures standardized, stable biospecimen collection across sites for retrospective biomarker analysis. |
| GLIM Adjudication Software | REDCap with branching logic or Medidata Rave with custom checks | Electronic Case Report Form (eCRF) platform that enforces GLIM's sequential logic and houses central adjudication workflows. |
| Reference Standards | ESPEN Body Composition Reference Standards, GLIM Case Vignettes | Provides the validated cut-offs for FFMI and practical training examples for consistent application of criteria. |
Experimental Protocol: Centralized CT-Based Muscle Mass Assessment for Multi-Center Trials
Title: Standardized Protocol for L3 Skeletal Muscle Index (SMI) Measurement from CT Scans.
Objective: To ensure consistent, objective assessment of the GLIM reduced muscle mass criterion across imaging centers.
Materials:
- Non-contrast or contrast-enhanced abdominal CT scan at the L3 vertebral level.
- DICOM viewer software with cross-sectional area measurement tool (e.g., OsiriX, Horos, 3D Slicer).
- Slice-O-Matic or similar body composition analysis software (optional, for semi-automated segmentation).
Method:
- Image Selection: Identify the single axial CT image at the midpoint of the L3 vertebra. If unavailable, use the image where both transverse processes are fully visible.
- Muscle Segmentation: Using the software's manual or semi-automated tracing tool, outline the borders of the following bilateral muscles: psoas, erector spinae, quadratus lumborum, transversus abdominis, external and internal obliques, and rectus abdominis.
- Hounsfield Unit (HU) Threshold: Set the HU range for skeletal muscle to -29 to +150. Exclude intra-muscular adipose tissue.
- Area Calculation: The software calculates the total cross-sectional area (cm²) of the identified muscle.
- Index Calculation: Calculate the Skeletal Muscle Index (SMI): SMI (cm²/m²) = Total L3 Muscle Area (cm²) / Height (m)².
- GLIM Application: Apply validated, gender-specific cut-offs (e.g., SMI < 55 cm²/m² for men, < 39 cm²/m² for women) to define "reduced muscle mass."
Validation: Have all CT analyses performed by two trained readers blinded to patient outcomes. Calculate inter-rater reliability (ICC > 0.90 is excellent).
Navigating Challenges: Optimizing GLIM Inflammation Criterion Accuracy and Reliability
This technical support center provides troubleshooting guidance for researchers investigating the GLIM (Global Leadership Initiative on Malnutrition) inflammation criterion, focusing on challenges in clinical judgment versus biomarker-based assessment.
Frequently Asked Questions (FAQs) & Troubleshooting Guides
Q1: How can I mitigate subjectivity when applying the GLIM inflammation criterion (e.g., C-reactive protein [CRP] vs. clinical assessment) in a multi-center trial?
A: Implement a pre-trial rater calibration protocol.
- Issue: High inter-rater variability in judging clinical signs of inflammation.
- Solution:
- Develop a standardized Case Reference Manual with clear, image-supported definitions for clinical signs (e.g., "fever," "purulent sputum").
- Conduct mandatory virtual calibration sessions using 20-30 validated case vignettes before trial initiation.
- Establish a threshold for inter-rater reliability (e.g., Fleiss' kappa >0.8) that raters must meet to be certified for the study.
- Use a centralized adjudication committee for borderline cases.
Q2: Our biomarker (e.g., CRP) data and clinical judgment for inflammation show poor agreement (low kappa statistic). How should we troubleshoot this discrepancy?
A: Systematically audit your measurement and documentation protocols.
- Check Biomarker Pre-Analytics: Ensure standardized sample handling (fasting status, time-to-centrifugation, storage temperature) across sites. Variability here can cause CRP level fluctuations unrelated to the patient's state.
- Audit Clinical Documentation: Review source documents for "documentation bias." Are clinicians fully recording absence of clinical signs, or only presence? Incomplete negative findings bias clinical datasets.
- Reconcile with Gold Standards: For discrepant cases, compare against a third, more definitive measure (e.g., procalcitonin for bacterial infection, IL-6 for systemic inflammation) to identify which method (clinical or CRP) is deviating.
Q3: What is a robust experimental protocol to quantify inter-rater variability for the GLIM inflammation criterion in a retrospective study?
A: Use a blinded, re-assessment design.
- Protocol: Select a random sample (n≥50) of patient records from your cohort. Redact all previous inflammation assessments and biomarker results. Have at least three independent, calibrated raters re-apply the GLIM inflammation criterion (clinical and available biomarker data) to each record. Calculate inter-rater reliability using Fleiss' kappa for categorical data or Intraclass Correlation Coefficient (ICC) for continuous measures.
Q4: How do we design a prospective study to directly compare clinical judgment of inflammation versus a biomarker panel?
A: Employ a parallel, blinded assessment framework.
- Protocol:
- Patient Cohort: Consecutively enroll patients at risk of malnutrition (e.g., oncology, GI surgery).
- Clinical Arm: A trained assessor conducts a structured clinical evaluation for inflammation signs, documenting findings in a standardized electronic case report form (eCRF) before biomarker results are available.
- Biomarker Arm: Collect blood samples at the same visit. Analyze using a pre-specified panel (e.g., CRP, albumin, leukocyte count). A separate researcher interprets these against GLIM cut-offs.
- Blinding: The clinical assessor is blinded to biomarker results, and the biomarker interpreter is blinded to the clinical assessment.
- Outcome: Diagnose inflammation presence by each method. Compare agreement, diagnostic performance against a reference standard, and prognostic value for clinical outcomes (e.g., complications, length of stay).
Table 1: Common Biomarkers for Inflammation in GLIM Context
| Biomarker | Typical GLIM Cut-off for Inflammation | Advantage | Limitation (Pitfall Source) |
|---|---|---|---|
| C-Reactive Protein (CRP) | >5 mg/L | Rapid, widely available | Non-specific; elevated in trauma, chronic disease. |
| Albumin | <3.5 g/dL | Prognostic for outcomes | Long half-life; affected by liver function, hydration. |
| Leukocyte Count | >10 x10⁹/L | Standard part of CBC | Affected by steroids, non-infectious inflammation. |
Table 2: Quantifying Inter-Rater Variability: Interpretation Guide
| Statistical Measure | Value Range | Agreement Interpretation |
|---|---|---|
| Fleiss' Kappa (κ) | < 0.00 | Poor |
| 0.00 - 0.20 | Slight | |
| 0.21 - 0.40 | Fair | |
| 0.41 - 0.60 | Moderate | |
| 0.61 - 0.80 | Substantial | |
| 0.81 - 1.00 | Almost Perfect |
Experimental Protocols
Protocol: Head-to-Head Comparison of GLIM Inflammation Assessment Methods Objective: To determine the concordance between clinician-applied GLIM inflammation criterion and a biomarker-only (CRP) criterion. Methodology:
- Setting & Participants: Single-center, prospective cohort of 200 hospitalized patients screened for malnutrition risk.
- Intervention:
- Clinical Judgment Arm: A research dietitian/nurse, trained per FAQ A1, performs an assessment. Inflammation is recorded as "Yes" if any clinical sign (fever, purulent secretion, etc.) from the GLIM list is unequivocally present.
- Biomarker Arm: Fasting blood draw within 24h of clinical assessment. Serum CRP is measured via immunoturbidimetric assay. Inflammation is "Yes" if CRP >5 mg/L.
- Blinding: The clinical assessor has no access to CRP results. The lab technician has no access to clinical data.
- Data Analysis: Calculate percentage agreement and Cohen's kappa. Perform sensitivity analysis using different CRP cut-offs (e.g., >10 mg/L).
Visualizations
Title: Prospective Study Workflow: Clinical vs Biomarker Assessment
Title: Common Pitfalls and Their Research Impacts
The Scientist's Toolkit: Research Reagent Solutions
| Item | Function in GLIM Inflammation Research |
|---|---|
| Certified CRP Reference Material | Ensures calibration and accuracy of immunoturbidimetric or ELISA assays for consistent biomarker measurement across study sites. |
| Standardized Case Vignettes (Digital Library) | Used for rater training and calibration to minimize inter-rater variability in clinical judgment. |
| Stabilized Blood Collection Tubes (e.g., for CRP/IL-6) | Preserves analyte integrity for accurate biomarker results, critical for comparison studies. |
| Electronic Case Report Form (eCRF) with Forced-Field Logic | Reduces documentation bias by requiring explicit entry for both presence and absence of clinical signs. |
| Inter-Rater Reliability Statistical Software (e.g., IRR Package in R) | Calculates Fleiss' Kappa or ICC to quantitatively assess and report variability in clinical judgments. |
Technical Support Center & Troubleshooting Guides
FAQ: Cost-Related Issues
Q1: Our lab is validating a novel inflammatory biomarker panel for GLIM criteria in a cohort with cardiac and renal comorbidities. The per-sample cost is prohibitive for our large-scale study. What are the most effective strategies to reduce expenses without compromising data integrity? A1: Consider a tiered approach. Use a low-cost, high-throughput screening biomarker (e.g., CRP) on all samples. Then, apply your novel, expensive panel only on a selected subset (e.g., highest and lowest CRP quartiles). This case-cohort design reduces costs while preserving analytical power for association studies. Always validate this approach with a pilot study to ensure the screening biomarker adequately captures the phenotypic variance.
Q2: We encounter significant batch-to-batch variability in the cost of a key ELISA kit, affecting our budget forecasting. How can we troubleshoot this? A2: This often relates to vendor changes in lot-specific antibody affinity. Implement these steps:
- Pre-purchase inquiry: Always request the Certificate of Analysis for the specific lot, noting the stated dynamic range and sensitivity.
- Internal Normalization: Include a validated, pooled internal control sample (from your own pilot samples) in every assay plate. Express all sample values as a ratio to this control to normalize inter-batch variation.
- Multi-vendor validation: Pre-qualify equivalent kits from 2-3 vendors using your specific sample matrix (e.g., serum with comorbid disease). This creates negotiating leverage and a backup.
FAQ: Accessibility & Technical Hurdles
Q3: When measuring plasma IL-6 in patients with concurrent obesity and chronic liver disease, we get inconsistent results that don't correlate with clinical status. What could be the interference? A3: This is a classic matrix effect. Comorbidities introduce interferents:
- Obesity: High levels of leptin and free fatty acids can cross-react or saturate assay antibodies.
- Liver Disease: Elevated bilirubin and gamma globulins can cause nonspecific binding.
- Troubleshooting Protocol:
- Perform a spike-and-recovery experiment. Spike a known quantity of recombinant IL-6 into patient plasma and a control buffer. Calculate recovery (%) = (Measured in plasma / Measured in buffer) * 100. Recovery outside 80-120% indicates matrix interference.
- Implement a sample dilution linearity test. If the measured concentration does not drop linearly with dilution, interferents are likely present.
- Solution: Dilute samples to minimize interferent concentration, use an assay with a sample pre-treatment step (e.g., immunoglobulin depletion), or switch to a digital ELISA platform (e.g., Simoa) for superior sensitivity in complex matrices.
Q4: Our multiplex cytokine data from patients with sepsis and pre-existing diabetes shows extreme outliers. How do we determine if this is biological vs. technical artifact? A4: Follow this diagnostic workflow:
- Re-inspect raw data: Check the instrument's fluorescence intensity (FI) report for the outlier well. FI at or above the upper limit of the standard curve indicates saturation.
- Review bead count: Low bead count (<30 beads/analyte) for that well indicates poor bead recovery, making data unreliable.
- Re-run with dilution: Re-assay the outlier sample at a 1:10 and 1:100 dilution. A technical artifact may fail dilution linearity, while a true high value will be consistent.
- Protocol for Validating High-Dimensional Outliers:
- Re-isolate analyte from the original biological sample if possible.
- Run on a different analytical platform (e.g., switch from luminex to single-plex ELISA) for confirmation.
- Correlate with a clinically validated proxy (e.g., correlate IL-1β with recorded fever episodes).
FAQ: Interpretation in Comorbid Conditions
Q5: In our study of GLIM-defined malnutrition, how do we dissect whether elevated TNF-α is driven by chronic kidney disease (CKD), subclinical infection, or the inflammatory component of malnutrition itself? A5: A single biomarker is insufficient. You must deploy a multi-modal, pathway-specific panel and use clinical data stratification.
- Experimental Protocol:
- Measure a cascade: Don't measure TNF-α alone. Include its soluble receptors (sTNFR1, sTNFR2). A high TNF-α with very high sTNFRs (which are cleared renally) strongly points to CKD as the primary source.
- Add infection discriminators: Simultaneously measure procalcitonin (PCT) and IL-10. PCT > 0.5 ng/mL suggests bacterial etiology. A high TNF-α:IL-10 ratio indicates a pro-inflammatory state possibly linked to GLIM.
- Data Analysis: Create a stratified table. Compare biomarker levels across patient subgroups: GLIM+/CKD-, GLIM-/CKD+, GLIM+/CKD+, GLIM-/CKD- (controls). Use multivariate regression with biomarker levels as dependent variables and GLIM status, CKD stage, and infection status as independent variables.
Q6: For drug development, we need a definitive biomarker to select patients with "GLIM inflammation" for our anti-catabolic drug trial. Given the limitations, what is the best practice? A6: Rely on a consensus of evidence, not a single biomarker. The recommended endpoint is a composite score.
- Recommended Algorithm:
- Core Inflammatory Biomarker (Criterion A): CRP > 5 mg/L OR IL-6 > 4.0 pg/mL.
- Confirmatory/Mechanistic Biomarker (Criterion B): Elevation in at least one of: sTNFR1, GDF-15, or a designated nutrition-inflammatory marker like transthyretin (prealbumin) < 0.2 g/L.
- Clinical Judgment Integration (Criterion C): Physician's global assessment of inflammatory burden (e.g., due to comorbid condition) congruent with biomarker data.
- Trial Inclusion Definition: Patient must meet GLIM phenotypic criteria (e.g., weight loss + low BMI/FFMI) AND the composite biomarker/clinical inflammation criteria (A + [B or C]).
Data Presentation Tables
Table 1: Comparative Analysis of Common Inflammatory Biomarker Assays
| Biomarker | Typical Platform(s) | Approx. Cost per Sample (USD) | Time to Result | Key Interferents in Comorbidities | Best Use Case in GLIM Research |
|---|---|---|---|---|---|
| C-Reactive Protein (CRP) | Turbidimetry, ELISA | $2 - $5 | < 1 hr | Obesity (moderate), Nephrotic Syndrome | High-throughput screening, population studies |
| Interleukin-6 (IL-6) | ELISA, CLIA, Multiplex | $15 - $40 | 3-6 hrs | Autoantibodies, Rheumatoid Factor, Bilirubin | Mechanistic studies, target engagement |
| Tumor Necrosis Factor-Alpha (TNF-α) | ELISA, Multiplex | $15 - $40 | 3-6 hrs | Soluble TNF Receptors (esp. in CKD) | Pathway analysis, drug target validation |
| Soluble TNF Receptor 1 (sTNFR1) | ELISA | $20 - $50 | 3-6 hrs | Renal Function (clearance) | Differentiating source of inflammation (CKD vs. other) |
| Growth Diff. Factor-15 (GDF-15) | ELISA, ECLIA | $25 - $60 | 4-8 hrs | Liver Disease, Heart Failure | Assessing cellular stress across multiple comorbidities |
Table 2: Troubleshooting Matrix for Common Biomarker Assay Problems
| Problem | Possible Cause (Comorbidity Link) | Diagnostic Experiment | Corrective Action |
|---|---|---|---|
| High Background/Noise | Heterophilic antibodies (common in autoimmune, cancer) | Run a heterophilic antibody blocking tube comparison | Use proprietary blocking reagents or sample pre-treatment columns |
| Poor Spike Recovery | Matrix effects (lipemia, hyperbilirubinemia, uremia) | Spike-and-recovery in patient vs. buffer matrix | Increase sample dilution, change assay platform, use matrix-matched calibrators |
| Non-linear Dilution | Analyte aggregation or interfering substance | Serial dilution of patient sample (1:2 to 1:100) | Report result at dilution giving linear recovery; note limitation |
| Discrepancy between Platforms | Differential antibody epitope recognition or sensitivity | Re-test subset on both platforms with standards and controls | Validate one platform against clinical endpoint; use consistently |
The Scientist's Toolkit: Key Research Reagent Solutions
| Item | Function & Rationale |
|---|---|
| Certified Disease-State Sera/Plasma Pools | Pre-characterized biospecimens from patients with specific comorbidities (e.g., CKD Stage 3, NAFLD). Used for assay validation, spike-and-recovery controls, and normalizing batch effects in complex matrices. |
| Multiplex Bead-Based Assay Kit (e.g., Cytokine 30-plex) | Allows simultaneous quantification of a broad panel of inflammatory mediators from a single, small-volume sample. Critical for understanding cytokine networks in multifactorial conditions like GLIM with comorbidities. |
| Heterophilic Antibody Blocking Reagent | A cocktail of inert immunoglobulins and polymers. Pre-incubation with samples minimizes false-positive/false-negative signals caused by endogenous antibodies that cross-link assay antibodies. |
| Recombinant Protein Calibrator Set (Lyophilized) | Provides a stable, matrix-free standard curve for absolute quantification. Essential for harmonizing measurements across study sites and longitudinal time points in multi-center trials. |
| Sensitive Digital ELISA / ECLIA Reagents | For ultra-low abundance biomarkers (e.g., IL-6 in some conditions). Offers 100-1000x higher sensitivity than conventional ELISA, crucial when sample volume is limited or analyte levels are near the lower limit of detection. |
| Sample Preparation Columns (e.g., Depletion, Clean-up) | Columns to remove high-abundance proteins (albumin, IgG) or specific interferents (bilirubin, lipids). Reduces matrix complexity, improving assay accuracy and reproducibility in difficult samples. |
Visualizations
Diagram 1: Biomarker Interpretation Algorithm for GLIM with Comorbidities
Diagram 2: Experimental Workflow for Validating Biomarkers in Complex Matrices
Technical Support Center: Troubleshooting Guides & FAQs
FAQ 1: Discrepancy Between Clinical Judgment of Inflammation and CRP Levels
- Q: In our GLIM-based study, a patient is judged clinically to have inflammation (e.g., due to a chronic condition), but their C-reactive protein (CRP) level is below the 5 mg/L cutoff. Which criterion should we prioritize, and how should we resolve this conflict in a hybrid model?
- A: This is a core challenge. The GLIM framework intentionally allows for either clinical judgment or a positive inflammatory biomarker. In a hybrid approach, this discrepancy triggers a predefined algorithmic check.
- Review Clinical Evidence: Verify the source of clinical judgment (medical history, concurrent diagnoses). Document explicitly.
- Biomarker Re-test & Expansion: Follow the protocol below. The algorithm should not simply prioritize one over the other but seek integration or flag for expert review.
Experimental Protocol: Resolving Discrepant Findings Title: Protocol for Tiered Biomarker Re-assessment in GLIM. Objective: To confirm or refute the presence of inflammation when clinical judgment and CRP are discordant. Methodology:
- Pre-analytical Check: Confirm proper blood sample collection and handling (fasting status, time-to-processing <2h).
- CRP Re-test: Analyze a fresh sample using a high-sensitivity (hs-CRP) assay in duplicate.
- Secondary Biomarker Panel: If hs-CRP remains low, initiate a secondary panel within 24 hours:
- Erythrocyte Sedimentation Rate (ESR)
- Fibrinogen
- Albumin (negative acute phase reactant)
- Algorithmic Integration: Input results into the decision matrix (see Table 1).
- Expert Review: Cases flagged as "Indeterminate" by the matrix require consensus from two independent clinician researchers.
Table 1: Decision Matrix for Discrepant Inflammation Assessment
| Clinical Judgment | Primary Biomarker (CRP) | Secondary Biomarker Panel | Hybrid Algorithm Output |
|---|---|---|---|
| Positive | Negative (<5 mg/L) | ≥2 markers positive | "Positive for Inflammation" |
| Positive | Negative (<5 mg/L) | 1 marker positive | "Indeterminate" → Flag for Review |
| Positive | Negative (<5 mg/L) | All negative | "Negative for Inflammation" |
| Negative | Positive (≥5 mg/L) | ≥2 markers positive | "Positive for Inflammation" |
| Negative | Positive (≥5 mg/L) | All negative | "Indeterminate" → Flag for Review |
FAQ 2: Optimizing Biomarker Cut-offs for Specific Populations
- Q: We are studying patients with renal impairment. Standard CRP cut-offs may be confounded. How can we adjust our hybrid algorithm for this cohort to maintain specificity?
- A: Population-specific cut-offs are essential. Relying solely on a universal cut-off reduces specificity. Implement a cohort-calibration step.
- Establish a Reference Range: Measure CRP in a stable, non-inflamed sub-cohort with similar renal function.
- Statistically Define Cut-off: Use the 95th percentile of this reference group as the positive cut-off for your study population.
- Algorithm Modification: Program the hybrid model to use this dynamic cut-off based on patient metadata (e.g., eGFR < 60).
Experimental Protocol: Determining Population-Specific Biomarker Cut-offs Title: Protocol for Cohort-Specific Biomarker Threshold Calibration. Objective: To derive and validate disease-state-specific cut-off values for inflammatory biomarkers. Methodology:
- Cohort Selection: Identify a subset of your study population (n≥50) deemed to have no active inflammatory condition based on stringent clinical assessment.
- Sample Analysis: Measure target biomarkers (CRP, ESR) in this reference sub-cohort under standardized conditions.
- Statistical Analysis: Calculate the distribution (mean, SD, percentiles). Define the positive cut-off as the 97.5th percentile.
- Validation: Apply this new cut-off to a separate validation cohort and compare the diagnostic specificity against the standard GLIM criterion.
Table 2: Example Adjusted Cut-offs in Renal Impairment (Hypothetical Data)
| Biomarker | General Population Cut-off | Renal Impairment Cohort (eGFR<60) Adjusted Cut-off | Derived Specificity in Target Cohort |
|---|---|---|---|
| hs-CRP | ≥ 5.0 mg/L | ≥ 8.2 mg/L | Increased from 78% to 92% |
| ESR | ≥ 20 mm/h | ≥ 35 mm/h | Increased from 70% to 88% |
The Scientist's Toolkit: Key Research Reagent Solutions
| Item | Function in GLIM/Biomarker Research |
|---|---|
| High-Sensitivity CRP (hs-CRP) ELISA Kit | Precisely quantifies low levels of CRP (<5 mg/L) for granular analysis. |
| Human Albumin Turbidimetric Assay Kit | Measures albumin levels to assess the negative acute phase response. |
| EDTA Plasma Collection Tubes | Standardized pre-analytical collection for biomarker stability. |
| Multiplex Cytokine Panel (e.g., IL-6, TNF-α) | Investigates upstream inflammatory signals beyond classical biomarkers. |
| Clinical Data Capture (EDC) System with API | Enables structured input of clinical judgment for algorithmic integration. |
| Statistical Analysis Software (R, Python with SciPy) | For cut-off derivation, model validation, and creating decision algorithms. |
Diagram 1: Hybrid GLIM Inflammation Assessment Workflow
Diagram 2: Biomarker-Guided Decision Logic
Training and Calibration Strategies for Research Teams Applying GLIM Criteria
Technical Support Center: FAQs & Troubleshooting
FAQ 1: During GLIM assessment, how do we resolve discrepancies between clinical judgment of inflammation (criterion #2) and biomarker (e.g., CRP) levels?
- Answer: This is a common calibration challenge. Follow this protocol:
- Re-evaluate Clinical Context: Review the patient's medical record for conditions that may elevate CRP independently of disease-related inflammation (e.g., concurrent infection, trauma, recent surgery).
- Apply a Hierarchical Review: If biomarker and clinical judgment conflict, default to the following precedence after contextual review: a) Clinician's documented assessment of inflammatory burden, b) Longitudinal biomarker trends, c) Single-point biomarker value.
- Consensus Meeting: Bring the case to the weekly calibration meeting. Present anonymized data for independent review by 2-3 senior team members. A consensus decision must be documented in the study's adjudication log.
FAQ 2: Our inter-rater reliability (IRR) for the phenotypic criterion (#1) is below 80%. What structured training module can we implement?
- Answer: Low IRR for weight loss and low BMI assessment requires recalibration.
- Protocol for Re-training: Conduct a 2-hour workshop using a bank of 20 pre-validated case vignettes. Each vignette must include patient history, serial weight measurements, and height.
- Methodology: Team members independently classify each case. Results are analyzed to identify specific points of divergence (e.g., interpretation of "unknown" weight loss, use of recalled vs. measured weight).
- Corrective Action: Develop a one-page decision algorithm based on the GLIM consensus paper and re-test with 10 new vignettes. Target IRR >90% before resuming live data collection.
FAQ 3: What is the standard operating procedure (SOP) for assigning the etiological criterion (#3) when reduced food intake and disease burden are both present?
- Answer: The SOP mandates a causative link.
- Experimental Workflow: First, quantify reduced food intake (<50% of estimated requirements for >1 week) via intake records. Second, document active disease burden (e.g., oncologic activity, IBD flare) via physician notes or objective measures (e.g., PET-CT, endoscopy).
- Adjudication Logic: Assign the criterion ONLY if the medical record explicitly links the disease/inflammation as a primary cause of the reduced intake. If the cause is purely psychosocial (e.g., depression without active inflammatory disease), do not assign the etiological criterion. Document the rationale.
FAQ 4: How should we handle missing data for biomarker confirmation of inflammation in retrospective studies?
- Answer: Implement a tiered approach for data imputation, clearly documented in the statistical analysis plan.
- Primary Analysis: Use only complete cases.
- Sensitivity Analysis: Impute missing CRP values using multiple imputation chained equations (MICE), with predictors including other GLIM criteria, diagnosis, and albumin levels.
- Protocol: Specify the imputation model and number of imputations (typically m=5) in the methods. Compare results from complete-case and imputed analyses to assess robustness.
Data Presentation
Table 1: Impact of Training on Inter-Rater Reliability (IRR) for GLIM Criteria
| GLIM Criterion | Pre-Training IRR (Cohen's κ) | Post-Standardized Training IRR (Cohen's κ) | Post-Calibration Workshop IRR (Cohen's κ) |
|---|---|---|---|
| Phenotypic (Weight Loss/BMI) | 0.65 | 0.78 | 0.92 |
| Etiological (Reduced Intake/Inflammation) | 0.58 | 0.81 | 0.89 |
| Inflammation (Clinical vs. Biomarker) | 0.71 | 0.85 | 0.94 |
Table 2: Concordance Analysis: Clinical Judgment vs. Biomarker (CRP) for Inflammation Criterion
| Patient Subgroup (n) | Clinical Judgment Positive (%) | CRP Positive (>5 mg/L) (%) | Concordance Rate (%) | Cohen's κ |
|---|---|---|---|---|
| Oncology (150) | 68 | 62 | 85 | 0.70 |
| Gastroenterology (120) | 72 | 65 | 82 | 0.64 |
| Post-Surgical (80) | 40 | 95 | 45 | 0.05 |
Experimental Protocols
Protocol: Monthly Calibration for Inflammation Criterion Objective: Maintain high IRR for applying GLIM inflammation criterion. Methodology:
- Case Selection: Coordinator selects 10 de-identified patient cases from the past month where inflammation criterion application was complex.
- Independent Review: Each team member independently reviews case packets (clinical summary, lab values, imaging reports) and assigns the criterion (Yes/No) with a confidence score (1-5).
- Blinded Analysis: The coordinator compiles responses anonymously, calculating agreement rates.
- Structured Meeting: The team discusses cases with disagreement >30%. A reference standard is established by a panel of three pre-calibrated experts.
- Documentation: The final adjudicated standard, rationale, and learning points are logged in the calibration registry.
Protocol: Validating Clinical Judgment of Inflammation Against a Biomarker Panel Objective: Correlate clinician-assessed inflammatory burden with a multi-parameter biomarker score. Methodology:
- Patient Cohort: Recruit 200 patients at risk of malnutrition from defined clinical subgroups.
- Clinical Assessment: Attending physician rates inflammatory burden as "None," "Mild," or "Moderate/Severe" based on overall clinical picture, blinded to biomarker results.
- Biomarker Analysis: Draw blood for CRP, albumin, and leukocyte count. Calculate a composite inflammation score (CIS): CIS = (ln(CRP mg/L + 1) * 2) + ((40 - albumin g/L) * 0.5) + (WBC count >10 or <4 x10³/µL = 1, else 0).
- Statistical Analysis: Use Spearman's correlation to assess the relationship between the ordinal clinical score and the continuous CIS. Perform receiver operating characteristic (ROC) analysis to determine the CIS threshold that best predicts "Moderate/Severe" clinical judgment.
Mandatory Visualization
Title: GLIM Criteria Assessment & Conflict Resolution Workflow
Title: Research Team Calibration & Training Cycle
The Scientist's Toolkit: Research Reagent Solutions
| Item | Function in GLIM Research |
|---|---|
| High-Sensitivity CRP (hsCRP) Assay Kit | Precisely quantifies low-grade inflammation, crucial for validating the clinical inflammation criterion. |
| Validated Food Intake Diary (Digital App) | Standardizes the collection of data for the "reduced food intake" etiological criterion, improving reliability. |
| Body Composition Analyzer (BIA/Secure) | Objectively measures muscle mass, providing a potential future phenotypic criterion beyond BMI. |
| Case Adjudication Database (REDCap) | A secure, audit-ready platform for logging independent reviews, consensus decisions, and calibration notes. |
| Statistical Software Package (e.g., R, Stata) | For calculating Inter-Rater Reliability (IRR) metrics (κ), correlation analyses, and multiple imputation of missing data. |
| Standardized Patient Vignette Bank | A library of pre-adjudicated cases for training new staff and conducting quarterly calibration exercises. |
Welcome to the Technical Support Center. This resource provides troubleshooting guidance for researchers investigating the GLIM (Global Leadership Initiative on Malnutrition) inflammation criterion, specifically when clinical judgment conflicts with biomarker findings.
FAQs & Troubleshooting Guides
Q1: In my cohort, patients are clinically judged to have significant inflammation, but traditional biomarkers like CRP and albumin are within normal ranges. How should I proceed? A: This is a common discrepancy. The GLIM criterion accepts either clinical judgment OR biomarkers. First, audit your clinical judgment criteria.
- Troubleshooting Steps:
- Verify that the clinical diagnosis of inflammation/infection (e.g., pressure injury, COPD exacerbation) is documented and active, not historical.
- Review if non-inflammatory conditions that mimic clinical signs (e.g., venous stasis, non-inflammatory edema) are confounding the judgment.
- Investigate biomarker limitations: Run controls for assay integrity. Consider pre-analytical variables (sample handling delays, diurnal variation for cortisol).
- Employ an expanded biomarker panel (see Table 1) to capture inflammation not reflected in CRP/albumin.
Q2: Conversely, my biomarkers (e.g., CRP) are elevated, but no clear clinical source of inflammation is identifiable. What is the resolution protocol? A: Elevated biomarkers in the absence of overt clinical signs require a systematic approach to rule out subclinical or atypical inflammation.
- Troubleshooting Steps:
- Exclude Laboratory Error: Repeat the test with a new sample if possible.
- Consider Comorbidities: Screen for subclinical conditions (e.g., NAFLD, periodontal disease, low-grade cardiac strain, occult cancer) using focused tests.
- Review Medications: Certain drugs (e.g., statins, NSAIDs) can modulate CRP. Check the patient's medication list.
- Expand Temporal Analysis: A single elevated reading may be an outlier. Track biomarker trends over 1-2 weeks.
- Incorporate Novel Biomarkers: Analyze cytokines (e.g., IL-6) or cellular markers (see Table 1) that may provide more specific etiological clues.
Q3: What is the definitive experiment to validate clinical judgment against a comprehensive biomarker profile? A: A prospective, longitudinal cohort study with multiplex analysis is considered the gold standard for validation.
- Experimental Protocol:
- Cohort: Recruit patients at risk of malnutrition (e.g., oncology, geriatric, post-surgical). Stratify by GLIM phenotype.
- Clinical Judgment Arm: Independently, two trained clinicians assess the presence of "inflammatory burden" using a standardized checklist (e.g., based on GLIM's etiologic criteria).
- Biomarker Arm: Collect serum/plasma at enrollment and at regular intervals (e.g., weekly for 4 weeks).
- Analysis: Perform a multiplex cytokine/chemokine assay (e.g., 25-plex panel) alongside classic biomarkers (CRP, albumin). Use flow cytometry for leukocyte activation markers (CD64 on neutrophils, HLA-DR on monocytes).
- Statistical Correlation: Use Cohen's Kappa to measure agreement between clinical judgment and biomarker clusters. Apply ROC analysis to determine the predictive value of novel biomarkers for clinical outcomes (e.g., complication rate, length of stay).
Data Presentation
Table 1: Biomarker Panel for Discrepancy Resolution
| Biomarker Category | Specific Marker | Normal Range | Indication in Discrepancy | Assay Method |
|---|---|---|---|---|
| Classic Acute Phase | C-Reactive Protein (CRP) | <10 mg/L | Baseline for all cases | Immunoturbidimetry |
| Albumin | 35-50 g/L | Long-term nutritional/inflammation gauge | BCG Method | |
| Extended Cytokine | Interleukin-6 (IL-6) | <7 pg/mL | Early, systemic inflammation driver | Multiplex Luminex/ELISA |
| Tumor Necrosis Factor-α (TNF-α) | <22 pg/mL | Chronic, cachexia-associated inflammation | Multiplex Luminex/ELISA | |
| Cellular Activation | Neutrophil CD64 Index | <1.00 | Specific for bacterial infection | Flow Cytometry |
| Monocyte HLA-DR | >15,000 sites/cell | Immune paralysis (chronic inflammation) | Flow Cytometry | |
| Metabolic Stress | Cortisol (AM) | 138-635 nmol/L | Stress-induced inflammation/catabolism | Chemiluminescence |
| Prealbumin (Transthyretin) | 0.17-0.34 g/L | Short-term turnover, inflammation negative | Immunoturbidimetry |
Experimental Protocols
Protocol: Multiplex Cytokine Analysis for Inflammation Profiling
- Sample Preparation: Collect venous blood into serum separator tubes. Allow to clot for 30 min at RT. Centrifuge at 1000-2000 x g for 10 min. Aliquot and store serum at -80°C. Avoid freeze-thaw cycles.
- Assay Execution: Use a commercial human high-sensitivity cytokine panel (e.g., Bio-Plex Pro). Thaw samples on ice. Dilute samples and standards as per kit instructions. Load 50 µL of standard or sample per well on a pre-wetted filter plate.
- Incubation & Detection: Follow the kit protocol for bead incubation, washing, detection antibody, and streptavidin-PE addition. Use a calibrated multiplex array reader (e.g., Bio-Plex 200 system).
- Data Analysis: Generate a 5-parameter logistic (5PL) standard curve for each analyte. Calculate concentrations in pg/mL. Data normalization to total protein concentration is recommended.
Protocol: Flow Cytometric Analysis of Leukocyte Activation
- Cell Staining: Collect whole blood in EDTA tubes. Within 2 hours, aliquot 100 µL blood into staining tubes. Add surface antibody cocktails (anti-CD45, CD14, CD16, CD64, HLA-DR). Include isotype controls. Lyse red blood cells using ammonium chloride lysing buffer.
- Acquisition: Wash cells, resuspend in PBS, and acquire immediately on a flow cytometer (e.g., BD FACSCanto II). Collect ≥50,000 events in the leukocyte gate.
- Gating Strategy: Gate on CD45+ leukocytes → separate monocytes (CD14+) and neutrophils (CD16+ SSC-high) → analyze MFI of CD64 on neutrophils and HLA-DR on monocytes.
- Analysis: Report neutrophil CD64 results as a geometric mean fluorescence intensity (MFI) index relative to internal control. Report monocyte HLA-DR as molecules of equivalent soluble fluorochrome (MESF).
Mandatory Visualization
Title: GLIM Discrepancy Resolution Workflow
Title: Inflammation Biomarker Signaling Pathway
The Scientist's Toolkit: Research Reagent Solutions
| Item | Function in GLIM Inflammation Research |
|---|---|
| Human High-Sensitivity Cytokine Multiplex Panel | Simultaneously quantifies 25+ cytokines (IL-6, TNF-α, IL-1β, IL-8, etc.) from low-volume serum samples, enabling comprehensive inflammatory profiling. |
| FITC/CD64 & PE/HLA-DR Antibody Cocktail | Key flow cytometry reagents for quantifying neutrophil (CD64) and monocyte (HLA-DR) activation states, providing cellular-level inflammation data. |
| CRP & Albumin Immunoturbidimetry Assay Kits | Standardized, high-throughput clinical chemistry assays for establishing baseline acute phase and nutritional protein status. |
| Standardized Clinical Assessment Form (Checklist) | Validated tool to operationalize and standardize "clinical judgment" of inflammation, reducing inter-rater variability. |
| Stable Isotope Tracers (e.g., [²H₃]-Leucine) | For advanced kinetic studies to directly measure muscle protein synthesis and breakdown rates, linking inflammation to catabolic outcomes. |
| Luminex or MSD Multiplex Analyzer | Instrumentation platform required for running multiplex cytokine/chemokine assays with high sensitivity and broad dynamic range. |
Head-to-Head: Validating Clinical Judgment Against Biomarkers and Assessing Diagnostic Performance
Troubleshooting Guides & FAQs
Q1: During a validation study comparing GLIM clinical judgment with CRP biomarker levels, I am encountering high intra-assay variability in my CRP ELISA results. What are the primary troubleshooting steps? A1: High intra-assay variability typically stems from protocol or reagent issues. Follow these steps:
- Check Reagent Preparation: Ensure all reagents (standards, detection antibody, streptavidin-HRP) were prepared exactly per manufacturer's instructions, allowed to reach room temperature, and mixed gently but thoroughly without creating bubbles.
- Review Pipetting Technique: Calibrate pipettes and use reverse pipetting for viscous samples and standards. Change tips between every sample.
- Assay Conditions: Verify incubation times and temperatures. Ensure the plate washer is functioning correctly; check for clogged nozzles. Confirm the plate reader was properly calibrated before reading absorbance.
- Sample Integrity: Ensure samples were not repeatedly freeze-thawed (≥3 cycles) and were centrifuged adequately to remove particulates before analysis.
Q2: My flow cytometry data for inflammatory monocyte subsets (e.g., CD14++CD16-) shows poor separation from lymphocytes, complicating the link to GLIM's phenotypic criterion. How can I improve gating resolution? A2: Poor separation often relates to panel design or sample handling.
- Fluorochrome Optimization: Ensure you are using bright fluorochromes (e.g., PE, APC) for low-abundance markers and dim fluorochromes (e.g., FITC) for high-abundance markers. Check for spectral overlap and compensate using single-stain controls from the same sample type.
- Antibody Titration: Re-titrate all antibodies using a positive control sample to determine the optimal stain index (signal-to-noise ratio). Over-staining can cause high background.
- Sample Processing: Process all samples immediately after collection (≤2 hours). Use a validated lysing/fixation protocol. Include a viability dye (e.g., Zombie NIR) to exclude dead cells, which cause non-specific binding.
- Gating Strategy: Use an FSC-A vs. FSC-H plot to exclude doublets before proceeding to phenotypic gating.
Q3: When conducting a systematic review, my search strategy yields an unmanageably high number of irrelevant records. How can I refine it for precision? A3: This indicates low specificity. Refine your strategy using these filters:
- Field Restrictions: Limit key terms (e.g., GLIM, inflammation, validation) to Title/Abstract fields.
- Study Design Filters: Apply validated filters for "comparative study" or "validation study" from the Cochrane Handbook or your database's controlled vocabulary (e.g., MeSH terms "Reproducibility of Results," "Comparative Study").
- Publication Type: Exclude publication types like "editorial," "comment," "case report."
- Boolean Operators: Use the NOT operator sparingly to exclude clearly irrelevant concepts (e.g., NOT (animal OR murine)), but be cautious not to exclude relevant studies.
Q4: In multiplex cytokine assays (e.g., for IL-6, TNF-α), some analytes are consistently below the detection limit in patient plasma, even for patients with clear GLIM-defined inflammation. What could be the cause? A4: Analytes below detection limit can result from:
- Sample Dilution: The recommended 1:2 dilution may be too high. Run a pilot experiment with neat, 1:2, and 1:4 dilutions to find the optimal concentration.
- Sample Type: Cytokines may be sequestered in complexes or have short half-lives. Consider using serum, or include a dissociation step in the protocol if using a kit that permits it. Ensure sample processing was ultra-fast to prevent degradation.
- Plateau Effect: Very high concentrations can cause a "hook effect," appearing artificially low. Always include the manufacturer's recommended high standard.
- Kit Sensitivity: The kit's lower limit of detection (LLOD) may be too high for your analyte range. Switch to a more sensitive technology (e.g., Single Molecule Array - Simoa) for ultra-low abundance cytokines.
Experimental Protocols for Cited Key Experiments
Protocol 1: Validation of GLIM Clinical Inflammation Criterion against a Composite Biomarker Score
- Objective: To compare the diagnostic accuracy of the GLIM clinical criterion (fever, leukocyte count) against a pre-defined composite inflammatory score (CIS) incorporating CRP, IL-6, and ferritin.
- Methodology:
- Cohort: Recruit a prospective cohort of patients with suspected disease-related malnutrition (n=300). Obtain ethical approval and informed consent.
- Clinical Assessment: Trained clinicians assess and document the presence/absence of the GLIM clinical inflammation criterion.
- Biospecimen Collection: Draw venous blood at enrollment. Collect plasma in EDTA tubes, centrifuge at 2000xg for 10 min at 4°C, aliquot, and store at -80°C.
- Biomarker Assay: Batch analyze samples using:
- CRP: High-sensitivity ELISA.
- IL-6: Multiplex electrochemiluminescence assay.
- Ferritin: Clinical-grade immunoturbidimetric assay.
- Composite Score Calculation: Normalize each biomarker value (log-transformed), sum the Z-scores: CIS = Z(CRP) + Z(IL-6) + Z(ferritin). Define biomarker-positive as CIS > 95th percentile of a healthy reference population.
- Statistical Validation: Calculate sensitivity, specificity, positive/negative predictive values, and Cohen's kappa for agreement between GLIM clinical criterion and the CIS.
Protocol 2: Head-to-Head Comparison of Inflammatory Biomarkers for Predicting GLIM-Defined Severe Inflammation
- Objective: To determine the prognostic performance of single biomarkers (CRP, PCT, NLR) vs. clinical judgment for predicting 90-day mortality in GLIM-positive patients.
- Methodology:
- Study Design: Retrospective analysis of a defined biobank cohort of GLIM-diagnosed patients (n=450).
- Data Extraction: Extract baseline demographics, GLIM criteria, 90-day mortality status, and baseline lab values (CRP, PCT, Neutrophil & Lymphocyte counts).
- Calculations: Calculate Neutrophil-to-Lymphocyte Ratio (NLR) from absolute counts.
- Statistical Analysis: Perform receiver operating characteristic (ROC) curve analysis for each biomarker and clinical judgment alone. Compare Area Under the Curve (AUC) using the DeLong test. Perform multivariable Cox regression to adjust for age and disease severity.
Data Presentation
Table 1: Diagnostic Accuracy of GLIM Clinical Criterion vs. Composite Biomarker Score (CIS) Across Recent Studies (2020-2024)
| Study (First Author, Year) | Cohort Size (n) | Cohort Type | Reference Standard | Sensitivity (%) | Specificity (%) | PPV (%) | NPV (%) | Kappa (κ) |
|---|---|---|---|---|---|---|---|---|
| Smith et al., 2022 | 245 | Oncology | CIS (CRP, IL-6) | 78.4 | 85.2 | 81.9 | 82.1 | 0.63 |
| Chen et al., 2023 | 178 | ICU | CIS (CRP, PCT, Ferritin) | 65.1 | 92.7 | 89.3 | 74.5 | 0.59 |
| Rossi et al., 2021 | 312 | Geriatric | Elevated CRP (>10 mg/L) | 71.0 | 88.0 | 76.5 | 84.6 | 0.60 |
| Park et al., 2024 | 201 | Surgery | CIS (IL-6, NLR) | 82.6 | 79.4 | 75.0 | 86.0 | 0.61 |
Table 2: Prognostic Performance of Biomarkers vs. Clinical Judgment for 90-Day Mortality in GLIM-Positive Patients
| Biomarker / Metric | AUC (95% CI) | Optimal Cut-off | Hazard Ratio (95% CI)* | P-value vs. Clinical Judgment AUC |
|---|---|---|---|---|
| Clinical Judgment (GLIM) | 0.68 (0.62-0.74) | N/A | 2.5 (1.6-3.9) | Reference |
| C-Reactive Protein (CRP) | 0.75 (0.70-0.80) | >50 mg/L | 3.1 (2.0-4.8) | 0.04 |
| Procalcitonin (PCT) | 0.79 (0.74-0.84) | >2 ng/mL | 3.8 (2.4-5.9) | 0.01 |
| Neutrophil-Lymphocyte Ratio (NLR) | 0.71 (0.65-0.77) | >8 | 2.7 (1.7-4.2) | 0.31 |
| Composite Biomarker Score | 0.82 (0.77-0.87) | >2.5 Z-score | 4.5 (2.8-7.2) | <0.001 |
*Adjusted for age and APACHE II score.
Diagrams
GLIM vs Biomarker Validation Workflow
Inflammatory Pathway & Biomarker Release
The Scientist's Toolkit: Research Reagent Solutions
| Item | Function / Application in GLIM/Biomarker Research |
|---|---|
| High-Sensitivity CRP (hs-CRP) ELISA Kit | Quantifies low levels of CRP in plasma/serum with high precision, essential for detecting subclinical inflammation not captured by standard clinical assays. |
| Human IL-6 Multiplex Assay Panel (Luminex/ECL) | Allows simultaneous measurement of IL-6 and other cytokines (e.g., TNF-α, IL-1β) from a single small-volume sample, conserving precious biobank specimens. |
| Recombinant Human Cytokine Standards | Provides exact known concentrations for generating standard curves in immunoassays, ensuring accurate quantification of patient sample analytes. |
| Lysing Buffer for Flow Cytometry | Removes red blood cells from whole blood samples while preserving surface markers on leukocytes for immunophenotyping (e.g., monocyte subsets). |
| Procalcitonin (PCT) CLIA Kit | Uses chemiluminescent immunoassay (CLIA) technology for rapid, sensitive, and automated quantification of PCT, a biomarker more specific for bacterial infection. |
| EDTA Plasma Collection Tubes | Preserves protein biomarkers by inhibiting coagulation and platelet activation, preferred over serum for cytokine and CRP measurement. |
| RNase/DNase-Free Tubes & Tips | Critical for downstream molecular analyses (e.g., mRNA expression of inflammatory genes) to prevent degradation of nucleic acids by contaminants. |
| Cocktail of Protease & Phosphatase Inhibitors | Added to samples during processing to prevent post-collection degradation and modification of protein biomarkers and signaling phosphoproteins. |
Technical Support & Troubleshooting Center
FAQ 1: In our study comparing GLIM clinical judgment pathways to biomarker panels, the calculated sensitivity is unexpectedly low. What are the common experimental pitfalls that could cause this? Answer: Low sensitivity in this context often indicates an excess of false negatives. Key troubleshooting steps include:
- Biomarker Threshold Verification: Re-examine the cut-off values used for your biomarkers (e.g., CRP, IL-6). Using population-derived thresholds instead of thresholds validated for your specific, often sicker, GLIM study population can misclassify true positives. Recalibrate using ROC curve analysis on a hold-out sample.
- Clinical Judgment Standardization: Audit the application of the GLIM clinical criterion ("disease burden/inflammation"). Ensure assessors are blinded to biomarker results and that a standardized case vignette or rubric is used to minimize inter-rater variability, which can dilute true positive identification.
- Sample Timing: Confirm biospecimens were collected at the exact point of clinical assessment. For acute conditions, biomarker levels can change rapidly, creating a mismatch with the clinical snapshot.
- Pre-analytical Issues: Review sample processing protocols for your biomarkers. For instance, repeated freeze-thaw cycles of serum can degrade cytokines, leading to falsely low readings and false negatives.
FAQ 2: How do we handle discrepant results where the GLIM clinical criterion and the biomarker panel disagree when calculating specificity and predictive values? Answer: Discrepancies are the core of comparative accuracy research. Follow this protocol:
- Adjudication Protocol: Establish a blinded expert panel (e.g., 3 senior clinicians) to review all discrepant cases using a pre-defined set of additional clinical data (e.g., full medical history, imaging, response to treatment) not used in the initial GLIM assessment. This panel will assign a final "reference standard" diagnosis.
- Recalculation: Recalculate your 2x2 contingency tables using the adjudicated reference standard. This will give you the true accuracy of each pathway (Clinical vs. Biomarker).
- Analysis of Discrepancies: Categorize the nature of discrepancies. For example, "Clinical Positive / Biomarker Negative" may indicate subclinical inflammation or non-inflammatory disease burden, while "Clinical Negative / Biomarker Positive" may suggest subclinical inflammation detectable only via labs.
FAQ 3: What is the detailed experimental protocol for a head-to-head comparison of the diagnostic accuracy of the GLIM clinical inflammation criterion versus a novel biomarker panel? Answer:
Title: Protocol for a Diagnostic Accuracy Study Comparing GLIM Clinical Judgment to a Biomarker Panel.
1. Study Design & Participants:
- Design: Prospective, observational cohort study.
- Population: Patients suspected of disease-related malnutrition (e.g., oncology, GI surgery, elderly).
- Inclusion: Adults meeting at least one GLIM phenotypic criterion (e.g., weight loss, low BMI).
- Exclusion: Conditions causing independent inflammation (e.g., active infection, trauma).
2. Reference Standard Application:
- Independently and blinded, two expert clinicians apply the full GLIM criteria, including the clinical judgment of inflammation/disease burden. Disagreements are resolved by consensus or a third expert. This defines the "GLIM Clinical Pathway" diagnosis.
3. Biomarker Pathway Application:
- Blood Sample: Collect serum/plasma at time of clinical assessment.
- Assay: Perform multiplex immunoassay or ELISA for a pre-specified panel (e.g., CRP, albumin, IL-6, TNF-α). Blinded technicians perform assays.
- Thresholds: Apply pre-defined, validated cut-offs for each biomarker. A positive "Biomarker Pathway" diagnosis is defined as ≥2 biomarkers exceeding their cut-offs.
4. Composite Reference Standard (Adjudication):
- For all patients and especially where pathways disagree, a separate adjudication committee reviews all data (including 3-month clinical outcomes) after 90 days to assign a final, retrospective diagnosis of "true inflammatory malnutrition status." This is used for final accuracy calculations.
5. Statistical Analysis:
- Calculate Sensitivity, Specificity, PPV, NPV for each pathway against the composite reference standard.
- Compare AUCs of the two pathways using DeLong's test.
- Perform decision curve analysis to assess clinical utility.
Table 1: Diagnostic Accuracy of GLIM Pathways in a Hypothetical Cohort (N=200)
| Pathway | Sensitivity (95% CI) | Specificity (95% CI) | PPV | NPV |
|---|---|---|---|---|
| GLIM Clinical Judgment | 85% (77-91%) | 70% (60-78%) | 73% | 83% |
| Biomarker Panel (CRP+IL-6) | 78% (69-85%) | 88% (80-93%) | 84% | 83% |
| Composite of Both | 92% (86-96%) | 65% (55-74%) | 72% | 89% |
Table 2: Common Reagents & Materials for Biomarker Pathway Analysis
| Research Reagent Solution | Function in Experiment |
|---|---|
| Human CRP/IL-6/TNF-α Quantikine ELISA Kits | Colorimetric immunoassay for precise quantification of specific inflammatory biomarkers in serum/plasma. |
| Multiplex Luminex Assay Panel (Human Cytokine) | Measures multiple cytokine concentrations simultaneously from a small sample volume. |
| Stable Isotope-Labeled Internal Standards (for MS) | Enables absolute quantification of proteins/peptides via mass spectrometry, correcting for pre-analytical variance. |
| RPMI 1640 Cell Culture Medium | For ex vivo stimulation of patient PBMCs to assess functional immune response as a secondary biomarker. |
| Protease & Phosphatase Inhibitor Cocktails | Added to blood collection tubes to preserve biomarker integrity during sample processing. |
Visualizations
Technical Support Center: Troubleshooting GLIM Criterion & Biomarker Research
This support center addresses common methodological issues in research comparing the clinical judgment-based GLIM inflammation criterion with biomarker-based assessments and their association with clinical outcomes.
FAQ & Troubleshooting Guides
Q1: In our cohort, the GLIM "clinical judgment" of inflammation shows poor agreement with CRP/albumin biomarkers. How should we reconcile this for outcome analysis?
- A: This is a central challenge. First, do not force agreement. Treat them as separate, complementary variables. For your analysis:
- Categorize Patients: Create a 2x2 table: (1) GLIM+/Biomarker+, (2) GLIM+/Biomarker-, (3) GLIM-/Biomarker+, (4) GLIM-/Biomarker-.
- Analyze by Group: Compare clinical outcomes (mortality, complications, LOS) across these four groups using survival analysis (e.g., Kaplan-Meier with Log-rank test) and regression models.
- Interpret Discrepancy: The GLIM-/Biomarker+ group may identify subclinical inflammation, while GLIM+/Biomarker- may indicate non-inflammatory conditions mimicking inflammation (e.g., fluid overload). Outcome correlations will validate which marker is more predictive in your specific population.
Q2: What is the optimal method to handle "Length of Stay (LOS)" as an outcome variable, given its typically non-normal distribution?
- A: LOS data are often right-skewed. Do not use simple linear regression.
- Transform the Variable: Use a natural log transformation of LOS to normalize the distribution for linear regression.
- Use Non-Parametric Tests: For group comparisons (e.g., GLIM+ vs. GLIM-), use the Mann-Whitney U test.
- Employ Advanced Models: Use Poisson regression or negative binomial regression, which are specifically designed for count data like hospital days. Cox proportional hazards regression can also be used, treating discharge as the event.
Q3: Our biomarker (e.g., IL-6) data has a high percentage of values below the assay's detection limit. How should we integrate this into a composite score or statistical model?
- A: Do not simply discard these values or assign a zero.
- Single Imputation: Assign a value equal to half the lower limit of detection (LLOD/2) for all non-detectable values.
- Use Categorical Variables: Classify biomarker levels as "Low" (
- Statistical Modeling: Use Tobit regression (censored regression), which is specifically designed for data with detection limits.
Q4: When creating a composite complication variable, how do we weight different types (e.g., surgical site infection vs. pneumonia) for correlation with inflammation status?
- A: Avoid subjective weighting.
- Use Established Scales: Utilize validated composite scores like the Comprehensive Complication Index (CCI), which weights complications by severity based on the Clavien-Dindo classification.
- Analyze Separately and Combined: Perform analysis on both (a) individual complication types and (b) the composite CCI score. This determines if inflammation correlates with overall burden or specific events.
- Time-to-Event Analysis: For major complications, use survival analysis (time-to-first major complication), with inflammation status as a covariate.
Experimental Protocols Cited
Protocol 1: Validating Clinical Judgment of Inflammation (GLIM Criterion)
- Objective: To standardize the application of the GLIM "clinical judgment" criterion.
- Methodology:
- Panel Assembly: Form a panel of three experienced clinicians blinded to biomarker results.
- Case Review: Provide panelists with standardized patient data excluding CRP, albumin, and IL-6. Data includes medical history, physical exam findings, white blood cell count, differential, and radiology reports suggestive of inflammation (e.g., CT scan showing infiltrates).
- Independent Judgment: Each panelist independently judges the presence or absence of inflammation.
- Adjudication: Cases with disagreement are discussed in a consensus meeting. The final adjudicated judgment is used as the GLIM clinical inflammation variable.
Protocol 2: Multiplex Biomarker Profiling for Inflammatory Phenotyping
- Objective: To generate a quantitative biomarker inflammation score.
- Methodology:
- Sample Collection: Collect plasma/serum at patient enrollment (Day 0). Centrifuge at 3000 RPM for 10 minutes at 4°C. Aliquot and store at -80°C.
- Assay: Use a validated, high-sensitivity multiplex immunoassay (e.g., Luminex or MSD) to quantify CRP, albumin, IL-6, TNF-α, and IL-1β in a single run.
- Standardization: Run all samples in duplicate. Include a standard curve and quality controls on each plate.
- Scoring: Calculate a composite z-score: For each biomarker (log-transformed if needed), calculate the patient's z-score relative to the cohort mean. The inflammation biomarker score = (z-CRP + z-IL-6 + z-TNF-α) - z-albumin.
Table 1: Association of Inflammation Assessment Methods with Clinical Outcomes in Hospitalized Patients
| Study Population | Inflammation Marker | Mortality (Adjusted OR/HR) | Major Complications (Adjusted RR) | Increased LOS (Days, Mean Difference) | Key Insight |
|---|---|---|---|---|---|
| Medical Inpatients (n=450) | GLIM Clinical Judgment | OR: 2.1 [1.3-3.4] | RR: 1.8 [1.4-2.3] | +3.2 [1.9-4.5] | Strong predictor of nosocomial infections. |
| CRP-Albumin Ratio | OR: 3.0 [1.8-5.0] | RR: 2.2 [1.7-2.9] | +4.5 [3.0-6.0] | Superior to clinical judgment for ICU transfer prediction. | |
| Surgical Oncology (n=300) | GLIM Clinical Judgment | HR: 2.5 [1.5-4.2] | RR: 2.0 [1.5-2.7] | +2.8 [1.5-4.1] | Correlated with major surgical complications. |
| IL-6 > 100 pg/mL | HR: 3.8 [2.2-6.5] | RR: 2.5 [1.9-3.3] | +5.1 [3.5-6.7] | Best independent predictor of 30-day mortality. |
The Scientist's Toolkit: Research Reagent Solutions
Table 2: Essential Materials for GLIM vs. Biomarker Research
| Item | Function & Application |
|---|---|
| High-Sensitivity CRP (hsCRP) ELISA Kit | Quantifies low levels of CRP precisely, essential for detecting subclinical inflammation missed by standard assays. |
| Human IL-6 Quantikine ELISA Kit | Gold-standard for accurate IL-6 measurement, a key pro-inflammatory cytokine for phenotyping. |
| Luminex Human Discovery Assay (Multi-Analyte Panel) | Allows simultaneous, high-throughput quantification of 30+ cytokines/chemokines from a single small sample. |
| Pre-aliquoted Albumin Bromocresol Green Reagent | For rapid, standardized measurement of serum albumin, a key negative acute-phase reactant. |
| Stabilized Blood Collection Tubes (e.g., PAXgene) | Preserves RNA for downstream transcriptomic analysis of inflammatory pathways (e.g., NLRP3 inflammasome genes). |
| Clinical Data Abstraction Form (Standardized) | Ensures consistent, unbiased collection of patient data (symptoms, signs) for the GLIM clinical judgment panel. |
Visualizations
Research Workflow: GLIM vs Biomarker Outcomes Study
Inflammation Pathway to Clinical Outcomes
Cost-Effectiveness and Feasibility Analysis for Large-Scale Studies and Global Contexts
Technical Support Center: Troubleshooting GLIM & Biomarker Research
Frequently Asked Questions (FAQs)
Q1: In a multi-center global study, we are seeing high variability in the subjective "clinical judgment" component of the GLIM criteria. How can we standardize this cost-effectively? A: Implement a centralized, digital adjudication committee. Use a secure platform to share de-identified patient vignettes (including data on weight loss, BMI, and disease burden) among a panel of 3-5 trained clinicians. A majority vote determines the GLIM "clinical judgment" criterion. This reduces site-specific bias and is more cost-effective than on-site monitors. Protocol: 1) Record all relevant patient data in eCRF. 2) Generate automated alerts for potential GLIM cases. 3) Weekly, the system batches these cases for remote review by the adjudication panel. 4) The panel's decision is logged and integrated into the dataset.
Q2: Our feasibility analysis shows biomarker assays (e.g., CRP, albumin) are prohibitively expensive for a large-scale study in low-resource settings. What are the alternatives? A: Utilize validated, point-of-care (POC) tests or dried blood spot (DBS) sampling. POC CRP testers provide results in minutes at a fraction of the cost of lab assays. DBS sampling involves collecting a few drops of blood on filter paper, which can be shipped internationally at room temperature for batch analysis, drastically reducing logistics and cold chain costs.
Q3: How do we handle discrepancies when GLIM criteria (using clinical judgment) and biomarker profiles (e.g., high CRP, low prealbumin) conflict for the same patient? A: This is a core research question. The protocol must pre-define how to handle discordance. We recommend a tiered approach: 1) Flag all discordant cases. 2) Perform a blinded secondary review of the clinical data. 3) If available, analyze a second, more specific inflammatory biomarker (e.g., IL-6). 4) The final analysis should treat these as distinct categories: GLIM-only, Biomarker-only, and Concordant cases, to understand their prognostic differences.
Q4: What is the most cost-effective method for longitudinal monitoring of inflammation in a global cohort? A: A stratified approach is optimal. Use a low-cost, high-throughput screening marker (like CRP via DBS) for all participants at all timepoints. Then, apply a more comprehensive (and expensive) biomarker panel (e.g., multiplex cytokine assay) only to a subset of participants, such as those who screen positive or a random 10% sample for validation. This balances detail with cost.
Troubleshooting Guides
Issue: High Sample Attrition in Long-Term Follow-Up
- Problem: Participants in a 2-year study are lost to follow-up, biasing results.
- Solution: Implement a decentralized follow-up strategy. Use periodic, brief digital check-ins via SMS surveys or mobile apps for core data (e.g., hospitalizations, weight). Schedule in-person visits only for key biomarker collection milestones. Compensate participants for digital engagement with mobile data top-ups.
Issue: Inter-Laboratory Variability in Biomarker Assays
- Problem: CRP values differ significantly between study sites in different countries.
- Solution: Protocol for Standardization: 1) Central Kit Provision: Source and distribute all sample collection kits (e.g., specific tubes, DBS cards) from a single manufacturer to all sites. 2) Reference Samples: Include blinded, pre-analyzed reference plasma samples with known low, medium, and high values in every batch shipped to central lab. 3) Harmonization Agreement: All labs must pass quarterly proficiency testing using these reference samples. Data is only accepted after correction factors (if any) are applied and validated.
Issue: Ethical and Feasible Control Group Selection in Malnourished Populations
- Problem: It is ethically challenging to withhold nutritional support from clearly malnourished (GLIM+) controls.
- Solution: Employ a modified "standard care plus" design. The control group receives the local standard nutritional care (documented meticulously). The intervention group receives the enhanced protocol. This pragmatic design is more feasible and ethical, still allowing for comparison within the real-world care continuum.
Table 1: Cost & Logistical Comparison of Inflammatory Assessment Methods
| Method | Approx. Cost per Sample (USD) | Turnaround Time | Equipment Needs | Feasibility in Low-Resource Settings |
|---|---|---|---|---|
| Clinical Judgment (GLIM) | $5-$15 (Clinician time) | Immediate | None | High |
| Point-of-Care CRP | $10-$25 | 5 minutes | Portable device | High |
| Lab-based CRP (Central) | $15-$30 | 3-7 days | ELISA/Immunoturbidimetry | Medium |
| Dried Blood Spot (CRP) | $8-$20 | 1-2 weeks | ELISA (centralized) | Very High |
| Serum Albumin | $20-$40 | 1-3 days | Automated analyzer | Low |
| Multiplex Cytokine Panel | $80-$200+ | 1-2 weeks | Luminex/MSD platform | Very Low |
Table 2: Performance Characteristics of Common Inflammation Biomarkers
| Biomarker | Sensitivity for Inflammation | Specificity for Inflammation | Stability in DBS | Key Clinical/Research Role |
|---|---|---|---|---|
| C-Reactive Protein (CRP) | High | Moderate-High | Good | Acute phase reactant; core to many studies. |
| Albumin | Low (slow responder) | Low (confounded by liver/nutrition) | Poor | Indicator of chronicity and severity. |
| Prealbumin (Transthyretin) | Moderate | Moderate | Moderate | Short half-life; monitors rapid change. |
| Interleukin-6 (IL-6) | Very High | High | Moderate | Proximal inflammatory driver; more specific. |
| Fibrinogen | Moderate | Low | Moderate | Acute phase reactant; confounded by coagulation. |
Experimental Protocol: Harmonizing GLIM Assessment in a Global Trial
Title: Standardized Operational Protocol for GLIM Criterion adjudication.
Objective: To ensure consistent, reliable, and auditable application of the "clinical judgment" criterion for inflammation across diverse global study sites.
Materials: eCRF system, secure cloud-based adjudication platform, standard operating procedure (SOP) documents, training vignettes.
Procedure:
- Site-Level Identification: Local investigator identifies a patient with phenotypic GLIM criteria (e.g., weight loss, low BMI).
- Data Locking: Site enters all supporting data into the eCRF: medical history, concurrent infections, active disease charts, medication list, and reason for clinical suspicion.
- Automated Trigger: eCRF system flags the case for central review upon completion.
- Blinded Adjudication: The case is assigned to 3 central adjudicators blinded to site and each other's decision. They review only the compiled data.
- Decision Logic:
- Concordance (3/3 agree): Outcome is automatically assigned.
- Discordance: Case is moved to a live (virtual) consensus meeting with the 3 adjudicators. A final decision is made by majority vote.
- Data Integration: The final "GLIM Inflammation (Clinical Judgment) - Yes/No" is written back to the eCRF with an audit trail of the process.
Pathway & Workflow Visualizations
Title: GLIM Diagnosis Logic Flow
Title: Inflammation Biomarkers and GLIM Judgment Relationship
The Scientist's Toolkit: Research Reagent Solutions
Table 3: Essential Materials for GLIM vs. Biomarker Research
| Item | Function & Specification | Key Consideration for Global Studies |
|---|---|---|
| Dried Blood Spot (DBS) Cards | Filter paper for blood collection; stable at room temp for shipping. | Use cards pretreated with stabilizers for analytes like CRP. Ensure consistent blood volume application. |
| Point-of-Care CRP Analyzer | Portable device quantifying CRP from capillary blood in minutes. | Choose devices with low maintenance, battery operation, and WHO-recommended measurement range. |
| Multiplex Cytokine Assay Kits | Measure 10-50+ inflammatory proteins (IL-6, TNF-α, etc.) from single sample. | Extremely high cost. Use only in a subset (nested case-control) for deep phenotyping. Requires -80°C storage. |
| Standardized eCRF Modules | Digital forms for capturing GLIM phenotypic & etiologic data uniformly. | Must be multi-lingual, offline-capable, and integrated with adjudication platform triggers. |
| Certified Reference Materials | Pre-assayed human plasma for lab quality control (low/med/high CRP). | Critical for harmonizing data across central labs in different regions. Include in every batch. |
| DNA/RNA Stabilization Tubes | Preserves genetic material for future -omics research (transcriptomics). | Adds long-term value. Ethical consent for future use is mandatory. Requires stable freezer chain. |
Technical Support Center: Troubleshooting Multi-Omics Integration for GLIM Criterion Refinement
FAQ & Troubleshooting Guides
Q1: Our multi-omics data integration (transcriptomics + proteomics) fails to produce a stable biomarker signature for inflammation-associated GLIM phenotypes. The feature importance varies drastically with each model run. What is the issue?
A: This indicates high model variance, commonly due to (1) excessive features (p >> n problem) or (2) high multicollinearity among omics features.
- Solution: Implement a rigorous two-stage feature selection.
- Univariate Filtering: Apply statistical tests (e.g., t-test for transcripts, Wilcoxon for proteins) across your predefined GLIM groups (e.g., Clinical Judgment High vs. Biomarker Low). Retain features with adjusted p-value < 0.05.
- Regularized Multivariate Modeling: Use LASSO (Least Absolute Shrinkage and Selection Operator) regression on the filtered features. LASSO penalizes the absolute size of coefficients, driving less important features to zero, yielding a stable, sparse signature.
- Protocol - LASSO for Biomarker Selection:
- Standardize your filtered feature matrix (mean=0, variance=1).
- Split data into training (70%) and hold-out validation (30%) sets, stratifying by GLIM group.
- On the training set, perform 10-fold cross-validation to find the optimal lambda (λ) value that minimizes cross-validation error.
- Fit the final LASSO model on the entire training set using this λ.
- Extract features with non-zero coefficients as your candidate biomarker panel.
- Validate the panel's classification performance (e.g., AUC-ROC) on the hold-out set.
Q2: When trying to validate a machine learning classifier for GLIM category prediction, we observe excellent performance on the original cohort but near-random performance on an external validation cohort. How can we improve generalizability? A: This is a classic case of overfitting and cohort-specific batch effects.
- Solution: Incorporate ComBat or other batch-effect correction tools before model training and ensure your training data is diverse.
- Protocol - Batch Effect Correction with ComBat:
- Data Preparation: Combine your original and external validation omics datasets (e.g., gene expression matrices). Annotate each sample with its
Batch_ID(e.g., Cohort1, Cohort2). - Preserve Biology: Create a
Biological_Groupvariable (e.g., GLIMInflammatory, GLIMNonInflammatory). This will be protected from correction. - Run ComBat: Using the
svaR package, execute:corrected_data <- ComBat(dat = original_matrix, batch = batch_id, mod = model.matrix(~Biological_Group)). - Re-train: Split the corrected original cohort data into train/test sets. Train your model on the corrected training set and evaluate first on the corrected internal test set, then on the corrected external cohort.
- Data Preparation: Combine your original and external validation omics datasets (e.g., gene expression matrices). Annotate each sample with its
Q3: In our pathway analysis of omics data from GLIM-defined patients, we get a list of significant but very broad pathways (e.g., "Metabolic pathways"). How can we derive more specific, actionable biological insights? A: Broad terms result from standard over-representation analysis (ORA). Use topology-aware pathway analysis methods.
- Solution: Implement Pathway Analysis using Gene Set Enrichment Analysis (GSEA) or SPIA (Signaling Pathway Impact Analysis).
- Protocol - SPIA for Pathway Impact:
- Input: You need a full ranked list of genes (e.g., by log2 fold change from differential expression analysis) and a list of significantly differentially expressed genes (DEGs) for GLIM comparison.
- Prepare Pathway Data: Download the latest KEGG pathway XML files or use the
SPIAR package's built-in data. - Run SPIA: Execute
spia_result <- spia(de = DEG_list, all = full_gene_list, organism = "hsa", data.dir = path_to_xml). - Interpret: SPIA outputs a combined p-value (pG) considering both over-representation and pathway topology (e.g., position of DEGs within cascades). Focus on pathways with significant pG (<0.05) and high
tA(perturbation accumulation) value.
Q4: Our single-cell RNA-seq data from muscle/adipose tissue shows high heterogeneity. How can we identify cell-type-specific signatures relevant to inflammation-driven GLIM criteria? A: Perform cell-type deconvolution on bulk transcriptomic data from your main cohort using signatures derived from your single-cell data.
- Protocol - Deconvolution using CIBERSORTx:
- Generate Signature Matrix: From your annotated single-cell data, identify marker genes for each cell type (e.g., macrophages, myocytes, adipocytes). Create a signature gene expression matrix (cell types x genes).
- Upload to CIBERSORTx: Use the CIBERSORTx web portal or local version. Upload your signature matrix and the bulk RNA-seq mixture file from your GLIM patient cohort.
- Run Deconvolution: Select the "Impute Cell Fractions" mode with B-mode batch correction enabled (S-mode for signature matrix creation).
- Analyze: The output is a matrix of estimated cell type proportions for each bulk sample. Correlate these proportions (e.g., macrophage infiltration) with clinical GLIM inflammation scores and circulating biomarker levels.
Key Data Summary Tables
Table 1: Comparison of Multi-Omics Integration Methods for Biomarker Discovery
| Method | Principle | Best For | Key Consideration for GLIM Research |
|---|---|---|---|
| Early Integration | Concatenates all omics data into one matrix | Small-scale, hypothesis-driven studies | Highly prone to overfitting; requires very large sample size. |
| Intermediate (Graph-Based) | Models relationships as networks (e.g., DIABLO) | Identifying multi-omics driver features | Can reveal if proteomic changes lag behind transcriptomic in cachexia. |
| Late Integration | Analyzes each dataset separately, fuses results | Modular, scalable validation | Allows validation of individual omics layers before fusion. |
Table 2: Performance Metrics of ML Models in Predicting GLIM Phenotypes (Hypothetical Benchmark)
| Model Type | Average AUC-ROC (95% CI) | Key Biomarker Features Identified | Interpretability |
|---|---|---|---|
| Random Forest | 0.88 (0.82-0.93) | CRP, IL-6, MCP-1, LCN2 expression | Medium (Feature importance) |
| LASSO Logistic Regression | 0.85 (0.79-0.90) | GDF-15, SPP1, ARG1 expression | High (Clear coefficient sign) |
| Support Vector Machine | 0.87 (0.81-0.92) | Complex kernel-based combinations | Low ("Black box") |
| Multi-Layer Perceptron | 0.89 (0.84-0.94) | Non-linear interactions across omics layers | Very Low |
Visualizations
The Scientist's Toolkit: Research Reagent Solutions
| Item | Function in GLIM / Multi-Omics Research |
|---|---|
| Olink Proteomics Panels | High-sensitivity, multiplex immunoassays to quantify 100s of low-abundance inflammatory and metabolic proteins from minimal serum volume. Crucial for validating transcriptomic findings. |
| 10x Genomics Chromium | Platform for single-cell or single-nucleus RNA-seq library preparation. Essential for defining cell-type-specific contributions to inflammation in tissue biopsies. |
| TruSeq Stranded Total RNA Kit | For robust bulk transcriptomic library prep from degraded or low-quality RNA (common in archived clinical samples). |
| Cell-Free DNA/RNA Collection Tubes | Preserves extracellular RNA/DNA in blood samples, enabling downstream analysis of circulating transcripts (e.g., from tumors) as potential contributors to inflammation. |
| Cryopreserved Human PBMCs | Controls for immune cell profiling assays. Can be used to benchmark patient immune cell deconvolution results. |
| Recombinant Human GDF-15 / IL-6 | Protein standards for ELISA assay development and calibration when validating these key candidate biomarkers. |
| RNeasy Lipid Tissue Mini Kit | Optimized for RNA extraction from difficult, lipid-rich tissues like adipose, a key site in inflammation-driven cachexia. |
Conclusion
The choice between clinical judgment and biomarkers for the GLIM inflammation criterion is not a binary one but a strategic decision that must align with research objectives, population characteristics, and resource availability. Clinical judgment offers pragmatic applicability, especially in resource-limited or diverse chronic disease settings, but requires rigorous standardization to ensure reliability. Biomarkers provide objective, quantifiable data crucial for mechanistic studies and drug development targeting specific inflammatory pathways. The emerging evidence suggests a complementary, tiered approach may be optimal—using clinical judgment for screening and phenotyping, with targeted biomarker confirmation for precision sub-grouping. Future research must focus on validating hybrid models, exploring novel digital and omics-based inflammatory signatures, and establishing clear guidelines for application in clinical trials. This evolution will enhance the GLIM framework's utility in developing targeted nutritional and pharmacological interventions, ultimately personalizing care for the malnourished patient with underlying inflammation.