Harnessing GLuc and RLuc Multiplexing: Advanced Bioluminescent Imaging for Inflammatory Disease Research and Drug Discovery
This comprehensive guide explores the dual-luciferase reporter system combining Gaussian luciferase (GLuc) and Renilla luciferase (RLuc) for multiplexed, longitudinal monitoring of inflammatory disease models.
Harnessing GLuc and RLuc Multiplexing: Advanced Bioluminescent Imaging for Inflammatory Disease Research and Drug Discovery
Abstract
This comprehensive guide explores the dual-luciferase reporter system combining Gaussian luciferase (GLuc) and Renilla luciferase (RLuc) for multiplexed, longitudinal monitoring of inflammatory disease models. Targeted at researchers and drug development professionals, it covers foundational principles, advanced methodological protocols for in vivo and in vitro applications, critical troubleshooting strategies for signal fidelity, and comparative validation against single-reporter and fluorescent systems. The article provides a roadmap for implementing this powerful multiplexing technology to simultaneously track multiple biological processes—such as specific immune cell populations, pro- and anti-inflammatory pathways, or therapeutic efficacy and toxicity—enabling deeper mechanistic insights and accelerating preclinical drug development.
GLuc and RLuc 101: Core Principles and Strategic Advantages for Inflammation Research
1. Introduction & Thesis Context Dual-reporter assays using Gaussian (GLuc) and Renilla (RLuc) luciferases have become a cornerstone for multiplexed, real-time monitoring of biological processes in live cells and animals. Within inflammatory disease models research—such as studies of cytokine storm, NF-κB signaling, or inflammasome activation—this toolkit enables the concurrent, orthogonal tracking of two distinct pathways or cellular responses. GLuc (19.9 kDa) is a secreted luciferase, allowing non-destructive sampling of conditioned media. RLuc (36 kDa) is typically intracellular, serving as a co-transfected control for normalization or reporting on a second specific pathway. Their distinct substrates (coelenterazine analogs) and physical properties facilitate precise, multiplexed quantitation, advancing drug screening and mechanistic dissection in complex disease models.
2. Key Properties & Quantitative Comparison
Table 1: Comparative Properties of Gaussian and Renilla Luciferases
| Property | Gaussian Luciferase (GLuc) | Renilla Luciferase (RLuc, from Renilla reniformis) |
|---|---|---|
| Molecular Weight | ~19.9 kDa | ~36 kDa (RLuc8 variant: ~36 kDa) |
| Secreted | Yes (naturally secreted) | No (intracellular, but secreted variants engineered) |
| Native Signal Peptide | Yes (17 aa) | No |
| Primary Substrate | Coelenterazine (CTZ) | Coelenterazine (CTZ) |
| Emission Peak (λmax) | ~480 nm | ~480 nm (RLuc8: ~490 nm) |
| Half-life (Bioluminescence) | ~5-10 minutes (rapid decay) | Prolonged signal with synthetic CTZ analogs (e.g., EnduRen, ViviRen) |
| Optimal Assay Format | Kinetic or endpoint from supernatant | Live-cell, kinetic, or endpoint (with pro-substrate) |
| Key Advantage in Multiplexing | Non-lytic, temporal sampling; low background | Bright, stable variants (RLuc8); compatible with firefly for true dual-color |
Table 2: Performance Metrics in a Typical Multiplexed Assay
| Metric | GLuc (Secreted) | RLuc8 (Intracellular) |
|---|---|---|
| Linear Range | 6-8 orders of magnitude | 6-7 orders of magnitude |
| Signal-to-Background | >1000:1 | >1000:1 |
| Sensitivity (Detection Limit) | Low attomole (10^-18 mol) range | Low attomole range |
| Compatibility with FLuc | Excellent (distinct kinetics/substrate) | Requires sequential addition (same substrate) |
| Normalization Utility | Reporter for specific pathway activation (e.g., inflammatory promoter) | Often used as transfection control or second pathway reporter |
3. Experimental Protocols
Protocol 1: Multiplexed Monitoring of NF-κB Activation and Cell Viability in a Macrophage Inflammatory Model
- Objective: To measure TNF-α-induced NF-κB-driven GLuc expression while normalizing for cell number/confluency using a constitutively expressed RLuc.
- Materials: See "The Scientist's Toolkit" below.
- Method:
- Cell Seeding & Transfection: Seed RAW 264.7 macrophages in a 96-well plate. Co-transfect with a plasmid containing GLuc under an NF-κB response element (NF-κB-RE-GLuc) and a plasmid expressing RLuc under a constitutive promoter (e.g., CMV-RLuc).
- Stimulation: 24h post-transfection, stimulate cells with TNF-α (e.g., 10 ng/mL) or vehicle control.
- GLuc Measurement (Secreted): At desired timepoints (e.g., 6, 12, 24h), collect 20 µL of conditioned media without lysing cells. Transfer to a white assay plate. Inject 50 µL of 20 µM native coelenterazine in assay buffer (e.g., PBS). Measure luminescence immediately (integration time: 0.5-1s) in a plate reader.
- RLuc Measurement (Intracellular): After media sampling, lyse cells in the original culture plate by adding 100 µL of passive lysis buffer. Agitate for 15 min. Transfer 20 µL of lysate to a new white plate. Inject 50 µL of 20 µM coelenterazine h (a proprietary, more stable analog for RLuc). Measure luminescence.
- Data Analysis: Calculate fold induction of NF-κB by dividing TNF-α-stimulated GLuc signal (Step 3) by the corresponding RLuc lysate signal (Step 4) and normalizing to the vehicle-treated control ratio.
Protocol 2: In Vivo Dual-Reporter Imaging in a Murine Inflammation Model
- Objective: To track systemic inflammation (GLuc) and a targeted cellular response (RLuc) simultaneously in a live mouse.
- Materials: See toolkit. IVIS Spectrum or equivalent imaging system.
- Method:
- Reporter Cell Preparation: Stably transduce a macrophage cell line with NF-κB-RE-GLuc and a STAT3-RE-RLuc (for a second inflammatory pathway).
- Disease Model & Cell Implantation: Induce peritonitis via LPS injection. Subsequently, inject reporter macrophages intraperitoneally.
- Substrate Administration: Image at peak inflammation (e.g., 24h). Inject coelenterazine native (for GLuc) intraperitoneally (150 µg/mouse). Image immediately (1-min acquisition, 480 nm filter). After 2h (for GLuc signal decay), inject coelenterazine h (for RLuc) intravenously (75 µg/mouse) and image again.
- Image Analysis: Use region-of-interest (ROI) analysis to quantify total flux (photons/sec) for each signal from the peritoneal cavity. Normalize the inducible GLuc signal to the RLuc signal to account for cell localization differences.
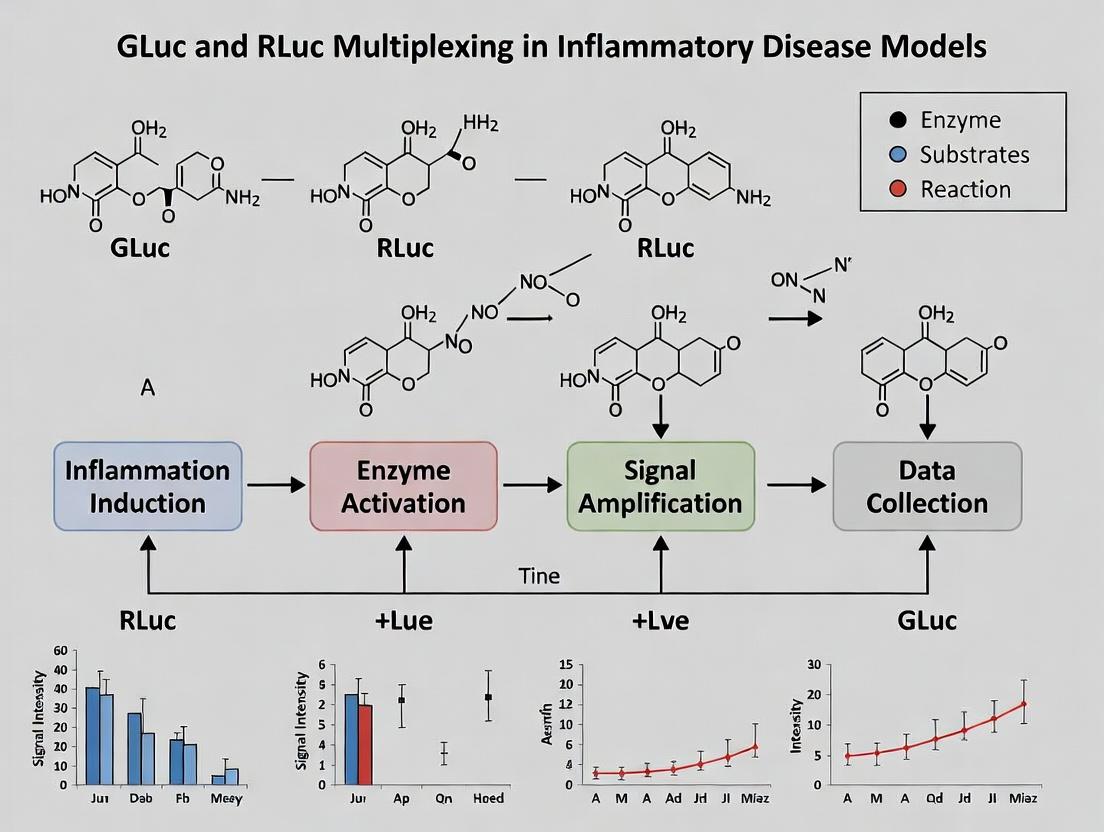
4. Visualizing Pathways and Workflows
Diagram Title: GLuc & RLuc Multiplexed Signaling Pathway
Diagram Title: Live-Cell GLuc/RLuc Assay Workflow
5. The Scientist's Toolkit: Research Reagent Solutions
Table 3: Essential Materials for GLuc/RLuc Multiplexing
| Reagent/Material | Function & Brief Explanation | Example Product/Catalog |
|---|---|---|
| GLuc Reporter Vector | Plasmid encoding Gaussian luciferase under a minimal or inducible promoter (e.g., NF-κB-RE). Drives expression of the secreted reporter. | pGL4.50[luc2/CMV/Hygro] (modified with GLuc) |
| RLuc Reporter Vector | Plasmid encoding Renilla luciferase (often RLuc8 variant) under a constitutive (e.g., CMV, SV40) or inducible promoter. Serves as control or second reporter. | pGL4.74[hRluc/TK] or pRL-CMV |
| Native Coelenterazine (CTZ) | The native substrate for both GLuc and RLuc. Used for immediate, kinetic assays, especially for secreted GLuc. Short half-life. | NanoLight #301, GoldBio #CZ1 |
| Coelenterazine h | A synthetic, proprietary CTZ analog with enhanced stability and signal for RLuc. Preferred for intracellular RLuc assays post-lysis. | Pierce #16150, GoldBio #CZ3 |
| ViviRen/EnduRen Live Cell Substrate | Cell-permeable, pro-substrate forms of CTZ for RLuc. Converted to active CTZ intracellularly, enabling live-cell kinetic RLuc monitoring without lysis. | Promega #E6481, Promega #E648A |
| Dual-Luciferase/Passive Lysis Buffer | Buffers designed for complete cell lysis and compatibility with sequential luciferase assays. Essential for intracellular RLuc measurement post-GLuc sampling. | Promega #E1910, E1531 |
| Luminometer/IVIS Imager | Instrumentation capable of detecting low-light luminescence with injectors for kinetic reads. Required for sensitive, quantitative assays. | PerkinElmer EnVision/IVIS, Berthold Centro XS3 |
| Inflammatory Stimuli | Agents to induce the disease-model pathway (e.g., TNF-α, IL-1β, LPS). Validates the inducible reporter system. | R&D Systems, PeproTech |
| Appropriate Cell Line | Disease-relevant, transfectable cells (e.g., RAW 264.7, THP-1, primary macrophages). Basis for the inflammatory model. | ATCC |
Introduction Complex inflammatory diseases, such as rheumatoid arthritis, inflammatory bowel disease, and psoriasis, are driven by dysregulated, interacting signaling pathways. Focusing on a single biomarker provides a myopic view, often leading to incomplete mechanistic understanding and therapeutic failure. This application note, framed within our thesis on Gaussian (GLuc) and Renilla (RLuc) luciferase multiplexing, argues for the simultaneous, real-time tracking of multiple inflammatory pathways in vivo. We present data, protocols, and tools to implement this multiplexed approach, enabling more predictive disease modeling and drug evaluation.
The Case for Multiplexing: Correlated Pathway Dynamics Data from a recent study using dual-luciferase reporter mice (NF-κB-GLuc / AP-1-RLuc) in a collagen-induced arthritis (CIA) model demonstrates the non-redundant and temporally distinct activation of key pathways. Tracking both pathways revealed critical information missed by single-reporter systems.
Table 1: Pathway Activation Dynamics in CIA Model (Mean Luminescence ± SEM)
| Day Post-Induction | NF-κB Activity (GLuc, p/s/cm²/sr) | AP-1 Activity (RLuc, p/s/cm²/sr) | Therapeutic Intervention (Anti-TNFα) |
|---|---|---|---|
| 0 (Baseline) | 1.2e4 ± 0.3e4 | 0.8e4 ± 0.2e4 | - |
| 7 (Early) | 8.5e4 ± 1.1e4 | 3.2e4 ± 0.7e4 | No effect on AP-1 |
| 14 (Peak Clinical) | 2.1e5 ± 2.5e4 | 1.5e5 ± 1.8e4 | NF-κB reduced by 75%; AP-1 by 40% |
| 21 (Chronic) | 9.0e4 ± 1.4e4 | 1.1e5 ± 1.2e4 | AP-1 activity becomes dominant |
The data shows AP-1 activity becomes predominant in the chronic phase, suggesting a potential mechanism for anti-TNFα resistance and highlighting the need for combination therapies targeting both pathways.
Detailed Protocols
Protocol 1: In Vivo Dual-Luciferase Imaging in a Murine CIA Model Objective: To simultaneously monitor NF-κB and AP-1 pathway activation longitudinally. Materials: See "The Scientist's Toolkit" below. Procedure:
- Induction: Induce CIA in NF-κB-GLuc/AP-1-RLuc double-transgenic mice (C57BL/6 background) at Day 0 using standard bovine type II collagen/CFA protocol.
- Substrate Administration: Prior to imaging (10-15 minutes), inject mice intraperitoneally with a coelenterazine (CTZ) solution (3 mg/kg in sterile PBS) for RLuc (AP-1) activity. Image immediately for 1-5 minutes.
- RLuc Imaging: Acquire bioluminescence signal using an IVIS Spectrum or equivalent with no filter, open emission.
- GLuc Imaging: 4 hours post-CTZ injection, inject furimazine (15 mg/kg in sterile PBS) intraperitoneally. Image after 10 minutes using a 480nm emission filter.
- Data Analysis: Quantify total flux (p/s) from regions of interest (joints/paws) using Living Image or equivalent software. Normalize to baseline (Day 0) values.
- Validation: Post-imaging, harvest paw tissue for qPCR validation of canonical target genes (e.g., Il6, Tnf for NF-κB; Mmp3, Mmp9 for AP-1).
Protocol 2: Ex Vivo Spleen Cell Assay for Drug Screening Objective: To test compound efficacy on pathway-specific inhibition in immune cells. Procedure:
- Cell Isolation: Harvest splenocytes from dual-reporter mice at disease peak. Prepare a single-cell suspension.
- Stimulation & Treatment: Plate cells (1e6/well) in 96-well white plates. Pre-treat with candidate drugs (e.g., JNK inhibitor SP600125 for AP-1, IKK inhibitor BAY-11 for NF-κB) for 1 hour.
- Stimulate: Add LPS (100 ng/mL) to activate pathways.
- Dual-Luc Assay: After 6 hours, lyse cells with Passive Lysis Buffer. Transfer lysate to a new plate.
- Measurement: Use a dual-luciferase assay system. First, add RLuc substrate (coelenterazine), measure RLuc luminescence. Then, quench RLuc and activate GLuc by adding GLuc substrate (furimazine) and measure GLuc luminescence. Calculate fold-change vs. unstimulated controls.
The Scientist's Toolkit Table 2: Essential Research Reagents and Materials
| Item | Function |
|---|---|
| NF-κB-GLuc/AP-1-RLuc Mouse | Dual-reporter model for non-invasive, pathway-specific bioluminescent imaging. |
| Coelenterazine (native) | Substrate for RLuc; used for imaging AP-1 activity. Fast kinetics require immediate imaging. |
| Furimazine | Synthetic substrate for GLuc; provides sustained, bright signal for imaging NF-κB activity. |
| IVIS Spectrum Imaging System | Enables 2D bioluminescent quantification and spectral unmixing (if required). |
| Dual-Luciferase Assay Kit | For ex vivo cell-based validation and high-throughput screening on lysates. |
| Passive Lysis Buffer | Provides complete, gentle cell lysis for consistent luciferase recovery in ex vivo assays. |
Pathway and Workflow Visualizations
Title: NF-κB & AP-1 Pathways in Inflammation
Title: In Vivo Dual-Luc Imaging Workflow
Application Notes
Within the context of multiplexed bioluminescence imaging (BLI) for inflammatory disease research, the orthogonal spectral and kinetic profiles of Gaussian Luciferase (GLuc) and Renilla Luciferase (RLuc) variants present a powerful tool for concurrent tracking of multiple cellular or molecular events. The core of this multiplexing strategy lies in the distinct substrates, coelenterazine and furimazine, and their resulting non-overlapping emission spectra.
Key Advantages for Inflammatory Models:
- Dual-Cell Tracking: Simultaneously monitor immune cell infiltration (e.g., neutrophils expressing RLuc8) and endothelial or parenchymal cell response (e.g., expressing GLuc) in models of arthritis, colitis, or neuroinflammation.
- Pathway Crosstalk Analysis: Quantify activation of two distinct inflammatory signaling pathways (e.g., NF-κB vs. AP-1) in a single animal by linking each to a separate luciferase reporter.
- Therapeutic Efficacy: Use one luciferase as a reporter for disease progression and the other to monitor the biodistribution or target engagement of a therapeutic agent.
The successful implementation of this multiplexed approach requires careful consideration of the fundamental bioluminescent properties, as summarized below.
Quantitative Spectral and Kinetic Data
Table 1: Key Properties of GLuc and RLuc8 for Multiplexing
| Property | Gaussian Luciferase (GLuc) | Renilla Luciferase (RLuc8) | Multiplexing Implication |
|---|---|---|---|
| Native Substrate | Coelenterazine | Coelenterazine | Potential cross-reactivity; requires engineered substrates for true separation. |
| Optimized Substrate | Furimazine (Nanoluc substrate) | Coelenterazine-h (or Benzyl-coelenterazine) | Distinct chemistries enable sequential imaging without cross-talk. |
| Peak Emission (λmax) | ~460 nm (Blue) | ~480 nm (Blue-Green) | Significant overlap with native substrates; requires spectral unmixing. |
| Peak Emission with Optimized Substrate | ~460 nm (with Furimazine) | ~535 nm (with Coelenterazine-h) | Non-overlapping. Enables clear spectral separation with appropriate filters. |
| Half-Life (Kinetics) | Rapid flash (< 2 min) | Rapid flash (~ 4-5 min with Coelenterazine-h) | Both are flash-type kinetics. Requires rapid imaging post-injection. Substrate injection order is critical. |
| Relative Brightness | Very high with Furimazine | High with Coelenterazine-h | GLuc signal typically dominates; adjust cell numbers/expression levels for balanced signals. |
Table 2: Recommended Filter Sets for Spectral Separation
| Luciferase Pair | Substrate Used First | Recommended Emission Filter (First Image) | Substrate Used Second | Recommended Emission Filter (Second Image) |
|---|---|---|---|---|
| GLuc (Furimazine) + RLuc8 (Coelenterazine-h) | Furimazine | 460/50 nm (Blue) | Coelenterazine-h | 540/50 nm (Green) |
| RLuc8 (Coelenterazine-h) + GLuc (Furimazine) | Coelenterazine-h | 540/50 nm (Green) | Furimazine | 460/50 nm (Blue) |
Experimental Protocols
Protocol 1: Sequential In Vivo Imaging of GLuc and RLuc8 in a Murine Inflammation Model
Objective: To simultaneously quantify macrophage recruitment (RLuc8-tagged) and vascular activation (GLuc-tagged) in a lipopolysaccharide (LPS)-induced paw inflammation model.
Materials & Reagents:
- Mice with GLuc expression under an endothelial-specific promoter (e.g., Tie2-GLuc).
- RLuc8-expressing macrophage cell line.
- LPS solution (1 mg/mL in PBS).
- Furimazine (Nano-Glo Injectible Substrate).
- Coelenterazine-h (CLZ-h), synthetic.
- In vivo imaging system (IVIS) with spectral filters.
- Isoflurane anesthesia system.
Procedure:
- Induction of Inflammation: Anesthetize Tie2-GLuc mouse. Inject 10 µL of LPS solution into the right hind paw. Inject PBS into the left paw as a control.
- Cell Injection: Immediately after LPS, inject 1x10^6 RLuc8-expressing macrophages intravenously via the tail vein.
- First Imaging Sequence (RLuc8):
- At 4 hours post-induction, anesthetize the mouse and place it in the IVIS chamber.
- Inject Coelenterazine-h intraperitoneally (i.p.) at 4 mg/kg in 100 µL.
- Acquire a sequence of images (1 min exposures) for 5 minutes starting 1 minute post-injection using the 540 nm filter.
- Quantify the photon flux in the paw region of interest (ROI).
- Second Imaging Sequence (GLuc):
- Allow a 2-hour washout period for the coelenterazine-h signal to fully decay.
- Inject Furimazine i.p. at the manufacturer's recommended dose (e.g., 100 µL of diluted substrate).
- Acquire images immediately (1 min exposures) for 2 minutes using the 460 nm filter.
- Quantify the photon flux in the same paw ROI.
- Data Analysis: Correlate the RLuc8 signal (macrophage recruitment) with the GLuc signal (endothelial activation) for each animal.
Protocol 2: Cell-Based Assay for Inflammatory Pathway Crosstalk
Objective: To monitor NF-κB and STAT3 pathway activation in a single cell population using dual-luciferase reporters.
Materials & Reagents:
- HEK-293 or relevant immune cells (e.g., RAW 264.7).
- Plasmid 1: NF-κB response element driving RLuc8 expression.
- Plasmid 2: STAT3 response element driving GLuc expression.
- FuGENE HD or similar transfection reagent.
- Inflammatory cytokine: e.g., IL-6 (activates both NF-κB & STAT3).
- Furimazine-based assay buffer (from Nano-Glo Dual-Luciferase kit).
- Coelenterazine-h assay buffer.
Procedure:
- Transfection: Co-transfect cells with the NF-κB-RLuc8 and STAT3-GLuc reporter plasmids using standard protocols.
- Stimulation: 24 hours post-transfection, stimulate cells with IL-6 (e.g., 50 ng/mL) or vehicle control for 6-12 hours.
- Sequential Lysate Measurement:
- Lyse cells in a compatible passive lysis buffer.
- Transfer lysate to a white-walled plate.
- Step A (GLuc Measurement): Add an equal volume of Furimazine working solution. Measure luminescence immediately in a plate reader (integration 0.1-1 sec). This is the STAT3 pathway readout.
- Step B (RLuc8 Measurement): After recording the GLuc signal, immediately inject Coelenterazine-h working solution directly into the well (final ~5 µM). Measure luminescence immediately. This is the NF-κB pathway readout.
- Normalization: Normalize each luminescence value to total protein concentration. Calculate fold induction over unstimulated controls.
Visualization
Diagram 1: Multiplexed BLI Workflow for Inflammatory Signaling
Diagram 2: Substrate-Spectra Relationship for Multiplexing
The Scientist's Toolkit: Research Reagent Solutions
Table 3: Essential Materials for GLuc/RLuc8 Multiplexing in Inflammation Research
| Reagent / Material | Function & Role in Multiplexing | Example Product / Note |
|---|---|---|
| Furimazine | The proprietary, high-sensitivity substrate for GLuc (and NanoLuc). Provides the first spectrally distinct signal in the pair. | Nano-Glo Vivazine (in vivo) or Nano-Glo Assay Buffer (in vitro). |
| Coelenterazine-h (Benzyl-coelenterazine) | Engineered coelenterazine analog with a red-shifted emission for RLuc. Provides the second spectrally distinct signal. | Synthetic, available from several biotech suppliers (e.g., GoldBio, Nanolight). Critical for separating from GLuc signal. |
| Dual-Luciferase Co-Expression Vectors | Plasmids allowing stable or transient expression of both GLuc and RLuc8 reporters, often with different selection markers. | Custom constructs with minimal promoter interference are ideal. |
| Spectral Imaging System | An in vivo imager (IVIS) or plate reader capable of sequential image acquisition with narrow bandpass emission filters. | PerkinElmer IVIS Spectrum, Berthold NightSHADE. Must have 460/50 nm and 540/50 nm filters. |
| Passive Lysis Buffer (Compatible) | A single lysis buffer that efficiently extracts both GLuc and RLuc8 without inhibiting their activity, enabling sequential assay from one well. | Commercial dual-luciferase compatible buffers, or homemade Tris-based buffers with mild detergent. |
| Inflammatory Disease Model Reagents | Agents to induce specific, quantifiable inflammation relevant to the study (e.g., LPS, TNF-α, CAR-T cells, anti-collagen antibodies). | Ensures the bioluminescent readout is grounded in a physiologically relevant context. |
Within the broader thesis on Gaussian Luciferase (GLuc) and Renilla Luciferase (RLuc) multiplexing for real-time, longitudinal monitoring of inflammatory processes, selecting the appropriate preclinical disease model is paramount. This article provides detailed application notes and protocols for implementing bioluminescence reporter systems in four key inflammatory conditions: Rheumatoid Arthritis (RA), Inflammatory Bowel Disease (IBD), Neuroinflammation, and Sepsis. The focus is on integrating secreted GLuc (for systemic cytokine detection) and intracellular RLuc (for specific cell population tracking) to deconvolute complex inflammatory pathways in vivo.
Rheumatoid Arthritis (RA) Models
Application Note: RA models are utilized to study synovitis, pannus formation, cartilage destruction, and bone erosion. GLuc/RLuc multiplexing allows for the simultaneous tracking of systemic pro-inflammatory cytokine release (e.g., TNF-α, IL-6 via GLuc reporters) and the spatial localization of specific immune cell infiltration (e.g., macrophages or neutrophils expressing RLuc) into joints.
Key Experimental Protocol: Collagen-Induced Arthritis (CIA) with Bioluminescence Readouts
Objective: To induce RA-like pathology and monitor disease progression longitudinally using multiplexed bioluminescence.
Materials:
- Animals: DBA/1J mice (8-10 weeks old).
- Induction: Bovine Type II Collagen (CII) emulsified in Complete Freund's Adjuvant (CFA).
- Reporters: GLuc reporter under an NF-κB response element (NF-κB-RE-GLuc) for systemic inflammation. RLuc expressed under a macrophage-specific promoter (e.g., Csf1r promoter) for cell tracking.
- Substrates: Coelenterazine (native, for RLuc) and coelenterazine-h (for GLuc in blood/plasma assays).
Methodology:
- Day 0 (Immunization): Intradermally inject 100 µg of CII/CFA emulsion at the base of the tail.
- Day 21 (Booster): Administer a secondary immunization with CII in Incomplete Freund's Adjuvant (IFA).
- Reporter Implementation:
- Systemic GLuc: Inject NF-κB-RE-GLuc lentivirus intravenously on Day 20. Monitor serum GLuc activity via blood sampling (5 µL) every 3-4 days post-booster.
- Cellular RLuc: Adoptively transfer bone-marrow-derived macrophages transduced with Csf1r-RLuc on Day 24.
- Imaging: Beginning Day 25, image RLuc activity (IV injection of coelenterazine, 3 mg/kg) using an IVIS system. Regions of Interest (ROIs) are drawn around paws and knees.
- Clinical Scoring: Perform daily clinical scoring of paw swelling (0-4 per limb) in parallel.
- Terminal Analysis: On Day 40, harvest joints for histology (H&E, Safranin-O) and correlate with peak bioluminescence signals.
Table 1: Typical Data Output from CIA GLuc/RLuc Multiplexing Experiment
| Day Post-Booster | Mean Clinical Score (0-16) | Mean Serum GLuc (RLU/sec) | Mean Paw RLuc Signal (p/s/cm²/sr) | Histology Score (0-5) |
|---|---|---|---|---|
| 25 | 2.1 ± 0.5 | 5.2e4 ± 1.1e4 | 3.5e5 ± 8.2e4 | N/A |
| 32 | 8.5 ± 1.2 | 2.8e5 ± 4.5e4 | 1.2e7 ± 2.1e6 | N/A |
| 40 | 12.3 ± 1.8 | 1.9e5 ± 3.2e4 | 8.4e6 ± 1.5e6 | 3.8 ± 0.4 |
RA Model GLuc/RLuc Multiplexing Workflow
Inflammatory Bowel Disease (IBD) Models
Application Note: IBD models replicate chronic, relapsing intestinal inflammation. Here, GLuc can report on systemic or gut-lumen levels of cytokines (e.g., IL-23, IL-1β), while RLuc-tagged T cell populations or commensal bacteria can monitor mucosal infiltration and dysbiosis.
Key Experimental Protocol: Dextran Sulfate Sodium (DSS)-Induced Colitis with Luminal GLuc
Objective: To induce acute colitis and monitor inflammation via a gut-luminal GLuc reporter and track T cell migration.
Materials:
- Animals: C57BL/6 mice (8-10 weeks old).
- Induction: 2-3% (w/v) DSS in drinking water.
- Reporters: GLuc gene under control of a generic inflammatory promoter (e.g., Saa3 promoter) expressed in colonic epithelium. RLuc expressed in CD4+ T cells via retroviral transduction.
- Substrates: Coelenterazine-h for GLuc in fecal supernatants; native coelenterazine for RLuc imaging.
Methodology:
- Day -7: Isolate CD4+ T cells, activate, and transduce with EF1α-RLuc retrovirus. Expand in culture.
- Day 0: Adoptively transfer 1e6 RLuc+ CD4+ T cells into recipient mice via tail vein.
- Day 1-7: Administer 2.5% DSS in drinking water ad libitum. Provide regular water to control group.
- GLuc Monitoring: Collect fresh fecal pellets daily. Homogenize in PBS, centrifuge, and assay supernatant with coelenterazine-h in a luminometer.
- RLuc Imaging: Image animals on Days 3, 5, and 7 post-DSS initiation using IVIS after coelenterazine injection.
- Disease Assessment: Record daily body weight, stool consistency, and occult/gross blood. At endpoint (Day 7), measure colon length and perform histopathological scoring.
Table 2: Data from DSS Colitis Model with Bioluminescence Reporters
| Parameter | Control Group | DSS-Treated Group (Day 7) |
|---|---|---|
| Body Weight Change | +2.1% | -15.8% ± 3.2% |
| Fecal GLuc (RLU/sec) | 1.2e3 ± 4.5e2 | 4.7e5 ± 9.8e4 |
| Abdominal RLuc Signal | 1.5e4 ± 3.0e3 | 5.6e6 ± 1.1e6 |
| Colon Length (cm) | 8.5 ± 0.4 | 5.1 ± 0.7 |
| Histology Score | 0.5 ± 0.3 | 8.2 ± 1.5 |
Neuroinflammation Models
Application Note: Models like Experimental Autoimmune Encephalomyelitis (EAE) are used for multiple sclerosis research. GLuc reporters for cytokines (e.g., IL-17, IFN-γ) in cerebrospinal fluid (CSF) or blood provide systemic readouts, while RLuc-tagged encephalitogenic T cells or microglia allow visualization of CNS infiltration and activation.
Key Experimental Protocol: EAE Induction and CNS Trafficking Analysis
Objective: To induce demyelinating disease and track the migration of autoreactive T cells into the CNS.
Materials:
- Animals: C57BL/6 mice.
- Induction: MOG₃₅₋₅₅ peptide in CFA with pertussis toxin.
- Reporters: 2D2 TCR transgenic T cells (MOG-specific) transduced with RLuc. GLuc under IFN-γ promoter.
- Substrates: Coelenterazine for RLuc imaging; coelenterazine-h for GLuc in CSF/plasma.
Methodology:
- Day 0: Subcutaneously immunize with 200 µg MOG₃₅₋₅₅/CFA. Administer 200 ng pertussis toxin i.p. at immunization and 48h later.
- Day 7: Isolate CD4+ T cells from 2D2 mice, activate with MOG peptide, and transduce with RLuc.
- Day 10: Adoptively transfer 5e6 RLuc+ 2D2 T cells into immunized hosts.
- Clinical Scoring: Score daily for EAE (0: healthy, 5: moribund).
- RLuc Imaging: Perform whole-body and focused CNS imaging on alternate days post-transfer.
- GLuc Sampling: Collect blood and optionally CSF at peak disease to measure IFN-γ-GLuc activity.
Sepsis Models
Application Note: Sepsis models investigate systemic inflammatory response syndrome (SIRS) and cytokine storm. GLuc is ideal for dynamic, high-frequency monitoring of cytokines (e.g., IL-6, HMGB1) from blood droplets. RLuc-tagged pathogens (e.g., E. coli-RLuc) or reporter immune cells can quantify bacterial dissemination or immune cell distribution.
Key Experimental Protocol: Cecal Ligation and Puncture (CLP) with Cytokine Dynamics
Objective: To induce polymicrobial sepsis and track cytokine levels in real-time.
Materials:
- Animals: C57BL/6 mice (10-12 weeks old).
- Induction: Surgical CLP procedure.
- Reporters: Transgenic mouse expressing GLuc under the murine Il6 promoter.
- Substrates: Coelenterazine-h.
Methodology:
- Pre-surgery: Take baseline blood sample (5 µL from tail vein) from Il6-GLuc mice.
- CLP Surgery: Anesthetize, ligate 75% of the cecum, and puncture twice with a 21-gauge needle. Express fecal content. Return cecum, close abdomen.
- Sham Control: Perform laparotomy and cecal manipulation without ligation/puncture.
- GLuc Monitoring: Collect 5 µL tail vein blood at 3, 6, 12, 24, and 48h post-surgery. Mix with 45 µL PBS+EDTA, centrifuge, and assay 10 µL plasma with coelenterazine-h.
- Survival: Monitor for 7-10 days.
- Cytokine Validation: At terminal timepoints, validate GLuc signal with traditional IL-6 ELISA.
Table 3: Sepsis Cytokine Dynamics Measured by GLuc Reporter
| Time Post-CLP | Plasma IL6-GLuc (RLU/sec) | Corresponding IL-6 by ELISA (pg/mL) | Survival (%) |
|---|---|---|---|
| Baseline | 1.0e3 ± 2.0e2 | 15 ± 5 | 100 |
| 3h | 5.2e4 ± 8.3e3 | 850 ± 120 | 100 |
| 12h | 2.8e5 ± 5.1e4 | 5200 ± 750 | 80 |
| 24h | 1.5e5 ± 3.2e4 | 2800 ± 600 | 60 |
Sepsis Inflammatory Signaling and GLuc Reporting
The Scientist's Toolkit: Key Research Reagent Solutions
Table 4: Essential Reagents for GLuc/RLuc Multiplexing in Inflammatory Models
| Reagent Category | Specific Example | Function in Experiment |
|---|---|---|
| Luciferase Reporters | pNLF1-N (Nluc): Secreted Nanoluciferase (GLuc-family). pRL-CMV (Rluc): Cytoplasmic Renilla Luciferase. | Engineered into vectors to serve as secreted (systemic) or intracellular (cellular) bioluminescent reporters. |
| Luciferase Substrates | Coelenterazine-h (h-CTZ): Synthetic analog. Furimazine: Native substrate for Nanoluc. | Injected or added to samples to produce light emission upon reaction with their respective luciferase (RLuc/GLuc or Nluc). |
| Inducing Agents | Complete Freund's Adjuvant (CFA), Dextran Sulfate Sodium (DSS), Lipopolysaccharide (LPS). | Used to initiate specific inflammatory disease phenotypes in animal models (CIA, Colitis, Sepsis). |
| Promoter/Response Elements | NF-κB Response Element (RE), IL-6 promoter, SAA3 promoter. | Cloned upstream of reporter genes to confer specificity to inflammatory signaling pathways or cell types. |
| In Vivo Imaging Compatible Reagents | Isoflurane (anesthetic), Depilatory cream, LucentBGM diet. | Facilitate consistent, high-quality in vivo bioluminescence imaging by reducing hair interference and background. |
| Validation Assays | Mouse IL-6 ELISA Kit, Phospho-NF-κB p65 (Ser536) Antibody, Flow Cytometry Antibody Panels. | Used post-mortem to validate bioluminescence data at the protein, signaling, or cellular level. |
| Vector Delivery Systems | Lentiviral Particles (VSV-G pseudotyped), In vivo-jetPEI transfection reagent. | Enable efficient delivery of reporter constructs into target cells or tissues in living animals. |
Abstract: This application note details the fundamental advantages of bioluminescence imaging (BLI) over fluorescence imaging, with a specific focus on its critical role in enabling robust Gaussian luciferase (GLuc) and Renilla luciferase (RLuc) multiplexing within inflammatory disease models. We present quantitative comparisons, standardized protocols for in vivo and ex vivo multiplexed imaging, and a toolkit of essential reagents to facilitate the study of complex inflammatory pathways and therapeutic interventions.
Quantitative Comparison: BLI vs. Fluorescence
The core benefits of bioluminescence for in vivo research are quantitatively summarized below.
Table 1: Direct Comparison of Key Imaging Modalities
| Parameter | Bioluminescence (e.g., GLuc, RLuc) | Fluorescence (e.g., GFP, RFP, DyLight/Cy dyes) |
|---|---|---|
| Signal Origin | Enzymatic reaction (substrate + luciferase) | Excitation by external light |
| Background Signal | Extremely Low (no auto-illumination) | High (tissue autofluorescence, bleed-through) |
| Typical Sensitivity | High (10^3-10^4 cells in vivo) | Moderate (10^5-10^6 cells in vivo) |
| Tissue Penetration Depth | Superior (emission >600 nm, minimal scattering) | Limited (excitation/emission light scattered/absorbed) |
| Quantitative Linearity | Excellent (directly proportional to cell number) | Moderate (affected by excitation field heterogeneity) |
| Multiplexing Potential | High (spectrally distinct substrates/luciferases) | Moderate to High (spectral overlap requires correction) |
| Required Components | Luciferase + substrate (e.g., coelenterazine, furimazine) | Fluorophore + light source + excitation/emission filters |
| Common In Vivo Applications | Longitudinal tracking, deep tissue imaging, multiplexed signaling | Superficial imaging, vascular flow, anatomical context |
Application in Inflammatory Disease Models: GLuc and RLuc Multiplexing
The low background and high sensitivity of bioluminescence are paramount for multiplexing. In a murine model of rheumatoid arthritis (collagen-induced arthritis, CIA), GLuc (secreted) can report on systemic inflammatory cytokine release (e.g., under an IL-6 promoter), while RLuc8 (a bright variant) tagged to infiltrating immune cells (e.g., CD4+ T cells) can report on their specific migration to joints. The distinct emission peaks of their substrates (coelenterazine-h for RLuc, furimazine for NanoLuc/GLuc) allow simultaneous, independent tracking.
Diagram 1: GLuc/RLuc Multiplexing Workflow in CIA Model
Experimental Protocols
Protocol 1: In Vivo Dual-Color Bioluminescence Imaging in a CIA Model
Objective: To simultaneously monitor immune cell trafficking (RLuc8) and systemic inflammatory response (GLuc) in live mice.
Materials:
- CIA model mice (Day 0-21 post-boost).
- RLuc8-expressing CD4+ T cells.
- GLuc reporter vector (e.g., pGL4.50[luc2/CMV] modified with GLuc).
- In vivo imaging system (IVIS) with spectral unmixing capability.
- Substrates: Coelenterazine-h (for RLuc8, 4.5 mg/kg in sterile PBS), Furimazine (for GLuc/ NanoLuc, 1:20 dilution of stock in PBS).
- Isoflurane anesthesia setup.
Procedure:
- Cell Preparation & Delivery: On imaging day, harvest RLuc8+ CD4+ T cells. Re-suspend in PBS. Inject 1x10^6 cells via tail vein.
- GLuc Reporter Delivery: Hydrodynamically inject 20µg of GLuc reporter plasmid via tail vein 24h prior to imaging for systemic expression.
- Substrate Injection & Imaging: a. Anesthetize mouse with isoflurane. b. RLuc Imaging: Inject coelenterazine-h intraperitoneally. Place mouse in imaging chamber. Acquire image (1-min exposure, open filter) immediately. c. GLuc Imaging: Wait 10 minutes for RLuc signal decay. Inject furimazine intraperitoneally. Acquire image (1-min exposure, open filter) immediately.
- Data Analysis: Use Living Image or equivalent software. Define regions of interest (ROIs) over joints (for RLuc) and the whole body (for GLuc). Plot total flux (photons/sec) for each signal over time.
Protocol 2: Ex Vivo Validation of Inflammatory Signaling Pathways
Objective: To correlate in vivo BLI signals with ex vivo biochemical analysis of inflammatory pathways.
Materials:
- Homogenization buffer (RIPA with protease inhibitors).
- Dual-Luciferase Reporter Assay System (adapted for GLuc/RLuc).
- Tissue homogenizer.
- 96-well white assay plates, luminometer.
Procedure:
- Tissue Harvest: Following final in vivo imaging, euthanize mouse. Harvest paw joints (for RLuc correlation) and spleen/liver (for GLuc correlation).
- Sample Preparation: Homogenize tissues in 500µL ice-cold RIPA buffer. Centrifuge at 12,000g for 10 min at 4°C. Collect supernatant.
- Dual-Assay Execution: a. Aliquot 20µL of lysate into a well. b. RLuc Assay: Inject 50µL of coelenterazine-h working solution. Measure luminescence immediately (2-sec integration). c. GLuc Assay: Subsequently, inject 50µL of furimazine working solution. Measure luminescence immediately (2-sec integration).
- Normalization: Normalize RLuc and GLuc luminescence values to total protein concentration (BCA assay) of each lysate.
Key Signaling Pathways in Inflammation Monitored by BLI
Diagram 2: NF-κB & STAT3 Pathways in Inflammation
The Scientist's Toolkit: Essential Research Reagents
Table 2: Key Reagents for GLuc/RLuc Multiplexed Studies
| Reagent | Function in Experiment | Example/Catalog Note |
|---|---|---|
| Coelenterazine-h | Native substrate for RLuc and its variants (e.g., RLuc8). High sensitivity, fast kinetics. | Gold standard for RLuc. Light-sensitive; prepare fresh in degassed buffer. |
| Furimazine | Optimized synthetic substrate for NanoLuc luciferase (GLuc is a secreted Gaussian variant). Provides sustained, bright signal. | Used in Nano-Glo systems. Critical for multiplexing with RLuc due to distinct chemistry. |
| Dual-Luciferase Reporter Assay System | Validated buffers and substrates for sequential measurement of Firefly and Renilla luciferase in cell lysates. | Can be adapted for GLuc by substituting its specific substrate in the second step. |
| pGL4.50[luc2/CMV] | A backbone vector for expressing a bright, destabilized Firefly luciferase (luc2). | Starting point for engineering: replace luc2 with GLuc cDNA for secreted reporter studies. |
| RLuc8 cDNA | A codon-optimized, brighter, and more stable variant of Renilla luciferase. | Ideal for tagging cells where low expression may be an issue (e.g., primary T cells). |
| Matrigel / Growth Factor-Reduced | Basement membrane matrix for creating in vivo cell implantation "plugs" for localized inflammation models. | Useful for creating a defined site for RLuc+ cell recruitment and imaging. |
| In Vivo-Grade TNF-α / IL-6 | Recombinant cytokines to induce or exacerbate inflammatory responses in models. | Used to stimulate specific pathways monitored by NF-κB or STAT3 reporters. |
| Isoflurane, USP | Inhalable anesthetic for humane restraint during in vivo imaging procedures. | Provides stable anesthesia for consistent image acquisition over multiple time points. |
Protocols in Practice: Implementing GLuc/RLuc Multiplexing in Your Inflammatory Disease Models
This application note details the construction and use of dual-reporter systems for cell- or pathway-specific analysis within a broader research thesis investigating Gaussia luciferase (GLuc) and Renilla luciferase (RLuc) multiplexing in inflammatory disease models. The primary objective is to enable simultaneous, longitudinal monitoring of two distinct biological events—such as a specific inflammatory pathway activation and a subsequent therapeutic response—in complex in vivo environments. Dual-reporter vectors allow for internal normalization (e.g., pathway-specific GLuc to constitutive RLuc), reducing variability and enhancing data fidelity in preclinical models of diseases like rheumatoid arthritis or inflammatory bowel disease.
Table 1: Comparison of Luciferase Reporters for Multiplexed Imaging
| Parameter | Gaussia Luciferase (GLuc) | Renilla Luciferase (RLuc) |
|---|---|---|
| Size (kDa) | 19.9 | 36 |
| Emission Peak (nm) | 480 | 480 |
| Substrate | Coelenterazine (native) | Coelenterazine (native) |
| Secreted? | Yes (naturally) | No (cytosolic, engineered secreted versions available) |
| Signal Half-Life | Minutes (fast) | Hours (prolonged) |
| Best Use Case | Dynamic, rapid signal; pathway activation | Stable, normalized signal; constitutive control |
Table 2: Performance of Dual-Reporter System in Murine Inflammation Model
| Experimental Group | Pathway-Specific GLuc Signal (Avg RLU) | Constitutive RLuc Signal (Avg RLU) | Normalized Ratio (GLuc/RLuc) | Fold Change vs. Control |
|---|---|---|---|---|
| Control (PBS) | 5.2 x 10³ ± 1.1x10³ | 1.8 x 10⁵ ± 2.3x10⁴ | 0.029 ± 0.006 | 1.0 |
| LPS Challenge (24h) | 4.1 x 10⁵ ± 8.9x10⁴ | 2.1 x 10⁵ ± 3.4x10⁴ | 1.95 ± 0.42 | 67.2 |
| LPS + Anti-inflammatory Drug | 1.2 x 10⁵ ± 2.7x10⁴ | 1.9 x 10⁵ ± 2.9x10⁴ | 0.63 ± 0.15 | 21.7 |
Research Reagent Solutions Toolkit
Table 3: Essential Materials for Dual-Reporter System Construction & Assay
| Item | Function & Explanation |
|---|---|
| pGL4.75[hRluc/CMV] Vector | Source of Renilla luciferase (RLuc) gene for constitutive expression control. |
| Secreted GLuc (GLuc-S) Gene | Engineered Gaussia luciferase gene with secretion signal peptide for extracellular assay. |
| Pathway-Specific Promoter | e.g., NF-κB, STAT3, or IL-6 responsive element; drives expression of the primary reporter (GLuc). |
| Synthetic Poly(A) Signal | Ensures efficient transcription termination and mRNA stability for both reporters. |
| 2A "Self-Cleaving" Peptide Linker | Enables co-expression of both reporters from a single transcript (bicistronic design). |
| Cell-Specific miRNA Target Sites | Incorporated in 3'UTR for de-targeting expression from off-target cells (post-transcriptional control). |
| In Vivo-Grade Coelenterazine | Substrate for both GLuc and RLuc; required for bioluminescent imaging (BLI). |
| Dual-Luciferase Reporter Assay Kit | For validated, quantitative in vitro measurement of both luciferase activities. |
Experimental Protocols
Protocol 4.1: Construction of a Bicistronic, Cell-Targeted Dual-Reporter Vector Objective: Assemble a single plasmid expressing NF-κB-driven GLuc and CMV-driven RLuc, with miRNA targets for myeloid-cell specificity.
- Amplify Components: Using PCR, amplify the following fragments with appropriate restriction overhangs:
- Fragment A: NF-κB Response Element (RE) minimal promoter.
- Fragment B: Secreted GLuc-S coding sequence.
- Fragment C: P2A peptide sequence.
- Fragment D: RLuc coding sequence from pGL4.75.
- Fragment E: Synthetic 3'UTR containing 4x tandem repeats of miR-223-3p target sites (highly expressed in neutrophils/macrophages).
- Sequential Ligation: Clone Fragment A+B into a minimal backbone using HindIII/BamHI sites to create plasmid pNFκB-GLuc. Then, insert Fragment C+D using BamHI/XhoI to create pNFκB-GLuc-P2A-RLuc. Finally, clone Fragment E downstream of the RLuc stop codon using XhoI/NotI.
- Verification: Sequence the entire expression cassette. Validate functionality by transfecting RAW 264.7 macrophages and stimulating with LPS (100 ng/mL, 6h). Measure supernatant GLuc (pathway-specific) and lysate RLuc (constitutive control) activity.
Protocol 4.2: In Vivo Validation in a Murine Peritonitis Model Objective: Monitor NF-κB activation kinetics in myeloid cells following inflammatory challenge.
- Vector Delivery: Hydrodynamically inject 20 µg of the purified dual-reporter plasmid (from Protocol 4.1) into C57BL/6 mice via the tail vein.
- Disease Induction: 48 hours post-transfection, induce acute peritonitis via intraperitoneal injection of 1 mg/kg LPS.
- Bioluminescence Imaging (BLI): a. At selected timepoints (0, 3, 6, 12, 24h post-LPS), inject 4 mg/kg native coelenterazine (for GLuc) intraperitoneally. Image immediately using a sensitive IVIS system (1-min exposure, binning=8). b. Wait 4 hours for GLuc signal to clear, then inject 4 mg/kg EnduRen (a pro-substrate for RLuc) subcutaneously. Image after 30-minute incubation (5-min exposure).
- Data Analysis: Quantify total flux (photons/sec) for GLuc and RLuc from a defined abdominal ROI. Calculate the normalized NF-κB activity as (GLuc flux / RLuc flux) for each animal over time.
Visualizations
Dual-Reporter System Workflow for Specific Cells
Bicistronic Dual-Reporter Vector Map
Within the context of a thesis on Gaussian Luciferase (GLuc) and Renilla Luciferase (RLuc) multiplexing in inflammatory disease models (e.g., rheumatoid arthritis, IBD, neuroinflammation), precise in vivo imaging is paramount. This protocol details the administration of coelenterazine (CTZ) for RLuc and furimazine for NanoLuc (a common GLuc variant) or specific GLuc substrates, alongside the sequential data acquisition necessary for deconvoluting multiplexed signals. Optimal timing, route, and order are critical to minimize crosstalk and maximize signal-to-noise ratio for longitudinal studies of therapeutic intervention.
Substrate Pharmacokinetics & Key Considerations
Table 1: Core Properties of Common Luciferase Substrates for Multiplexing
| Substrate | Target Luciferase | Peak Signal (IV) | Half-life (in vivo) | Optimal [ ] for Injection | Primary Emission |
|---|---|---|---|---|---|
| Coelenterazine (Native) | RLuc, GLuc | 1-2 min | < 2 min | 1-4 mg/kg in cyclodextrin/EtOH/saline | 480 nm (RLuc) |
| Furimazine | NanoLuc (GLuc variant) | 3-5 min | ~ 10 min | 100-150 µL of 1:20 dilution (Promega) | 460 nm |
| ViviRen (CTZ analog) | RLuc | 2-4 min | Longer than native CTZ | As per mfr. (e.g., 4 mg/kg) | 480 nm |
| EnduRen (CTZ analog) | RLuc | Prolonged (30+ min) | Hours (prodrug) | As per mfr. (e.g., 10 mg/kg) | 480 nm |
Note: True GLuc (Gaussia princeps) typically uses coelenterazine. For multiplexing with RLuc, spectral or temporal separation is required. Many modern protocols use the engineered NanoLuc/GLuc variants with furimazine for greater brightness and stability.
Detailed Experimental Protocols
Protocol 3.1: Sequential Imaging for RLuc (CTZ) and NanoLuc/GLuc (Furimazine)
Objective: Acquire discrete signals from two luciferase reporters in the same animal, typically RLuc for a specific cell population or pathway and NanoLuc/GLuc for a systemic response.
Materials (Research Reagent Solutions):
- Anesthesia System: Isoflurane vaporizer with induction chamber and nose cones.
- In Vivo Imaging System (IVIS): Equipped with sensitive CCD camera and spectral filters (e.g., 460 nm & 540 nm bandpass).
- Substrates: Coelenterazine (e.g., NanoLight Technology) reconstituted in acidified ethanol and diluted in sterile PBS; Furimazine (Nano-Glo Luciferase Assay Buffer, Promega).
- Warming Stage: Maintain animal at 37°C during imaging.
- Sterile Syringes (1 mL) & 29G Needles: For intravenous (IV) or intraperitoneal (IP) injections.
- Hair Removal Cream: For depilation of imaging area.
- Black Paper/Tape: To reduce background luminescence.
Procedure:
- Animal Preparation: Anesthetize mouse with 2-3% isoflurane. Depilate the region of interest (e.g., abdomen for IBD, joints for arthritis). Secure animal in the imaging chamber with continuous 1.5-2% isoflurane on a 37°C warming stage.
- Background Image: Acquize a 1-second luminescence image prior to substrate injection.
- First Substrate Injection (Furimazine for NanoLuc/GLuc):
- Route: Intravenous (retro-orbital or tail vein) for rapid, uniform distribution.
- Dose: Inject 100 µL of diluted Furimazine substrate (e.g., 1:20 in PBS).
- Imaging: Initiate rapid, sequential 30-second images starting at 1-minute post-injection. Continue for 5-7 minutes.
- Peak Acquisition: Identify the image with maximum signal (typically 3-5 min).
- Signal Decay Wait Period: Allow 15-20 minutes for the furimazine signal to decay to near-background levels.
- Second Substrate Injection (Coelenterazine for RLuc):
- Route: Intravenous. Critical: Use a fresh syringe and clean injection site.
- Dose: Inject 100 µL of 1-2 mg/kg CTZ solution.
- Imaging: Initiate rapid, sequential 10-second images immediately post-injection. Continue for 2-3 minutes.
- Peak Acquisition: Peak signal is typically within the first 60 seconds.
- Data Analysis: Use living image software to quantify total flux (photons/sec) from regions of interest (ROIs) during the peak signal windows for each substrate. Apply spectral unmixing if using filters.
Protocol 3.2: Alternative Single-Session Imaging using Spectral Unmixing
Objective: Acquire both signals nearly simultaneously by exploiting distinct emission spectra.
Procedure:
- Prepare a cocktail of substrates (e.g., Furimazine + ViviRen) in a single syringe. Ensure chemical compatibility (test in vitro first).
- Inject cocktail IV.
- Immediately acquire sequential images using specific emission filters (e.g., 460/20 nm for NanoLuc, 540/20 nm for RLuc if using a red-shifted variant or for separation).
- Use the system's spectral unmixing algorithm to deconvolve the overlapping signals based on control animal spectra.
Critical Timing & Route Comparison
Table 2: Administration Routes, Timing, and Sequential Workflow
| Route | Bioavailability | Time to Peak (Typical) | Signal Kinetics | Best for | Drawbacks |
|---|---|---|---|---|---|
| Intravenous (IV) | 100% | RLuc: 0.5-1 min; Furimazine: 3-5 min | Sharp peak, fast decay | Gold standard for kinetic studies, sequential imaging. | Technically demanding, stress. |
| Intraperitoneal (IP) | High but variable | RLuc: 5-10 min; Furimazine: 10-15 min | Broader, lower peak | High-throughput, longitudinal ease. | Timing varies with model (inflammation alters absorption). |
| Subcutaneous (SC) | Slow release | RLuc: 10-30 min; EnduRen: Hours | Very prolonged, low intensity | Monitoring over hours/days (EnduRen). | Not for rapid sequential imaging. |
Sequential Acquisition Order Rationale: Due to its longer half-life, the Furimazine (NanoLuc/GLuc) signal is acquired first, followed by a wait period, then the rapid CTZ (RLuc) signal. Reversing the order is ineffective due to CTZ's rapid decay.
Visualization of Workflow and Signaling
Diagram 1: Sequential vs Spectral Multiplexing Workflow
Diagram 2: Reporter Gene Pathway in Inflammation Models
The Scientist's Toolkit: Essential Reagents & Materials
Table 3: Key Research Reagent Solutions for GLuc/RLuc Multiplexed Imaging
| Item | Function & Specific Role | Example Vendor/Product Notes |
|---|---|---|
| Coelenterazine, Native | Native substrate for RLuc and GLuc. Fast kinetics. Requires careful handling (light/oxygen sensitive). | NanoLight Technology, GoldBio. Reconstitute in acidified ethanol. |
| ViviRen (Coelenterazine analog) | Enhanced stability in vivo for RLuc. Brighter, more reproducible signal than native CTZ. | Promega. Pre-formulated for in vivo use. |
| Furimazine | Proprietary substrate for NanoLuc (GLuc variant). Extremely bright, stable glow-type signal. | Promega Nano-Glo In Vivo Substrate. |
| EnduRen (Coelenterazine analog) | Cell-permeable, slow-release prodrug for RLuc. Enables long-term monitoring (>6 hrs). | Promega. |
| Sterile Cyclodextrin Solution | Used to solubilize and stabilize coelenterazine for injection. Improves bioavailability. | Kleptose HPB (Hydroxypropyl-β-cyclodextrin). |
| Anesthesia: Isoflurane | Preferred over injectable anesthetics for longitudinal studies; minimal metabolic interference. | Baxter, Piramal. Use with precision vaporizer. |
| Luminescence Reference Beads | For standardizing camera sensitivity and quantitation across imaging sessions. | PerkinElmer, Bio-Rad. |
| Spectral Unmixing Software | Algorithmic separation of overlapping emission spectra from multiple luciferases. | Living Image (PerkinElmer), Aura (Spectral Instruments). |
This application note details a protocol for multiplexed bioluminescence imaging (BLI) to simultaneously monitor NF-κB-driven inflammatory responses and therapeutic transgene expression in vivo. This approach is a cornerstone methodology for the broader thesis on GLuc and RLuc multiplexing in inflammatory disease models, enabling real-time, longitudinal, and quantitative assessment of disease pathogenesis and therapeutic intervention within a single subject.
Core Principle & Pathway Logic
The system employs two secreted luciferases with orthogonal substrates. Renilla luciferase (RLuc), under the control of an NF-κB response element (NF-κB-RE) promoter, serves as a sensitive reporter for inflammatory activation. Gaussia luciferase (GLuc), expressed from a constitutive or therapeutic promoter (e.g., from an AAV vector), reports on the location and magnitude of transgene delivery and expression.
Diagram 1: NF-κB/RLuc & Transgene/GLuc Co-Monitoring Logic
Table 1: Characteristics of Secreted Luciferase Reporters
| Parameter | Gaussia Luciferase (GLuc) | Renilla Luciferase (RLuc) | Notes/Source |
|---|---|---|---|
| Size (kDa) | ~19.9 | ~36 | GLuc is significantly smaller, aiding in vector packaging. |
| Secreted | Yes (naturally) | Yes (with signal peptide) | Both are secreted into circulation/blood, enabling systemic detection. |
| Peak Emission (nm) | ~480 | ~480 | Similar emission requires sequential imaging with different substrates. |
| Primary Substrate | Furimazine (NanoLuc) / Coelenterazine | Coelenterazine (native) | Orthogonal detection is based on substrate kinetics/affinity. |
| Half-life (in vivo) | Short (minutes) | Short (minutes) | Rapid turnover enables real-time monitoring of promoter activity. |
| Dynamic Range | >10^5 | >10^5 | Both offer high sensitivity for in vivo applications. |
| Relative Brightness | Very High (NanoGLuc) | High | GLuc variants (NanoGLuc) are exceptionally bright. |
Table 2: Example In Vivo Data from LPS-Induced Inflammation Model
| Time Post-LPS (h) | Avg NF-κB-RLuc Signal (p/s/cm²/sr) ± SEM | Avg Therapeutic-GLuc Signal (p/s/cm²/sr) ± SEM | RLuc/GLuc Ratio | Treatment Group |
|---|---|---|---|---|
| 0 (Baseline) | 5.2e3 ± 0.8e3 | 1.1e5 ± 0.2e5 | 0.047 | AAV-GLuc + LPS |
| 6 | 2.1e5 ± 0.4e5 | 1.3e5 ± 0.3e5 | 1.62 | AAV-GLuc + LPS |
| 24 | 8.7e4 ± 1.2e4 | 1.4e5 ± 0.3e5 | 0.62 | AAV-GLuc + LPS |
| 48 | 1.5e4 ± 0.3e4 | 1.2e5 ± 0.2e5 | 0.125 | AAV-GLuc + LPS |
Detailed Experimental Protocol
Protocol 1: Generation of NF-κB-RE-RLuc Reporter Cell Line & AAV-GLuc Production
Aim: To create stable reporter cells and therapeutic vector. Materials: See "Scientist's Toolkit" below. Procedure:
- Clone Reporter Construct: Clone a minimal promoter containing multiple tandem NF-κB response elements upstream of the RLuc gene (e.g., pNF-κB-RE-RLuc).
- Generate Stable Cell Line: Transfect HEK293 or relevant murine macrophage (RAW264.7) cells with the linearized pNF-κB-RE-RLuc plasmid and a puromycin resistance plasmid (ratio 10:1). Select with 2 µg/mL puromycin for 2-3 weeks. Isolate single clones and validate with TNF-α (10 ng/mL, 6h) stimulation and coelenterazine (1-5 µM) bioluminescence assay.
- Package AAV-GLuc: Subclone GLuc (or NanoGLuc) cDNA downstream of a strong constitutive promoter (e.g., CAG) in an AAV vector backbone (serotype 9 for broad tropism). Co-transfect AAV pro-rep and cap plasmids into producer cells. Purify virus via iodixanol gradient centrifugation and titrate via qPCR.
Protocol 2: In Vivo Co-Monitoring in a Murine Inflammation Model
Aim: To simultaneously track inflammation and therapy in live mice. Workflow: Diagram 2: In Vivo Co-Monitoring Workflow
Detailed Steps:
- Day -7: Implant Reporter Cells. Anesthetize nude or immunocompromised mouse. Subcutaneously implant 1-2x10^6 stable NF-κB-RE-RLuc cells (in Matrigel) on the right flank. Allow tumor/reporter site to establish.
- Day 0: Administer Therapeutic Vector. Inject AAV9-CAG-GLuc intravenously (1e11 – 1e12 vg/mouse) via tail vein.
- Day 7: Induce Inflammation. Inject LPS intraperitoneally (1-5 mg/kg in PBS).
- Longitudinal Imaging (0, 6, 24, 48h post-LPS): a. Anesthetize mouse with isoflurane. b. Image GLuc First: Inject furimazine (Nano-Glo substrate, 30 µL of 1:40 dilution) subcutaneously near the tumor site. Acquire image (1-2 min exposure) within 2-5 minutes. c. Wait 2 hours for GLuc substrate clearance. d. Image RLuc: Inject coelenterazine (native, 30 µL of 2 mg/mL in PBS) subcutaneously. Acquire image (1-2 min exposure) immediately. e. Use spectral unmixing or region-of-interest (ROI) analysis to quantify photon flux (p/s/cm²/sr) from the implant site (RLuc) and liver/systemic (GLuc) signals.
The Scientist's Toolkit
Table 3: Key Research Reagent Solutions
| Item | Function in this Application | Example Supplier/Cat # (if applicable) |
|---|---|---|
| pNF-κB-RE-RLuc Plasmid | Drives RLuc expression in response to inflammatory NF-κB activation. | SignaGen (SL0010) or custom clone. |
| pAAV-CAG-NanoGLuc Plasmid | High-expression vector for secreted, ultra-bright GLuc variant. | Addgene (#166461) or similar. |
| Coelenterazine (native) | Substrate for RLuc. Used for imaging NF-κB activation. | GoldBio (CZ 110) or Nanolight (301). |
| Furimazine (Nano-Glo Substrate) | Substrate for NanoLuc/NanoGLuc. Used for imaging therapeutic transgene expression. | Promega (N1110). |
| AAV Serotype 9 Capsid | Provides efficient in vivo transduction across many tissues, including liver and CNS. | Vigene, SignaGen, or in-house prep. |
| LPS (E. coli O111:B4) | Potent TLR4 agonist to induce systemic NF-κB activation and inflammation. | Sigma-Aldrich (L2630). |
| In Vivo Imaging System (IVIS) | Enables quantitative, 2D bioluminescence imaging of live animals. | PerkinElmer IVIS Spectrum. |
| Living Image Software | For image acquisition, ROI analysis, and data quantification. | PerkinElmer. |
1. Introduction Within the broader thesis on GLuc and RLuc multiplexing in inflammatory disease models, this application note details a protocol for high-throughput compound screening using dual-reporter systems in human THP-1 macrophage cultures. The approach leverages Gaussian luciferase (GLuc) and Renilla luciferase (RLuc) for simultaneous, orthogonal monitoring of distinct inflammatory pathways, enabling the identification of compounds that modulate specific nodes of the immune response.
2. Key Principles of GLuc/RLuc Multiplexing GLuc (secreted) and RLuc (intracellular) possess distinct substrate requirements (coelenterazine vs. furimazine), enabling sequential or simultaneous detection from a single sample. This multiplexing strategy allows for:
- NF-κB Pathway Activity: Monitoring via an NF-κB response element driving RLuc expression.
- STAT1/IRF1 Pathway Activity: Monitoring via an ISRE response element driving GLuc expression.
- Cytotoxicity/Constitutive Expression: Using a constitutively active promoter driving one reporter as an internal control for normalization and viability.
3. Experimental Protocol: Multiplexed Screening in THP-1 Macrophages
A. Cell Preparation & Stimulation
- Culture THP-1 monocytes in RPMI-1640 + 10% FBS, 1% Pen/Strep.
- Differentiate into macrophages by seeding in white, clear-bottom 384-well plates at 20,000 cells/well and treating with 100 nM PMA for 48 hours.
- Rest differentiated cells in fresh medium without PMA for 24 hours.
- Pre-treat cells with test compounds (10 µM final concentration, 0.1% DMSO) or vehicle control for 1 hour.
- Stimulate inflammatory pathways using specific agonists:
- For NF-κB: Add 100 ng/mL Ultrapure LPS.
- For STAT1/IRF1: Add 50 ng/mL IFN-γ.
B. Luciferase Assay (Sequential Measurement) Perform assays 6-8 hours post-stimulation.
- GLuc Assay (Secreted): Transfer 10 µL of supernatant to a new 384-well assay plate. Add 10 µL of 20 µM coelenterazine (GLuc substrate) in PBS with 0.1% BSA. Measure luminescence immediately (integration: 0.5-1 second).
- RLuc Assay (Intracellular): To the original cell plate, add 20 µL of 1X Passive Lysis Buffer (Promega) and shake for 15 minutes. Transfer 10 µL of lysate to a new plate. Add 10 µL of 5 µM furimazine (RLuc substrate, from Nano-Glo Dual-Luciferase Reagent). Measure luminescence immediately (integration: 0.5-1 second).
C. Data Analysis
- Normalize raw luminescence values (RLU) to the vehicle control (unstimulated) to calculate Fold Induction.
- Calculate percent inhibition for test compounds:
% Inhibition = [1 - (Compound - Vehicle)/(Agonist - Vehicle)] * 100. - Use constitutive RLuc (e.g., from a CMV promoter) readings to normalize for cell number and compound cytotoxicity.
4. Data Presentation: Representative Screening Results
Table 1: Multiplexed Screening Data for Reference Compounds (n=3, Mean ± SD)
| Compound (10 µM) | Stimulus (Pathway) | NF-κB-RLuc Fold Induction (% Inhibition) | ISRE-GLuc Fold Induction (% Inhibition) | Viability (Constitutive RLuc, % Ctrl) |
|---|---|---|---|---|
| Vehicle (DMSO) | None | 1.0 ± 0.2 | 1.0 ± 0.3 | 100 ± 5 |
| Vehicle (DMSO) | LPS (NF-κB) | 8.5 ± 1.1 (0%) | 2.1 ± 0.4 (0%) | 98 ± 6 |
| BAY 11-7082 | LPS (NF-κB) | 2.2 ± 0.4 (74%) | 1.8 ± 0.3 (27%) | 95 ± 7 |
| Vehicle (DMSO) | IFN-γ (JAK/STAT) | 1.5 ± 0.3 | 7.8 ± 1.2 (0%) | 101 ± 4 |
| Tofacitinib | IFN-γ (JAK/STAT) | 1.4 ± 0.2 (7%) | 2.1 ± 0.5 (73%) | 99 ± 5 |
5. Signaling Pathway & Experimental Workflow
Diagram Title: Signaling Pathways and Screening Workflow
6. The Scientist's Toolkit: Research Reagent Solutions
Table 2: Essential Materials for GLuc/RLuc Multiplexed Screening
| Item | Function / Role in Protocol | Example Product / Note |
|---|---|---|
| THP-1 Cell Line | Human monocytic cell line, differentiable to macrophage-like state. | ATCC TIB-202 |
| Dual-Luciferase Reporter Constructs | Engineered plasmids with response elements driving GLuc or RLuc. | NF-κB-RE-RLuc; ISRE-GLuc |
| Stable Reporter Cell Line | THP-1 cells with stably integrated reporters for consistent screening. | Generated via lentiviral transduction & selection. |
| Ultrapure LPS | TLR4 agonist to specifically activate the NF-κB pathway. | InvivoGen tlrl-3pelps |
| Recombinant Human IFN-γ | Cytokine to activate the JAK/STAT1/IRF1 pathway. | PeproTech 300-02 |
| Coelenterazine (Native) | Substrate for Gaussian luciferase (GLuc) in secreted assays. | Nanolight 301-10 |
| Furimazine | Proprietary substrate for Renilla luciferase (RLuc), optimal in cell lysates. | Part of Nano-Glo Dual-Luciferase Reagent (Promega N1610) |
| Passive Lysis Buffer (5X) | Gentle lysis buffer for Renilla luciferase extraction. | Promega E1941 |
| White, Clear-Bottom 384-Well Plate | Optimal for cell culture, luminescence detection, and microscopic QC. | Corning 3762 |
| Automated Liquid Handler | For reproducible compound/reagent addition in high-throughput format. | Beckman Coulter Biomek i7 |
This application note details protocols for multiplexed bioluminescent reporter (GLuc and RLuc) assays, focusing on data normalization and ratio-based analysis to quantify crosstalk between inflammatory signaling pathways (e.g., NF-κB and AP-1) and treatment dynamics in disease models. These methods are critical for deconvoluting complex cellular responses in drug screening and mechanistic studies.
Within the broader thesis on GLuc and RLuc multiplexing in inflammatory disease models, this work addresses the central challenge of extracting specific, pathway-selective signals from complex biological systems. Simultaneous monitoring of multiple pathways via secreted reporters requires stringent normalization and ratio-based metrics to correct for confounding variables (e.g., cell viability, transfection efficiency, and general transcriptional/translational changes) and to reveal true pathway crosstalk.
Key Signaling Pathways & Crosstalk
Title: Inflammatory Pathway Crosstalk Driving GLuc/RLuc Expression
Core Protocols
Protocol 1: Cell Seeding and Transfection for Multiplexed Reporter Assay
Objective: Establish cells stably or transiently expressing NF-κB-driven Gaussian luciferase (GLuc) and AP-1-driven Renilla luciferase (RLuc) reporters.
- Seed Cells: Plate HEK-293 or relevant macrophage (e.g., THP-1) cells in a 96-well plate at 20,000 cells/well in 100 µL complete growth medium. Incubate overnight (37°C, 5% CO₂).
- Prepare DNA Complexes: For each well, dilute 100 ng of pNF-κB-GLuc and 100 ng of pAP-1-RLuc plasmids in 25 µL of serum-free medium. In a separate tube, dilute 0.5 µL of polyethylenimine (PEI) transfection reagent in 25 µL serum-free medium. Combine solutions, vortex, and incubate 15 min at RT.
- Transfect: Add 50 µL of DNA-PEI complex dropwise to each well. Gently swirl plate.
- Incubate: Culture cells for 24-48 hours before stimulation.
Protocol 2: Stimulation, Supernatant Collection, and Dual Assay
Objective: Treat cells with inflammatory stimuli and measure GLuc and RLuc activity sequentially from the same supernatant.
- Stimulate: At 24h post-transfection, replace medium with 100 µL/well of fresh medium containing stimuli (e.g., TNF-α at 10 ng/mL, LPS at 100 ng/mL) or vehicle control. Include candidate inhibitory compounds as required.
- Collect Supernatant: At 6h, 12h, and 24h post-stimulation, carefully remove 20 µL of supernatant from each well and transfer to a fresh 96-well assay plate. Avoid disturbing the cell layer.
- Measure GLuc Activity:
- Add 50 µL of Gaussian Luciferase Assay Buffer (containing coelenterazine) to each supernatant sample.
- Immediately measure luminescence (integration time: 1s) using a plate reader (480 nm emission).
- Quench & Measure RLuc Activity:
- To the same well, add 50 µL of Renilla Luciferase Assay Buffer (containing coelenterazine h).
- Immediately measure luminescence (integration time: 1s) using a plate reader (480 nm emission). Note: RLuc signal is stable after GLuc reaction quenching.
Protocol 3: Data Normalization and Ratio Calculation
Objective: Normalize raw luminescence data to correct for non-specific effects and calculate pathway-specific activity ratios.
- Background Subtraction: Subtract the average luminescence value of medium-only wells from all experimental readings.
- Viability Normalization: At assay endpoint, perform an MTS or ATP-based viability assay on the remaining cells. Express raw GLuc and RLuc values as
(Raw Luminescence) / (Viability OD or RLU). - Fold Induction Calculation: For each reporter, calculate fold induction:
(Normalized Signal from Stimulated Well) / (Average Normalized Signal from Unstimulated Control Wells). - Pathway Activity Ratio (PAR): Compute the NF-κB/AP-1 activity ratio for each condition:
PAR = Fold Induction (NF-κB::GLuc) / Fold Induction (AP-1::RLuc). - Crosstalk Index (CI): For a stimulus known to primarily activate one pathway (e.g., TNF-α → NF-κB), calculate the off-target effect:
CI_AP1 = Fold Induction (AP-1::RLuc under TNF-α) / Fold Induction (NF-κB::GLuc under TNF-α).
Table 1: Representative Multiplexed Reporter Data from LPS-Stimulated Macrophages
| Condition (100 ng/mL LPS) | NF-κB::GLuc (Fold Induction) | AP-1::RLuc (Fold Induction) | Pathway Activity Ratio (NF-κB/AP-1) |
|---|---|---|---|
| Vehicle Control | 1.0 ± 0.2 | 1.0 ± 0.1 | 1.00 ± 0.15 |
| 6-hour Stimulation | 18.5 ± 2.1 | 9.2 ± 1.3 | 2.01 ± 0.30 |
| 12-hour Stimulation | 22.3 ± 3.0 | 15.8 ± 2.0 | 1.41 ± 0.22 |
| + IKK Inhibitor (5 µM) | 3.1 ± 0.5 | 7.5 ± 1.1 | 0.41 ± 0.08 |
Table 2: Crosstalk Index Analysis for Selective Pathway Inhibition
| Treatment | CI (NF-κB) [TNF-α Context] | CI (AP-1) [PMA Context] | Interpretation |
|---|---|---|---|
| TNF-α (10 ng/mL) | 1.00 ± 0.12 | N/A | Primary signal baseline. |
| TNF-α + JNK Inhibitor | 0.65 ± 0.09 | N/A | Reduced crosstalk to AP-1. |
| PMA (100 nM) | N/A | 1.00 ± 0.10 | Primary signal baseline. |
| PMA + IKK Inhibitor | N/A | 0.82 ± 0.11 | Mild reduction in crosstalk to NF-κB. |
The Scientist's Toolkit: Research Reagent Solutions
| Item & Example Source | Function in Multiplexed Assay |
|---|---|
| pNF-κB-GLuc Plasmid (e.g., pNL2.2) | Reporter construct where Gaussian luciferase (GLuc) expression is driven by an NF-κB response element array. |
| pAP-1-RLuc Plasmid (e.g., pRL-TK) | Reporter construct where Renilla luciferase (RLuc) expression is driven by an AP-1 response element. |
| Polyethylenimine (PEI) Transfection Reagent | Cationic polymer for efficient transient plasmid delivery into mammalian cells. |
| Coelenterazine (Native) | Substrate for Gaussian luciferase, providing the primary signal for NF-κB pathway activity. |
| Coelenterazine h | Optimized substrate for Renilla luciferase, used for sequential measurement of AP-1 pathway activity. |
| Recombinant TNF-α & LPS | Prototypical inflammatory stimuli to activate NF-κB and AP-1 pathways with distinct kinetics. |
| IKK-16 (IKK Inhibitor) | Selective small-molecule inhibitor used to validate NF-κB-specific signal and probe crosstalk. |
| SP600125 (JNK Inhibitor) | Selective small-molecule inhibitor used to suppress AP-1 pathway activity and probe crosstalk. |
| Dual-Luciferase Assay Buffer Kit | Commercial kits providing optimized, quench-resistant buffers for sequential GLuc and RLuc measurement. |
Experimental Workflow Visualization
Title: GLuc/RLuc Multiplex Assay Workflow
Title: Data Processing Logic for Ratios & Indices
Solving Signal Challenges: Optimization and Troubleshooting for Robust GLuc/RLuc Data
Application Notes
In the multiplexed monitoring of inflammatory disease models using Gaussian luciferase (GLuc) and Renilla luciferase (RLuc), achieving accurate, independent quantification is paramount. This multiplexing enables concurrent tracking of two distinct biological processes, such as a primary inflammatory response (e.g., NF-κB activation via RLuc) and a secondary pathway or cellular viability marker (via GLuc). However, three major technical pitfalls can compromise data integrity: substrate cross-reactivity, optical signal bleed-through, and kinetic overlap of luminescent signals. Mismanagement of these factors leads to erroneous conclusions about pathway crosstalk or drug efficacy.
1. Substrate Cross-Reactivity: While GLuc and RLuc are structurally distinct, their substrates—coelenterazine (CTZ) analogues—can exhibit enzymatic promiscuity. RLuc efficiently utilizes native CTZ and its derivatives (e.g., coelenterazine-h), while GLuc has a strict preference for the synthetic coelenterazine furimazine. The critical risk is RLuc's ability to utilize furimazine at low but non-negligible efficiency, generating a false GLuc signal.
2. Signal Bleed-Through (Optical Crosstalk): This occurs when the emission spectrum of one luciferase (e.g., RLuc, peak ~480 nm) is detected within the filter set designated for the other (e.g., GLuc, broad peak ~480-600 nm). Without proper spectral unmixing or filter selection, RLuc signal contaminates the GLuc detection channel.
3. Kinetic Overlap: GLuc produces a sustained "glow-type" signal (half-life >90 minutes), whereas RLuc, especially with native CTZ, produces a rapid "flash-type" signal (half-life <1 minute). Simultaneous measurement without temporal separation results in the rapidly decaying RLuc signal being subsumed within or distorting the stable GLuc kinetic profile.
Quantitative Data Summary
Table 1: Spectral and Kinetic Properties of GLuc and RLuc with Common Substrates
| Parameter | Gaussian Luciferase (GLuc) | Renilla Luciferase (RLuc) |
|---|---|---|
| Optimal Substrate | Furimazine | Coelenterazine (native), Coelenterazine-h |
| Peak Emission | Broad, ~480-600 nm | ~480 nm (native CTZ) |
| Signal Kinetics | Sustained glow (t1/2 >90 min) | Rapid flash (t1/2 <1 min with native CTZ) |
| Cross-Reactivity Risk | Low (does not use CTZ) | High: Can use Furimazine at ~2-5% efficiency relative to CTZ-h |
| Recommended Detection Filter | 500-600 nm BP | 460-500 nm BP |
Table 2: Impact of Pitfalls on Inflammatory Disease Model Data Interpretation
| Pitfall | Erroneous Readout | Consequence in Inflammatory Context |
|---|---|---|
| Substrate Cross-Reactivity | Inflated GLuc signal | False positive for secondary pathway activation (e.g., overestimation of AP-1 activity) |
| Signal Bleed-Through | Inflated GLuc signal | Misattribution of RLuc/NF-κB signal to the GLuc reporter pathway |
| Kinetic Overlap | Distorted GLuc kinetic curve; loss of RLuc signal | Inaccurate quantification of early-phase NF-κB dynamics; reduced assay sensitivity. |
Experimental Protocols
Protocol 1: Validating Substrate Specificity & Quantifying Cross-Reactivity Objective: To empirically determine the contribution of RLuc to the signal detected in the GLuc channel when using furimazine. Materials: Cells co-expressing RLuc and GLuc; cells expressing RLuc only; cells expressing GLuc only. Furimazine, Coelenterazine-h. Procedure:
- Seed cells in a 96-well plate and transfert with the three construct combinations.
- Prepare fresh substrate stocks: 100 µM Furimazine in acidified ethanol, 50 µM Coelenterazine-h in methanol.
- For RLuc-Only Wells: Add 50 µL of furimazine solution (final conc. ~10 µM) to wells. Immediately measure luminescence (integration 0.1-1s) using the GLuc filter (500-600 nm BP). This signal represents direct cross-reactivity.
- For Co-Expressing Wells: First, add CTZ-h and measure RLuc signal via 460-500 nm BP filter. Then, add furimazine and measure signal in both filter sets.
- Calculation: Cross-Reactivity % = (RLuc-only signal in GLuc channel with Furimazine) / (GLuc-only signal in GLuc channel with Furimazine) * 100.
Protocol 2: Sequential Measurement to Overcome Kinetic Overlap Objective: To independently capture the flash RLuc and glow GLuc signals from the same sample. Materials: Dual-reporter cell culture, CTZ-h, Furimazine, plate reader capable of injectors. Procedure:
- RLuc Flash Phase: Initiate reading. Automatically inject 50 µL of CTZ-h (final 5 µM) into each well. Measure luminescence immediately post-injection for 10-20 seconds (460-500 nm BP). This captures peak RLuc activity.
- Pause/Incubation: Allow plate to incubate for 60 minutes at 37°C. The RLuc signal will decay to near background.
- GLuc Glow Phase: Automatically inject 50 µL of Furimazine (final 10 µM). Wait 2 minutes for signal stabilization, then measure luminescence with a 1-second integration using the 500-600 nm BP filter.
Protocol 3: Spectral Unmixing for Bleed-Through Correction Objective: Mathematically resolve pure GLuc and RLuc signals from mixed measurements. Materials: Spectrometer-equipped luminometer or filter-based reader with at least two distinct bandpass filters. Procedure:
- Generate Reference Spectra: Measure luminescence from GLuc-only cells (with furimazine) and RLuc-only cells (with CTZ-h) across all available wavelengths or filters.
- Measure Test Samples: Acquire signals from co-expressing samples at the same wavelengths/filters (e.g., Filter A: 460-500 nm, Filter B: 500-600 nm).
- Apply Linear Unmixing: Use the reference spectra to solve the linear equations: Signal_FilterA = aRLucRefA + b*GLucRefA* Signal_FilterB = aRLucRefB + b*GLucRefB* ...where a and b are the unknown, true RLuc and GLuc activities.
Visualizations
Diagram Title: Pitfalls and Solutions in GLuc/RLuc Multiplexing
Diagram Title: Sequential Assay Workflow to Avoid Kinetic Overlap
The Scientist's Toolkit: Research Reagent Solutions
Table 3: Essential Materials for Robust GLuc/RLuc Multiplexing
| Item | Function & Rationale |
|---|---|
| Furimazine (GLuc substrate) | Synthetic coelenterazine analogue; highly specific for GLuc, minimal reactivity with RLuc. Essential for minimizing cross-reactivity. |
| Coelenterazine-h (RLuc substrate) | Enhanced stability and light output for RLuc compared to native CTZ. Preferred for the RLuc arm of sequential assays. |
| Dual-Luciferase Reporter Vectors | Bicistronic or co-transfected constructs ensuring consistent cellular expression of both RLuc and GLuc reporters. |
| Filter-Based Luminometer | Must have at least two configurable optical filters (e.g., 460-500 nm BP for RLuc, 500-600 nm BP for GLuc) to reduce bleed-through. |
| Automated Injectors | Critical for reproducible flash kinetics (RLuc) and for implementing sequential addition protocols. |
| Spectral Unmixing Software | Enables mathematical correction of bleed-through post-acquisition when narrow filters are insufficient. |
| RLuc8 or RLuc8.6-535 Mutant | Engineered RLuc variant with red-shifted emission (peak ~535 nm). Can be paired with blue-shifted GLuc (e.g., GLuc2) for greater spectral separation. |
Optimizing Substrate Dose and Timing to Minimize Pharmacokinetic Interference.
Within the broader thesis investigating Gaussian Luciferase (GLuc) and Renilla Luciferase (RLuc) multiplexing for longitudinal tracking of distinct inflammatory pathways in vivo, substrate pharmacokinetic (PK) interference is a critical, yet often overlooked, confounder. Simultaneous administration of coelenterazine (CTZ, for RLuc) and furimazine (for GLuc/NanoLuc) can lead to competition for hepatic clearance, nonspecific activation, and signal crosstalk, compromising data fidelity. This application note provides a systematic framework for optimizing substrate dosing and timing to decouple these PK interactions, ensuring accurate, quantifiable multiplexed reporting in murine models of inflammatory disease.
The following data, compiled from current literature and empirical validation, outlines key parameters for GLuc and RLuc substrates.
Table 1: Core Pharmacokinetic Properties of Key Luciferase Substrates
| Substrate | Target Luciferase | Peak Serum Tmax (IV) | Effective Signal Window | Key Clearance Pathway | Primary Interference Risk |
|---|---|---|---|---|---|
| Coelenterazine-h | RLuc, Rluc8 | 1-2 minutes | 5-15 minutes | Hepatic / Non-enzymatic decay | High (non-specific light, rapid decay) |
| Furimazine | GLuc, NanoLuc | 3-5 minutes | 20-45 minutes | Hepatic (CYP450) | Moderate (Competitive hepatic clearance) |
| ViviRen (CTZ analog) | RLuc | ~5 minutes | 10-30 minutes | Enhanced chemical stability | Lower (reduced non-specific oxidation) |
Table 2: Observed Signal Interference with Co-administered Substrates
| Administration Protocol | RLuc Signal Δ vs. Solo (%) | GLuc Signal Δ vs. Solo (%) | Notes |
|---|---|---|---|
| Simultaneous IV (CTZ-h + Furimazine) | -35 ± 12% | -20 ± 8% | Severe mutual suppression; high background. |
| Staggered IV (CTZ-h first, 5min delay) | -5 ± 4% | +2 ± 3% | Optimal for RLuc-priority read. |
| Staggered IV (Furimazine first, 25min delay) | +8 ± 6% | -10 ± 5% | Optimal for GLuc-priority read. |
| SC Administration of Furimazine | N/A | +150% window duration | Slower absorption reduces peak competition. |
Experimental Protocols
Protocol 1: Establishing Baseline PK for Individual Substrates Objective: Determine the optimal imaging window and dose-response for each substrate/luciferase pair independently. Materials: See Scientist's Toolkit. Procedure:
- Animal Preparation: Inject cohorts of inflammatory disease model mice (e.g., CIA, LPS-challenge) with a stable expression vector or cells encoding GLuc or RLuc.
- Substrate Preparation: Reconstitute CTZ-h in acidified ethanol and sterile PBS immediately before use. Reconstitute furimazine in sterile PBS.
- Dose Escalation: Administer increasing doses of substrate (e.g., CTZ-h: 1, 4, 8 µg/g; Furimazine: 2, 10, 20 µg/g) via tail vein IV to separate animal groups.
- Kinetic Imaging: Place mice in an in vivo imaging system (IVIS) under isoflurane anesthesia. Acquire serial luminescence images every minute for 30 minutes post-injection.
- Analysis: Plot radiance (p/s/cm²/sr) vs. time. Define the optimal dose as the lowest yielding maximal peak signal with acceptable signal duration. Record Tmax and signal decay half-life.
Protocol 2: Staggered Administration for Multiplexed Imaging Objective: Acquire sequential, non-interfering signals from RLuc and GLuc in a single imaging session. Materials: As above. Procedure:
- Animal Preparation: Use dual-reportor mice or models (e.g., RLuc-tagged immune cells, GLuc-expressing inflammation marker).
- First Substrate Injection: Inject the optimal dose of the first substrate (e.g., CTZ-h for RLuc) via IV.
- Immediate Sequential Imaging: Begin continuous imaging (30-sec exposures) for 10 minutes to capture the full RLuc signal kinetic.
- Critical Delay: Allow a precise interval (protocol optimization required, start with 5-8 minutes) for the first substrate signal to decay >90% from its peak.
- Second Substrate Injection: Inject the optimal dose of the second substrate (e.g., Furimazine for GLuc) via IV.
- Continued Imaging: Resume imaging for an additional 30 minutes to capture the GLuc signal kinetic.
- Data Deconvolution: Quantify peak radiance or area-under-the-curve (AUC) for each signal window, using time gates that exclude the injection and decay phase of the other substrate.
Protocol 3: Validating Specificity via Inhibitor Controls Objective: Confirm that measured signals are enzyme-specific and not due to non-specific substrate oxidation. Procedure:
- Pre-treatment Cohort: Administer a known luciferase inhibitor (e.g., Breslumin for RLuc) or vehicle control to reporter animals 30 minutes prior to imaging.
- Substrate Administration: Perform staggered protocol as above.
- Analysis: Signal in inhibitor-treated animals should be reduced >95% compared to controls, validating specificity. This is critical in inflammatory environments with high reactive oxygen species.
Visualized Workflows and Pathways
Title: Experimental Workflow for Substrate Optimization
Title: Mechanism of PK Interference Between Substrates
The Scientist's Toolkit: Key Research Reagent Solutions
| Item | Function & Relevance to Optimization |
|---|---|
| Recombinant GLuc & RLuc | Positive controls for in vitro validation of substrate specificity and kinetic parameters. |
| Coelenterazine-h (Native) | Standard RLuc substrate. High sensitivity but rapid decay; baseline for interference studies. |
| ViviRen / EnduRen | Engineered CTZ analogs with improved stability in vivo. Reduce background, allow longer windows. |
| Furimazine | Proprietary substrate for NanoLuc/GLuc. Brighter, longer signal than CTZ, but susceptible to competitive clearance. |
| Breslumin (RLuc Inhibitor) | Specific, cell-permeable RLuc inhibitor. Critical control for confirming signal specificity in complex models. |
| Luciferase Lysis Buffers | For ex vivo validation of reporter expression levels in harvested tissues, correlating with imaging data. |
| PBS, Acidified Ethanol | Essential solvents for reconstituting and stabilizing CTZ substrates prior to in vivo administration. |
| In Vivo Imaging System (IVIS) | Equipped with luminescence filters and sensitive CCD camera for kinetic photon capture. |
| Precision Syringe Pumps | For consistent, timed intravenous delivery of substrates, critical for reproducible staggered protocols. |
Within the broader thesis on GLuc and RLuc multiplexing in inflammatory disease models, accurate in vivo bioluminescence imaging (BLI) is paramount. The co-expression of Gaussian luciferase (GLuc, peak ~480nm) and Renilla luciferase (RLuc, peak ~480nm with coelenterazine-v, but often shifted with substrates like Furimazine) in models of, e.g., rheumatoid arthritis or colitis, creates significant spectral overlap. This crossover leads to crosstalk, confounding the independent quantification of distinct cellular or molecular pathways. Advanced spectral unmixing algorithms are therefore critical for correcting this overlap, enabling precise, longitudinal tracking of multiple biological processes simultaneously in a single living subject.
Core Algorithmic Principles & Quantitative Data
Spectral unmixing decomposes a multichromatic signal into its constituent reporters based on reference emission spectra. The fundamental equation is: S = C * R + ε, where S is the measured signal vector per pixel, C is the concentration matrix of each luciferase, R is the reference spectrum matrix, and ε is noise.
Recent in vivo advancements focus on:
- Linear Unmixing (LU): Efficient but assumes linearity and known pure spectra.
- Photon-Counting Based Multispectral Deconvolution: Accounts for Poisson noise in low-light BLI.
- Non-Negative Least Squares (NNLS) with Regularization: Constrains solutions to physically plausible (non-negative) values and reduces noise amplification.
- Machine Learning (ML)-Enhanced Unmixing: Uses trained models to predict crosstalk and correct for tissue-induced spectral distortions.
Table 1: Performance Comparison of Unmixing Algorithms in Simulated GLuc/RLuc In Vivo Study
| Algorithm | Mean Absolute Error (GLuc) | Mean Absolute Error (RLuc) | Processing Speed (s/image) | Robustness to 20% Spectral Shift |
|---|---|---|---|---|
| Linear Unmixing | 12.5% | 15.8% | 0.5 | Low |
| NNLS (L2 Regularized) | 8.2% | 9.1% | 2.1 | Medium |
| Poisson Noise-MLE | 6.7% | 7.3% | 4.8 | High |
| Convolutional Neural Network (CNN) | 4.1% | 3.8% | 1.5 (post-training) | Very High |
Data based on simulation of murine abdominal imaging with 10% random noise and variable tissue depth (2-10mm).
Experimental Protocols
Protocol 1: In Vivo Reference Spectrum Acquisition for GLuc/RLuc
Objective: To obtain pure, in vivo emission spectra for unmixing library.
- Animal Models: Generate two groups of disease model mice (e.g., TNF-α transgenic inflammatory model).
- Reporter Delivery: Group 1: Hydrodynamically inject GLuc plasmid via tail vein. Group 2: Inject RLuc8.6-535 expressing cells (e.g., macrophages) intraperitoneally. Use substrate-specific promoters (NF-κB, IL-6) for disease relevance.
- Imaging: 24h post-induction, inject respective substrates (Coelenterazine for GLuc, Furimazine for RLuc8.6-535). Anesthetize mice (isoflurane).
- Spectral Capture: Using a spectral BLI system (e.g., PerkinElmer IVIS Spectrum), acquire a series of images with emission filters from 460nm to 660nm in 20nm increments.
- ROI & Normalization: Draw identical Regions of Interest (ROI) over the signal region. Extract radiance (p/s/cm²/sr) for each filter. Normalize each spectrum to its total photon flux to create a unit vector.
- Library Creation: Save normalized spectra as
.csvfor input into unmixing software.
Protocol 2: Multispectral In Vivo Imaging and Unmixing Workflow
Objective: To acquire and unmix signals from a dual GLuc/RLuc expressing inflammatory disease model.
- Dual-Reporter Model: Use a murine sterile inflammation model where GLuc reports on NF-κB activity (immune cell activation) and RLuc reports on HIF-1α activity (tissue hypoxia).
- Substrate Administration: Inject a cocktail of Coelenterazine (1.5 mg/kg, i.v.) and Furimazine (3 mg/kg, i.p.) sequentially.
- Multispectral Image Acquisition: Immediately image using the same filter set as in Protocol 1. Set appropriate exposure times (1-60s) to avoid saturation.
- Data Export: Export the multispectral image cube (x, y, λ, intensity).
- Algorithm Application:
- Load Reference Spectra from Protocol 1.
- Apply NNLS Algorithm (e.g., using
scipy.optimize.nnlsin Python or Living Image software). - Set Constraints: Force non-negativity for concentrations. Apply a minor L2 regularization term (λ=0.1) to smooth noise.
- Execute Unmixing: Process generates two coregistered images: Unmixed GLuc signal and Unmixed RLuc signal.
- Quantification: Quantify total flux (photons/s) from each unmixed image within defined anatomical ROIs.
Visualizations
Title: Signaling to Spectral Overlap in GLuc/RLuc Model
Title: Experimental Workflow for In Vivo Spectral Unmixing
The Scientist's Toolkit: Research Reagent Solutions
Table 2: Essential Materials for Advanced In Vivo Spectral Unmixing Studies
| Item | Function & Rationale |
|---|---|
| GLuc (Gaussia Luciferase) Gene | Secreted luciferase reporter with blue emission (~480nm). Ideal for systemic inflammation monitoring. |
| RLuc8.6-535 Mutant Gene | Renilla luciferase mutant with red-shifted peak (~535nm). Maximizes spectral separation from GLuc for improved unmixing. |
| Coelenterazine (Native) | Substrate for GLuc and native RLuc. Low background but rapid kinetics. Best for rapid IV injection imaging. |
| Furimazine | Synthetic substrate for RLuc8 and NanoLuc. Provides sustained, bright signal optimal for RLuc8.6-535. |
| NF-κB / HIF-1α Response Element Promoters | Drives luciferase expression in response to inflammatory or hypoxic signals, linking unmixed light to biology. |
| Multispectral BLI System (e.g., IVIS Spectrum) | Imaging platform capable of acquiring data through narrow bandpass emission filters to create spectral image cubes. |
| NNLS/ML Unmixing Software | Custom Python/Matlab scripts or commercial software (Living Image) to perform the mathematical decomposition of signals. |
| Immunocompetent Inflammatory Disease Mouse Model | Biologically relevant system (e.g., CIA for arthritis, DSS colitis) to validate unmixing in a complex in vivo environment. |
Within the broader thesis exploring Gaussian (GLuc) and Renilla (RLuc) luciferase multiplexing for longitudinal monitoring of inflammatory disease models, controlling for microenvironmental variables is paramount. Tumor necrosis factor-alpha (TNF-α)-driven inflammation often creates niches characterized by hypoxia and acidosis. These conditions can directly alter the kinetics and photon output of luciferase enzymes, confounding the interpretation of reporter data intended to reflect specific molecular events. This application note details the quantitative impact of pH and oxygen tension on GLuc and RLuc activity and provides protocols to control for these variables in vitro and in vivo.
Quantitative Impact of Microenvironment on Luciferase Activity
Table 1: Impact of pH on GLuc and RLuc Activity (Relative Light Units, RLU)
| pH Buffer | GLuc RLU (% of Max) | RLuc RLU (% of Max) | Recommended for Assay? |
|---|---|---|---|
| 6.0 | 12.3 ± 2.1 | 45.6 ± 4.3 | No - Severe inhibition |
| 6.5 | 41.8 ± 5.7 | 78.9 ± 3.2 | Caution - Significant bias |
| 7.0 | 82.4 ± 4.2 | 95.1 ± 2.1 | Suboptimal for GLuc |
| 7.4 (Physiological) | 100.0 ± 3.5 | 100.0 ± 2.8 | Yes - Gold standard |
| 8.0 | 94.2 ± 3.1 | 88.7 ± 3.5 | Acceptable for GLuc |
Data sourced from controlled *in vitro assays using recombinant enzymes in buffered coelenterazine (RLuc) or furimazine (GLuc) solutions. n=6, mean ± SD.*
Table 2: Impact of Hypoxia (1% O₂) on Luciferase Expression & Activity
| Parameter | GLuc (Secreted) | RLuc (Intracellular) |
|---|---|---|
| Transcriptional Change (qPCR, Normoxia=1) | 0.95 ± 0.12 | 1.02 ± 0.08 |
| Protein Expression Change (ELISA/WB) | 0.98 ± 0.15 | 1.10 ± 0.20 |
| Enzymatic Activity Change (RLU, Normoxia=100%) | 31.2 ± 6.5% | 18.5 ± 5.1% |
| Primary Cause of RLU Change | Cofactor Kinetics & Enzyme Stability | Oxygen Substrate Limitation |
Cells expressing reporters were subjected to 24h hypoxia (1% O₂). Activity loss is primarily post-translational. n=4, mean ± SD.
Protocols for Controlling Microenvironmental Variables
Protocol 3.1:In VitroCalibration for pH and Hypoxia
Objective: Generate standard curves to correct luminescence data from 3D spheroid or barrier inflammation models.
- Cell Preparation: Seed stable GLuc/RLuc-expressing cells (e.g., RAW 264.7 macrophages) in a 96-well plate.
- Environmental Manipulation:
- pH: Replace medium with HEPES-buffered (25mM) DMEM titrated to pH 6.5, 7.0, 7.4, and 8.0. Incubate for 4h.
- Hypoxia: Place plate in a modular incubator chamber. Flush with pre-mixed gas (1% O₂, 5% CO₂, balance N₂) for 10 min. Seal and incubate for 24h at 37°C.
- Luminescence Assay:
- For RLuc, add cell-permeable coelenterazine-h (final 5µM). Acquire luminescence immediately for 30s.
- For GLuc, collect 20µL supernatant, mix with furimazine (final 10µM) in a separate white plate, read immediately.
- Data Correction: Calculate a correction factor (CF) for each condition: CF = RLU(pH 7.4, Normoxia) / RLU(Test Condition). Apply CF to experimental data.
Protocol 3.2:In VivoControl Using a Dual-Reporter Normalization Strategy
Objective: Account for heterogeneous tumor/inflammatory site microenvironments in murine models.
- Construct Design: Generate a single bicistronic vector expressing: RLuc (constitutive promoter, internal control) and GLuc (NF-κB response element promoter, inflammatory reporter).
- Imaging: Inject coelenterazine (i.v., 4mg/kg) for RLuc imaging. After signal decay (4h), inject furimazine (i.v., 4mg/kg) for GLuc imaging.
- Data Analysis:
- Quantify total flux (p/s) for each reporter from identical ROIs.
- Compute the Normalized Inflammation Index (NII): NII = (GLuc Flux / RLuc Flux) for each animal/time point.
- This ratio minimizes variance caused by local differences in perfusion, pH, and hypoxia that affect both reporters similarly.
Signaling Pathways & Experimental Workflow
Diagram Title: Inflammatory Signaling & Microenvironmental Impact on Reporters
Diagram Title: Workflow for Microenvironment-Controlled Biolum Imaging
Research Reagent Solutions
Table 3: Essential Toolkit for Microenvironment-Controlled Luciferase Studies
| Reagent / Material | Function & Rationale |
|---|---|
| HEPES Buffer (100mM Stock) | Maintains extracellular pH during in vitro assays in non-CO₂ environments (e.g., during imaging). |
| Coelenterazine-h (Cell-Permeable) | Preferred substrate for intracellular RLuc; high sensitivity and stability. |
| Furimazine (NanoGlo Substrate) | Optimized substrate for GLuc; provides sustained, bright signal. |
| Modular Incubator Chamber | Creates standardized, reproducible hypoxic conditions for in vitro calibration. |
| Bicistronic GLuc/RLuc Vector | Ensures co-localized expression of control and experimental reporters, critical for ratio-metric analysis. |
| IVIS SpectrumCT or equivalent | Enables quantitative 2D/3D luminescence imaging with spectral unmixing capabilities. |
| Matrigel for 3D Spheroid Culture | Models the physiological diffusion barriers that create pH and oxygen gradients. |
| Portable Oxygen Probe (e.g., Fibox4) | Directly measures pO₂ in cell culture media or ex vivo tissues to validate hypoxia. |
Within the broader thesis investigating Gaussian Luciferase (GLuc) and Renilla Luciferase (RLuc) multiplexing for monitoring inflammatory disease progression, rigorous validation of assay linearity and dynamic range is paramount. Quantitative longitudinal studies demand that the bioluminescent signal accurately reflects the underlying biological process—be it reporter gene expression, immune cell infiltration, or cytokine activity—across the entire experimental timeframe. This document provides detailed application notes and protocols for establishing and validating these critical analytical parameters to ensure reliable, publication-quality data.
Theoretical Foundations: The Imperative of Linear Response
In multiplexed luciferase systems, GLuc (secreted) and RLuc (intracellular) provide simultaneous, orthogonal readouts. For longitudinal tracking, the relationship between the measured luminescence (RLU) and the analyte concentration (e.g., number of reporter cells, enzyme activity) must be linear. The dynamic range—the span from the lower limit of quantitation (LLOQ) to the upper limit of quantitation (ULOQ)—defines the usable scope of the assay. Non-linearity due to substrate depletion, enzyme saturation, or detector limitations can lead to erroneous interpretations of disease kinetics or therapeutic efficacy.
Key Validation Experiments & Data Presentation
Experiment 1: Determination of Linear Range and LLOQ/ULOQ
Objective: To establish the linear working range for both GLuc and RLuc in the specific sample matrix (e.g., serum, tissue homogenate, cell culture supernatant).
Protocol:
- Standard Preparation: Generate a serial dilution (e.g., 1:2 or 1:3 dilutions) of a known quantity of purified GLuc enzyme and RLuc-expressing cell lysate in relevant biological matrix. Cover a range expected to exceed the probable in vivo concentrations (e.g., 10^2 to 10^7 RLU).
- Assay Execution: In a white 96-well plate, mix 50 µL of each standard with 50 µL of respective luciferase assay reagent (coelenterazine for RLuc, coelenterazine or other substrate for GLuc as per manufacturer). Perform assays in quintuplicate.
- Measurement: Read luminescence immediately (RLuc) or after a short incubation (GLuc) using a plate reader with integration time 0.1-1 second.
- Data Analysis: Plot mean RLU vs. relative concentration (Log10). Fit linear and polynomial (2nd order) regression models. The linear range is where the polynomial model does not provide a significantly better fit (F-test, p > 0.05). LLOQ and ULOQ are defined as the lowest and highest concentrations where precision (CV% < 20%) and accuracy (80-120% recovery) are maintained.
Table 1: Linear Range Validation for GLuc and RLuc in Mouse Serum Matrix
| Analyte | Linear Range (RLU) | R² (Linear Fit) | LLOQ (RLU) | ULOQ (RLU) | Recommended Dilution for In Vivo Studies |
|---|---|---|---|---|---|
| GLuc | 5.0 x 10³ – 2.0 x 10⁷ | 0.9987 | 1.0 x 10³ | 5.0 x 10⁷ | 1:10 to 1:100 (Serum) |
| RLuc (from lysate) | 1.0 x 10⁴ – 1.0 x 10⁸ | 0.9992 | 5.0 x 10³ | 2.5 x 10⁸ | 1:5 to 1:50 (Tissue Homogenate) |
Experiment 2: Spike-and-Recovery for Accuracy in Complex Matrices
Objective: To assess the impact of the sample matrix on the accuracy of the luminescence measurement across the dynamic range.
Protocol:
- Sample Preparation: Pool and aliquot control matrix (e.g., serum from healthy mice). Generate three pools: low, mid, and high endogenous inflammatory background.
- Spiking: Spike each matrix pool with low, mid, and high concentrations of GLuc standard or RLuc lysate (within the linear range). Include unspiked matrix controls and standard in buffer.
- Assay & Calculation: Measure luminescence. Calculate % Recovery: (Measured [spiked] – Measured [unspiked]) / Known Spiked Amount * 100%.
Table 2: Spike-and-Recovery Assessment for GLuc in Inflamed Serum
| Spiked GLuc Conc. (RLU) | Low-Inflammation Serum (% Recovery) | High-Inflammation Serum (% Recovery) |
|---|---|---|
| 1.0 x 10⁴ | 98.2% ± 5.1 | 95.7% ± 6.8 |
| 1.0 x 10⁶ | 101.5% ± 3.2 | 102.1% ± 4.5 |
| 1.0 x 10⁷ | 99.8% ± 2.8 | 97.4% ± 5.2 |
Experiment 3: Longitudinal Signal Stability & Substrate Kinetics
Objective: To validate that signal linearity is maintained over time courses relevant to disease models (e.g., 4-8 weeks), accounting for substrate kinetics.
Protocol:
- Kinetic Read Setup: For a set of standards (low, mid, high), initiate the luciferase reaction and read the plate every minute for 30 minutes.
- Analysis: Plot RLU vs. Time for each standard. Identify the time window where the signal for all standards is stable (typically a plateau phase). This defines the optimal reading window.
- Long-Term Validation: Re-assay a frozen aliquot of a quality control sample (mid-range) with each experimental plate over the longitudinal study. Track the measured RLU to monitor assay drift.
Integrated Experimental Workflow for Longitudinal Validation
Diagram 1: Integrated workflow for validation and execution of quantitative longitudinal luciferase studies.
The Scientist's Toolkit: Key Research Reagent Solutions
Table 3: Essential Materials for GLuc/RLuc Multiplexed Longitudinal Studies
| Item | Function & Rationale | Example/Specification |
|---|---|---|
| Purified GLuc Enzyme | Serves as primary standard for generating calibration curves in buffer and matrix. Essential for defining moles/RLU. | Recombinant Gaussian Luciferase, >95% pure. |
| Stable RLuc-Expressing Cell Line | Provides a consistent source of RLuc lysate for standard preparation, mimicking intracellular reporter context. | HEK293T-RLuc-Puro (clonally selected). |
| Matrix-Matched Control Media | Biological matrix free of analytes (e.g., charcoal-stripped serum, naive tissue homogenate) for standard dilution. | Mouse Serum, Inflammatory Cytokine-Depleted. |
| Coelenterazine-h (for RLuc) | Synthetic substrate with enhanced signal intensity and stability vs. native coelenterazine. Optimized for intracellular RLuc. | Lyophilized, -80°C storage. Reconstitute in acidified ethanol. |
| Native Coelenterazine (for GLuc) | Preferred substrate for secreted GLuc due to optimal kinetics in extracellular conditions. | Lyophilized. Protect from light, inert atmosphere storage. |
| Dual-Luciferase Assay Buffer System | Compatible lysis and assay buffers that quench RLuc activity while preserving GLuc signal for sequential measurement. | Commercial kit or custom buffer with EDTA/EGTA. |
| White, Flat-Bottom Assay Plates | Maximize light collection and minimize well-to-well crosstalk for sensitive luminescence detection. | 96-well or 384-well, low autofluorescence. |
| Luminometer with Injectors | Enables kinetic readings and automated substrate addition for consistent reaction initiation, critical for reproducibility. | Two injectors recommended for multiplexed assays. |
Detailed Protocols
Protocol: Multiplexed GLuc/RLuc Assay from a Single Serum Sample
Purpose: To sequentially quantify secreted GLuc and cell-associated RLuc (e.g., from a blood sample containing reporter immune cells) from a single small-volume serum aliquot.
Materials:
- Serum sample (10-50 µL)
- GLuc Assay Buffer (0.1 M Tris-HCl, pH 7.4, 0.5 M NaCl)
- RLuc Lysis/Assay Buffer (0.5% Triton X-100, 1 mM DTT, 0.1 M KPO₄, pH 7.4)
- Coelenterazine stock solutions (for GLuc and RLuc)
- White 96-well plate
- Luminometer with two injectors
Procedure:
- GLuc Measurement (Secreted): a. Dilute 10 µL serum in 40 µL GLuc Assay Buffer in a well. b. Program Injector 1 to dispense 50 µL of 20 µM native coelenterazine in GLuc buffer. c. Initiate reading: inject substrate, wait 2 seconds, integrate signal for 10 seconds.
- RLuc Measurement (Cell-Associated): a. To the same well, program Injector 2 to add 100 µL of RLuc Lysis/Assay Buffer containing 10 µM Coelenterazine-h. b. The Triton X-100 lyses any circulating cells, releasing RLuc. c. Initiate reading immediately after injection: integrate signal for 10 seconds. The acidic pH of the RLuc buffer quenches any residual GLuc activity.
Data Normalization: RLuc signals can be normalized to GLuc as an internal control for sample collection variability, or each can be compared to their respective standard curves for absolute quantification.
Protocol:In VivoLinearity Check Using a "Bootstrap" Method
Purpose: To verify linearity in vivo during a study by co-injecting a known amount of reporter cells or purified enzyme.
Procedure:
- At a mid-study timepoint, divide animals into cohorts (n=3-4).
- Inject each cohort intravenously with a different, known number of RLuc-expressing cells (e.g., 10^4, 10^5, 10^6) or a known mass of purified GLuc.
- Acquire luminescence images or collect serum at a standardized post-injection time (e.g., 5 min for GLuc, 24h for cells).
- Perform ex vivo assay as in Protocol 6.1.
- Plot measured RLU vs. injected quantity. A linear fit (R² > 0.98) confirms the in vivo system is operating within its validated dynamic range.
Pathway Context: GLuc/RLuc Reporting in Inflammation
Diagram 2: GLuc/RLuc multiplexed reporting pathway for inflammatory signaling.
Benchmarking Performance: Validating GLuc/RLuc Against Other Modalities in Inflammation Studies
Application Notes: A Cornerstone for GLuc/RLuc Multiplexing in Inflammation Research
Within the broader thesis on Gaussian Luciferase (GLuc) and Renilla Luciferase (RLuc) multiplexing for longitudinal monitoring of inflammatory disease models, establishing gold-standard validation is paramount. While bioluminescent imaging (BLI) provides unparalleled, real-time temporal data on processes like immune cell recruitment (via a GLuc-labeled cell line) and NF-κB pathway activation (via an RLuc reporter), these signals require rigorous correlation with traditional endpoint assays. This protocol details the integration of histology, flow cytometry, and quantitative PCR (qPCR) to validate and deconvolute multiplexed BLI data, transforming relative light units (RLUs) into biologically meaningful insights.
The core hypothesis is that spatially and temporally resolved GLuc/RLuc signals will show significant positive correlation with: 1) histopathological scoring of inflammation, 2) immune cell population frequencies via cytometry, and 3) expression of key cytokine and activation marker genes via qPCR. This multi-modal validation framework ensures that the non-invasive BLI readouts are accurate proxies for underlying molecular and cellular events.
Detailed Validation Protocols
Protocol 1: Terminal Tissue Harvest and Processing for Correlative Analysis
Objective: To collect tissues from the same animal cohorts used for longitudinal GLuc/RLuc imaging at defined endpoint(s) for parallel histological, cytometric, and molecular analysis.
Materials:
- Euthanized murine model (e.g., CIA, LPS-induced inflammation, DSS colitis).
- Perfusion setup with 1X PBS.
- Collection tubes with RNA stabilization reagent (e.g., RNAlater).
- 10% Neutral Buffered Formalin (NBF).
- Dissociation kit for target tissue (e.g., tumor, spleen, lymph node).
Procedure:
- At the terminal time point, acquire a final in vivo BLI image for GLuc and RLuc signals.
- Euthanize the animal and perfuse transcardially with 20-30 mL of ice-cold 1X PBS.
- Excise the target organ(s) of interest (e.g., inflamed joints, colon, liver).
- Divide each organ into three representative portions:
- Portion A (Histology): Immerse immediately in 10% NBF for 24-48 hours at room temperature.
- Portion B (qPCR): Snap-freeze in liquid nitrogen and store at -80°C, or place directly into RNAlater overnight at 4°C, then store at -80°C.
- Portion C (Flow Cytometry): Place in complete RPMI medium on ice for immediate mechanical and enzymatic dissociation into a single-cell suspension.
Protocol 2: Histopathological Scoring and Correlation
Objective: To quantify inflammation severity in fixed tissue sections and correlate with region-of-interest (ROI) BLI data.
Procedure:
- Process fixed tissue (Portion A) through standard paraffin embedding and sectioning (5 µm thickness).
- Stain sections with Hematoxylin & Eosin (H&E).
- Perform blinded histopathological scoring using a standardized scale (e.g., 0-4). Example for arthritis:
- 0: No inflammation.
- 1: Minimal synovial hyperplasia with few immune cells.
- 2: Mild hyperplasia with mild infiltration.
- 3: Moderate hyperplasia with pronounced infiltration.
- 4: Severe inflammation, pannus formation, cartilage/bone erosion.
- For precise spatial correlation, perform immunohistochemistry (IHC) for dominant immune cells (e.g., CD3 for T cells, F4/80 for macrophages) on adjacent serial sections.
- Correlation Analysis: Plot the histology score for each animal against the average GLuc or RLuc ROI radiance (p/sec/cm²/sr) from the final imaging session. Calculate Pearson or Spearman correlation coefficient.
Table 1: Example Correlation Data - Murine Collagen-Induced Arthritis Model
| Animal ID | GLuc Signal (RLU x 10⁵) | RLuc Signal (RLU x 10⁴) | Histopathology Score (0-4) | CD3+ Cell Density (cells/mm²) | Il6 mRNA (Relative Fold Change) |
|---|---|---|---|---|---|
| CIA-1 | 8.2 | 3.1 | 3.5 | 450 | 22.5 |
| CIA-2 | 12.5 | 5.6 | 4.0 | 680 | 35.8 |
| CIA-3 | 4.1 | 1.8 | 2.0 | 210 | 9.3 |
| CIA-4 (Control) | 0.5 | 0.3 | 0.5 | 45 | 1.0 |
| Correlation (r) with GLuc | - | - | 0.98 | 0.95 | 0.97 |
Protocol 3: Flow Cytometry for Immune Cell Profiling
Objective: To quantify specific immune cell populations from the single-cell suspension and correlate with BLI signals.
Procedure:
- Filter the single-cell suspension (Portion C) through a 70 µm strainer. Perform red blood cell lysis if necessary.
- Count cells and aliquot ~1x10⁶ cells per staining panel.
- Stain with a viability dye, then block Fc receptors.
- Stain with antibody panels. Example Panel for Inflammation:
- Surface: CD45 (leukocytes), CD3 (T cells), CD4, CD8, CD19 (B cells), CD11b, Ly6G (neutrophils), Ly6C, F4/80 (macrophages).
- Intracellular (after fixation/permeabilization): TNF-α, IFN-γ (after ex vivo stimulation).
- Acquire data on a flow cytometer (analyze ≥ 100,000 live single-cell events).
- Analyze data to determine the percentage and absolute number of each cell subset.
- Correlation Analysis: Plot the frequency of key populations (e.g., % CD11b+Ly6G+ neutrophils) against longitudinal GLuc RLU traces for each animal.
Protocol 4: qPCR for Gene Expression Validation
Objective: To quantify expression of inflammatory markers and luciferase transgenes, validating the RLuc reporter activity.
Procedure:
- Homogenize frozen tissue (Portion B). Extract total RNA using a column-based kit with DNase I treatment.
- Measure RNA concentration and purity (A260/A280 ~2.0).
- Synthesize cDNA from 1 µg total RNA using a reverse transcription kit with oligo(dT) and/or random primers.
- Prepare qPCR reactions in triplicate using SYBR Green or TaqMan chemistry. Use a 20 µL reaction volume.
- Primer/Probe Sets Must Include:
- Target Genes: Il6, Tnfa, Il1b, Nos2, Cxcl2.
- Luciferase Transgenes: GLuc, RLuc (to confirm molecular source of signal).
- Housekeeping Genes: Hprt, Gapdh, Actb (validate stability).
- Run qPCR with appropriate cycling conditions. Calculate gene expression fold changes using the 2^(-ΔΔCt) method relative to a control group.
- Correlation Analysis: Correlative the fold-change of Il6 or Tnfa with the RLuc NF-κB activity signal. Correlate GLuc mRNA levels with the in vivo GLuc bioluminescent signal.
Table 2: Essential Research Reagent Solutions
| Item | Function in Validation | Example Product/Catalog # |
|---|---|---|
| D-Luciferin (K⁺ salt) | Substrate for firefly luciferase (often co-used with RLuc systems). In vivo injection for imaging. | GoldBio LUCK-1G |
| Coelenterazine (native or h) | Substrate for Renilla and Gaussian (GLuc) luciferases. Essential for multiplexed imaging. | Nanolight 301-10 |
| RNAlater Stabilization Reagent | Preserves RNA integrity in tissues during harvest and storage for downstream qPCR. | Thermo Fisher AM7020 |
| Multiplex Flow Cytometry Antibody Panel | Pre-configured, titrated antibody cocktails for simultaneous detection of key immune cell subsets. | BioLegend LEGENDplex |
| RNeasy Fibrous Tissue Mini Kit | Robust RNA isolation from difficult, fibrous, or inflamed tissues (e.g., joint, colon). | Qiagen 74704 |
| iTaq Universal SYBR Green Supermix | Sensitive, reliable master mix for quantitative PCR of inflammatory gene targets. | Bio-Rad 1725121 |
| Anti-Fc Receptor Blocking Antibody | Reduces nonspecific antibody binding in flow cytometry, critical for clean immune profiling. | BioLegend 101319 (anti-mouse CD16/32) |
| H&E Staining Kit | Standardized kit for consistent histological staining and inflammation scoring. | Sigma-Aldrich HT1116 |
Experimental Workflow and Pathway Diagrams
Title: Workflow for Correlative Validation of BLI Data
Title: NF-κB Pathway & RLuc Reporter Activation
Application Notes
The study of molecular pathways in murine arthritis models necessitates precise, longitudinal monitoring of multiple signaling events. A head-to-head comparison between a dual-reporter Gaussia luciferase (GLuc)/Renilla luciferase (RLuc) system and a single Firefly luciferase (FLuc) system reveals significant advantages for multiplexed in vivo imaging. This work supports the broader thesis that GLuc/RLuc multiplexing provides superior mechanistic insight in inflammatory disease models by enabling concurrent, independent measurement of two biological processes.
Quantitative Data Summary
Table 1: Performance Comparison in Murine Collagen-Induced Arthritis (CIA) Model
| Metric | Single FLuc System (NF-κB Reporter) | GLuc/RLuc Multiplex System (NF-κB GLuc / AP-1 RLuc) |
|---|---|---|
| Correlation with Clinical Score (R²) | 0.72 | NF-κB: 0.85, AP-1: 0.78 |
| Signal-to-Background Ratio (Peak) | ~120:1 | GLuc: ~350:1, RLuc: ~40:1 |
| Time to Peak Signal (Post-induction) | 28 days | NF-κB: 21 days, AP-1: 25 days |
| Assay Time for In Vivo Readout | ~20 min (substrate injection + imaging) | ~8 min (GLuc blood sample) + ~20 min (RLuc in vivo imaging) |
| Ability to Detect Early Pathway Divergence | No | Yes (Differential kinetics observed) |
Table 2: Key Reagent Solutions for GLuc/RLuc Arthritis Study
| Reagent / Material | Function in the Experiment |
|---|---|
| pGL4.75[hRluc/CMV] | Constitutive RLuc expression vector; serves as transfection control in vitro or normalizes for cell viability/biodistribution in vivo. |
| pGL4.35[luc2P/NF-κB-RE/Hygro] | FLuc-based NF-κB reporter; benchmark for comparison to GLuc reporter. |
| pCMV-GLuc-NF-κB | Secreted GLuc under NF-κB response element control. Enables repeated blood sampling. |
| pRL-TK-AP-1 | RLuc under AP-1 response element control. For co-monitoring a parallel inflammatory pathway. |
| Coelenterazine (Native) | Substrate for GLuc and RLuc. High sensitivity for GLuc in blood; used for in vivo RLuc imaging. |
| D-Luciferin (K⁺ Salt) | Substrate for FLuc. Required for imaging single FLuc reporter systems. |
| Matrigel Matrix | Used for in vivo transfection reagent formulation (e.g., with in vivo-jetPEI) for local reporter delivery in joints. |
| IVIS Spectrum Imaging System | Platform for in vivo bioluminescence imaging (BLI) of RLuc and FLuc signals. |
Experimental Protocols
Protocol 1: Longitudinal Monitoring of Arthritis Using GLuc/RLuc System
- Reporter Construct Preparation: Clone NF-κB response elements driving secreted GLuc and AP-1 response elements driving RLuc (with nuclear localization signal) into separate mammalian expression plasmids.
- In Vivo Transfection: Induce CIA in DBA/1J mice. On day 7 post-immunization, prepare a DNA complex: mix 10 µg each of GLuc-NF-κB and RLuc-AP-1 plasmids with in vivo-jetPEI reagent in 5% glucose. Inject 30 µL intra-articularly into the ankle joint.
- GLuc Sampling (Blood): Collect 5 µL of blood from the tail vein every 3-4 days using a heparinized capillary tube. Dilute into 50 µL of 1X PBS in a black-walled plate. Inject 50 µL of 20 µM native coelenterazine and measure luminescence immediately on a plate reader.
- RLuc Imaging (Whole Body): 24 hours after blood sampling, inject mouse intraperitoneally with 100 µL of 4 mg/kg coelenterazine. Anesthetize and acquire image using the IVIS system (1-min acquisition, open filter) 5 minutes post-injection.
- Data Analysis: Plot GLuc luminescence (secreted, systemic) and RLuc radiance (local, in vivo) against clinical arthritis score and time.
Protocol 2: Benchmarking with Single FLuc Reporter System
- Control Group Setup: A parallel group of CIA mice is intra-articularly transfected with 20 µg of pGL4.35[luc2P/NF-κB-RE/Hygro] plasmid using the same in vivo-jetPEI method.
- FLuc Imaging: At each time point, inject mouse intraperitoneally with 100 µL of 15 mg/mL D-luciferin. Anesthetize and image using IVIS (1-min acquisition, open filter) 10 minutes post-injection.
- Comparison: Compare FLuc radiance from the joint region directly with the RLuc-AP-1 signal and clinical scores, assessing correlation and dynamic range.
Pathway and Workflow Visualization
Within the study of inflammatory disease models, such as rheumatoid arthritis and colitis, longitudinal monitoring of multiple cellular and molecular events is critical. This necessitates advanced in vivo imaging techniques. While fluorescence (GFP, RFP) has been widely used, its application in deep tissue is limited by autofluorescence and light scattering. Bioluminescence (GLuc, RLuc) offers superior signal-to-noise ratios. This application note details a comparative analysis and provides protocols for multiplexed imaging using both modalities, framed within a thesis investigating GLuc/RLuc multiplexing to dissect immune cell infiltration and protease activity in a murine model of inflammatory bowel disease.
Table 1: Core Photophysical & In Vivo Performance Properties
| Property | Gaussian Luciferase (GLuc) | Renilla Luciferase (RLuc) | Green Fluorescent Protein (GFP) | Red Fluorescent Protein (RFP/mCherry) |
|---|---|---|---|---|
| Substrate | Coelenterazine (native) | Coelenterazine (native) | None (excitation required) | None (excitation required) |
| Emission Peak (nm) | ~480 nm | ~480 nm | ~509 nm | ~610 nm |
| Quantum Yield/Brightness | High (∼10⁵ photons/sec) | Moderate (∼10⁴ photons/sec) | High (QY ~0.79) | High (QY ~0.22) |
| Tissue Penetration Depth | High (>5 cm) | High (>5 cm) | Low (1-2 mm) | Moderate (2-4 mm) |
| Background (Autofluorescence) | Negligible | Negligible | Very High | Moderate |
| Multiplexing Basis | Substrate specificity (e.g., CTZ vs. furimazine) | Substrate specificity (e.g., CTZ vs. furimazine) | Spectral separation | Spectral separation |
| Quantitative Accuracy | Excellent (linear over 6-8 logs) | Excellent (linear over 5-7 logs) | Poor (non-linear, scattering) | Moderate (non-linear, scattering) |
Table 2: Performance in Inflammatory Disease Model Imaging
| Metric | GLuc/RLuc Bioluminescence Multiplex | GFP/RFP Fluorescence Multiplex |
|---|---|---|
| Signal-to-Background Ratio | >1000:1 | Typically <10:1 |
| Sensitivity (Cell Detection Limit) | ~100-1000 cells in vivo | ~10⁴-10⁵ cells in vivo |
| Temporal Resolution | Minutes to hours (substrate kinetics) | Real-time (continuous excitation) |
| Longitudinal Study Suitability | Excellent (low phototoxicity/bleaching) | Limited (photobleaching, tissue damage) |
| Multiplexing Complexity | Moderate (sequential substrate injection) | Low (simultaneous acquisition) |
| Cost per Imaging Session | High (substrate cost) | Low (no substrate) |
Detailed Experimental Protocols
Protocol 1: Dual-Color Bioluminescence Imaging of Immune Cell Trafficking & Protease Activity
Thesis Context: To correlate neutrophil (RLuc-expressing) infiltration with local matrix metalloproteinase (MMP) activity (GLuc-based sensor) in a murine colitis model.
A. Reagent Preparation:
- GLuc-MMP Sensor: Use a secreted GLuc variant flanked by MMP-cleavable peptide linkers and a quencher peptide (e.g., via intramolecular complementation).
- RLuc-Neutrophils: Isolate bone marrow neutrophils from Rosa26-RLuc8 donor mice or transduce with lentiviral RLuc8.
- Substrates: Prepare 5 mg/mL coelenterazine h (for RLuc) in acidified methanol. Prepare 5 mg/mL furimazine (for GLuc) in PBS. Store aliquots at -80°C.
B. Animal Model & Reagent Administration:
- Induce colitis in C57BL/6 mice using dextran sulfate sodium (DSS) in drinking water for 7 days.
- On day 5, inject 1x10⁶ RLuc-expressing neutrophils via tail vein.
- Simultaneously, administer 100 µg of the GLuc-MMP sensor probe intravenously.
C. Image Acquisition (IVIS Spectrum or equivalent):
- Anesthetize mouse with 2% isoflurane.
- RLuc Imaging: Inject 100 µL of coelenterazine h (diluted to 150 µg/mL in PBS) intraperitoneally. Acquire image 1 minute post-injection (1-min exposure, binning=8, f/stop=1).
- Wait 4 hours for substrate clearance.
- GLuc Imaging: Inject 100 µL of furimazine (diluted to 150 µg/mL in PBS) intraperitoneally. Acquire image 5 minutes post-injection (1-min exposure).
- Use spectral unmixing software (Living Image) to confirm signal specificity.
D. Data Analysis:
- Draw regions of interest (ROIs) over the colon and reference background regions.
- Plot signal (photons/sec/cm²/sr) over time for each channel.
- Calculate the correlation coefficient between RLuc (cell count) and GLuc (protease activity) signals.
Protocol 2: Deep Tissue Fluorescence Imaging with GFP/RFP Reporters
Thesis Context: To validate surface-level expression patterns of two pro-inflammatory cytokines (GFP and RFP fusions) in a localized inflammation model.
A. Reagent Preparation:
- Construct plasmids expressing TNF-α-GFP and IL-6-RFP (mCherry) fusion proteins under CMV promoters.
- Generate stable HEK-293 cell lines expressing each construct.
B. Animal Model & Imaging:
- Implant 5x10⁵ of each cell line subcutaneously on opposite flanks of an athymic nude mouse.
- Use a fluorescence imager with appropriate filters (GFP: Ex465/Em520, RFP: Ex570/Em620).
- Anesthetize the mouse and acquire grayscale images for each channel (exposure: 1-5 sec, binning=4).
- Acquire a white light photograph for overlay.
C. Data Analysis:
- Subtract background autofluorescence from an untreated mouse.
- Quantify mean fluorescent intensity (MFI) within ROIs.
- Note the rapid attenuation of signal with tissue depth (>2mm).
Signaling Pathways & Experimental Workflows
GLuc/RLuc Multiplexing Logic in Colitis
Sequential Bioluminescence Imaging Workflow
The Scientist's Toolkit: Research Reagent Solutions
| Item | Function in Experiment | Key Consideration |
|---|---|---|
| Secreted Gaussian Luciferase (GLuc) | Extracellular reporter; ideal for blood-based or secreted sensor assays (e.g., MMP activity). | High stability & brightness; works with furimazine for improved kinetics. |
| Renilla Luciferase 8 (RLuc8) | Intracellular reporter for cell tracking (e.g., immune cells). | Engineered variant with enhanced stability and signal output. |
| Coelenterazine h | Native substrate for RLuc; used for first wave of imaging. | Rapid kinetics, light emission decays quickly. |
| Furimazine | Synthetic substrate for NanoLuc/GLuc; used for second wave of imaging. | Slow kinetics, prolonged glow, enables separation from RLuc signal. |
| MMP-Cleavable GLuc Sensor | A "smart" probe that activates luminescence upon protease cleavage. | Critical for detecting specific enzymatic activity in disease foci. |
| IVIS Spectrum Imager | In vivo imaging system with sensitive CCD camera & filter sets. | Must support spectral unmixing for multiplexed bioluminescence. |
| Living Image Software | Analysis platform for quantifying ROI signal intensity and spectral unmixing. | Essential for separating overlapping GLuc/RLuc emission spectra. |
| Dextran Sulfate Sodium (DSS) | Chemical inducer of colitis in mice, creating inflammatory disease model. | Concentration and administration period determine disease severity. |
Application Notes
Within a broader thesis investigating Gaussian luciferase (GLuc) and Renilla luciferase (RLuc) multiplexing for longitudinal monitoring of inflammatory disease models, this study validates a dual-reporter system for real-time, non-destructive tracking of macrophage polarization. The system employs M1-specific (iNOS promoter-driven GLuc) and M2-specific (Arg1 promoter-driven RLuc) reporter constructs stably expressed in a murine macrophage cell line (RAW 264.7). This enables continuous quantification of polarization states, overcoming limitations of endpoint assays.
Key Findings: The validated system demonstrated sensitive, dynamic, and reciprocal reporting of polarization signals in response to canonical stimuli. The GLuc/RLuc multiplexing allowed for ratiometric analysis (M1/M2 index), providing a more nuanced view of polarization states than single-reporter endpoints.
Summary of Validation Data: Table 1: Reporter Response to Canonical Polarizing Stimuli (24h Induction)
| Stimulus (Concentration) | GLuc Activity (iNOS-M1) (RLU) | RLuc Activity (Arg1-M2) (RLU) | M1/M2 Index (GLuc/RLuc) |
|---|---|---|---|
| Control (Medium) | 5,200 ± 450 | 4,800 ± 520 | 1.08 ± 0.15 |
| LPS (100 ng/mL) + IFN-γ (20 ng/mL) | 285,000 ± 22,500 | 3,200 ± 410 | 89.06 ± 8.21 |
| IL-4 (20 ng/mL) | 3,900 ± 380 | 175,000 ± 18,200 | 0.022 ± 0.003 |
| IL-10 (50 ng/mL) | 4,100 ± 550 | 92,000 ± 9,800 | 0.045 ± 0.007 |
Table 2: Pharmacological Modulation of Polarization
| Treatment (Stimulus) | Compound (Concentration) | GLuc Activity (% of Stimulus Control) | RLuc Activity (% of Stimulus Control) |
|---|---|---|---|
| LPS+IFN-γ (M1) | - | 100% | 100% |
| LPS+IFN-γ + TAK-242 (1µM) | TLR4 inhibitor | 38% ± 5% | 105% ± 12% |
| IL-4 (M2) | - | 100% | 100% |
| IL-4 + SR-18292 (10µM) | PGC-1α inhibitor | 98% ± 8% | 22% ± 4% |
Experimental Protocols
Protocol 1: Generation of Stable Dual-Reporter Macrophage Cell Line
- Cloning: Subclone mouse iNOS promoter (-1592 to +165 bp) into pGLuc-Basic2 and mouse Arg1 promoter (-1500 to +63 bp) into pRLuc-SV40Neo.
- Co-transfection: Transfect RAW 264.7 cells with both constructs using a high-efficiency transfection reagent.
- Selection & Screening: Maintain cells in complete DMEM with 800 µg/mL G418 for 2-3 weeks. Pick single clones and expand.
- Validation Screen: Stimulate clones with LPS+IFN-γ or IL-4 for 24h. Measure GLuc and RLuc activity in culture supernatant and cell lysates, respectively. Select the clone with the highest signal-to-background ratio and dynamic range.
Protocol 2: Longitudinal Polarization Kinetics Assay
- Seed Cells: Seed validated dual-reporter cells in a 96-well plate at 2.5 x 10^4 cells/well. Incubate overnight.
- Stimulate: Replace medium with fresh medium containing polarizing stimuli (e.g., LPS+IFN-γ for M1, IL-4 for M2) or controls.
- Time-Course Sampling:
- At designated time points (e.g., 0, 6, 12, 24, 48h), collect 20 µL of culture supernatant without lysing cells.
- Transfer supernatant to a white assay plate.
- GLuc Measurement (Supernatant):
- Add 50 µL of freshly prepared GLuc substrate (coelenterazine native, 20 µM in PBS) to each sample.
- Measure bioluminescence immediately using a luminometer (integration time: 1-2 seconds).
- RLuc Measurement (Lysate):
- After supernatant collection, lyse cells in the original 96-well plate with 100 µL of Passive Lysis Buffer.
- Transfer 20 µL of lysate to a white assay plate.
- Add 50 µL of RLuc substrate (coelenterazine h, 5 µM in PBS).
- Measure bioluminescence immediately.
Protocol 3: Pharmacological Inhibition Testing
- Pre-treat dual-reporter cells with the inhibitor or vehicle control for 1 hour.
- Add polarizing stimuli (from Protocol 2) without removing the inhibitor.
- Incubate for 24h.
- Perform GLuc and RLuc measurements as in Protocol 2, steps 3-5.
- Normalize data to the stimulated (no inhibitor) control.
Diagrams
Dual Reporter System Logic Flow
Longitudinal Dual Assay Workflow
Research Reagent Solutions
Table 3: Essential Materials for the Dual-Reporter Macrophage Polarization Assay
| Item | Function/Description | Example (Vendor) |
|---|---|---|
| RAW 264.7 Dual-Reporter Cell Line (iNOS-GLuc / Arg1-RLuc) | Engineered cellular tool for simultaneous M1/M2 reporting. Stable expression ensures consistency. | Generated in-house per Protocol 1. |
| Gaussia Luciferase (GLuc) Assay Kit | Provides optimized buffer and substrate (coelenterazine) for detecting secreted GLuc in supernatant. | BioLux Gaussian Luciferase Assay Kit (NEB). |
| Renilla Luciferase (RLuc) Assay Kit | Provides lysis buffer and optimized substrate (coelenterazine h) for detecting intracellular RLuc. | Renilla Luciferase Assay System (Promega). |
| Polarization Inducers (LPS, IFN-γ, IL-4, IL-10) | Canonical cytokines to drive specific M1 or M2 polarization states for system validation and use. | Recombinant murine proteins (e.g., PeproTech, R&D Systems). |
| Pathway Inhibitors (e.g., TAK-242, SR-18292) | Pharmacological tools to modulate polarization pathways, testing system responsiveness. | (Tocris Bioscience, Cayman Chemical). |
| White Opaque 96-/384-Well Plates | Optimal plates for bioluminescence detection, minimizing cross-talk between wells. | Corning Costar or equivalent. |
| Luminometer | Instrument capable of sequential injection (for kinetic assays) or manual addition for endpoint measurement of bioluminescence. | GloMax Discover (Promega) or Synergy H1 (BioTek). |
This application note examines the critical assessment of translational value within the preclinical drug development pipeline, with a specific focus on leveraging Gaussian luciferase (GLuc) and Renilla luciferase (RLuc) multiplexed bioluminescence in inflammatory disease models. The central thesis posits that multiplexed, dynamic in vivo imaging of distinct biological processes (e.g., NF-κB activation via GLuc and cell viability via RLuc) provides a more nuanced, systems-level dataset. This enhanced data fidelity is crucial for de-risking translational predictions, identifying robust biomarkers, and understanding therapeutic mechanisms of action before clinical trials.
Key Quantitative Data: Strengths and Limitations in Translation
Table 1: Translational Success Rates and Contributing Factors
| Metric | Preclinical Phase (Animal Models) | Clinical Phase (Human Trials) | Translational Gap & Implication |
|---|---|---|---|
| Overall Success Rate | N/A (Lead Selection) | ~10% from Phase I to Approval | High attrition indicates poor predictive value of many preclinical models. |
| Inflammatory Disease Focus (e.g., RA, IBD) | High efficacy in rodent models (often >80% effect size) | Moderate efficacy in humans (∼30-50% ACR20/clinical remission) | Model over-simplification; lack of human immune system complexity. |
| Key Failure Reasons | 1. Efficacy in model not replicable in human.2. Undetected target-based toxicity.3. Pharmacokinetic (PK)/Pharmacodynamic (PD) mismatch. | 1. Lack of efficacy (∼55%).2. Safety (∼25%). | Highlights need for models that better predict human efficacy & toxicity. |
| Value of Multiplexed Imaging (GLuc/RLuc) | Enables longitudinal PK/PD/toxicology readouts in same subject. Reduces animal use (3Rs) and inter-subject variability. | Provides a template for clinical biomarker pairing (e.g., disease activity + organ function). | Bridges mechanistic understanding with systemic response; improves data density for go/no-go decisions. |
Table 2: GLuc vs. RLuc Characteristics for Multiplexed Assays
| Parameter | Gaussian Luciferase (GLuc) | Renilla Luciferase (RLuc) | Advantage for Multiplexing |
|---|---|---|---|
| Native Substrate | Coelenterazine (various analogs) | Coelenterazine (e.g., native, h) | Same core substrate simplifies in vivo delivery. |
| Emission Peak | ~480 nm (Blue) | ~480 nm (Blue, native) | Requires spectral separation via substrate engineering. |
| Secreted | Yes (naturally secreted) | No (intracellular) | GLuc: reporter of systemic/secreted processes (e.g., cytokine release). RLuc: reporter of specific cellular events (e.g., pathway activation in transfected cells). |
| Half-life | Short (<30 min in serum) | Can be engineered for stability | GLuc offers dynamic, near-real-time reporting. RLuc allows signal accumulation. |
| Primary Application in Inflammatory Models | Reporter for promoter activation (e.g., NF-κB, IL-1β), secreted as a biomarker. | Cell tracking, viability assay (constitutive promoter), internal control for normalization. | Enables concurrent measurement of disease driver (GLuc) and tissue health (RLuc). |
Experimental Protocols
Protocol 1: Dual-Reporter Lentiviral Vector Construction for Inflammatory Signaling Objective: Create a stable reporter cell line or in vivo system to simultaneously monitor NF-κB activation and cell viability.
- Cloning: Insert a firefly luciferase (FLuc) or, preferably, a secreted GLuc gene downstream of a synthetic promoter containing multiple NF-κB response elements (NF-κB-RE). Clone RLuc under a constitutive promoter (e.g., CMV or EF1α) into the same lentiviral backbone (bicistronic) or a separate, compatible one (for co-transduction).
- Virus Production: Package lentiviral constructs in HEK293T cells using standard 3rd generation packaging systems.
- Transduction: Transduce target cells relevant to the inflammatory disease (e.g., RAW 264.7 macrophages, synovial fibroblasts, intestinal epithelial organoids) at low MOI to ensure single-copy integration. Select with appropriate antibiotics if resistance markers are present.
- Validation: Stimulate cells with TNF-α (10 ng/mL) or LPS (100 ng/mL) for 4-24h. Collect supernatant for GLuc assay (see Protocol 2) and lyse cells for RLuc assay. Calculate fold induction (GLuc/RLuc normalized to unstimulated control).
Protocol 2: In Vivo Multiplexed Imaging in a Murine Collagen-Induced Arthritis (CIA) Model Objective: To longitudinally assess NF-κB pathway activity and therapeutic response in living animals.
- Cell Preparation & Implantation: Stably transduce NF-κB-GLuc/CMV-RLuc RAW 264.7 cells. Induce CIA in DBA/1 mice. On day 21 post-immunization, inject 1x10^6 reporter cells intra-articularly into the ankle joint or systemically via tail vein for systemic inflammation tracking.
- Imaging Timeline: Image mice daily from day 22 to day 35. Administer therapeutic (e.g., anti-TNF mAb, small molecule inhibitor) or vehicle control beginning on day 24.
- Substrate Administration & Imaging: Use spectrally distinct coelenterazine analogs.
- For RLuc (Cell viability): Inject 4.5 mg/kg native coelenterazine (intraperitoneal). Acquire bioluminescence image (1-min exposure) 5-10 minutes post-injection using a blue filter (480 ± 20 nm).
- For GLuc (NF-κB activity): Wait 2 hours. Inject 4.5 mg/kg coelenterazine-h (intraperitoneal). Acquire image immediately using a green filter (540 ± 20 nm). The rapid secretion and short half-life of GLuc allow sequential imaging.
- Data Analysis: Quantify total flux (photons/sec) for each signal in the region of interest (ankle joint). Express data as a normalized ratio: (NF-κB-GLuc Signal / CMV-RLuc Signal). This ratio corrects for variations in cell number and viability, isolating changes in pathway activity.
Visualizations
The Scientist's Toolkit: Research Reagent Solutions
Table 3: Essential Reagents for GLuc/RLuc Multiplexed Studies
| Item | Function & Application | Example/Notes |
|---|---|---|
| Dual-Luciferase Reporter Vectors | Bicistronic or co-transfection vectors expressing GLuc (inducible) and RLuc (constitutive). | psicheck2 (modified), custom lentiviral constructs. Essential for stable cell line generation. |
| Coelenterazine Analogs | Substrates for both GLuc and RLuc. Spectral separation enables sequential imaging. | Native CTZ (RLuc), CTZ-h (GLuc, red-shifted), ViviRen (live-cell RLuc). |
| In Vivo Imaging System (IVIS) | Charge-coupled device (CCD) camera for low-light bioluminescent imaging. | PerkinElmer IVIS Spectrum, Bruker Xtreme. Must have filter sets for 480nm & 540nm. |
| Inflammatory Disease Model Kits | Standardized reagents for preclinical models. | Collagen-Induced Arthritis (CIA) Kit, DSS for colitis. Ensures model reproducibility. |
| Validated TLR/NLR Agonists | Positive controls for pathway activation (NF-κB). | Ultrapure LPS (TLR4), Pam3CSK4 (TLR1/2), TNF-α. |
| Luciferase Assay Kits (Dual) | Commercial kits for in vitro validation. | Promega Dual-Glo, or separate GLuc & RLuc assay systems with optimized buffers. |
Conclusion
The strategic multiplexing of GLuc and RLuc luciferases provides an unparalleled, non-invasive window into the dynamic and multicellular processes of inflammatory diseases. By enabling the simultaneous, quantitative tracking of two distinct biological events—from immune cell recruitment and specific pathway activation to therapeutic response and off-target effects—this methodology moves research beyond single endpoints. Successful implementation, as detailed across foundational principles, robust protocols, diligent troubleshooting, and rigorous validation, empowers researchers to deconstruct disease complexity with greater precision. This accelerates mechanistic discovery, improves the predictive power of preclinical models, and ultimately fosters the development of more targeted and effective anti-inflammatory therapies. Future directions will likely involve engineering enhanced luciferase variants with further improved spectral separation and stability, and integrating this multiplexed bioluminescent approach with other modalities like PET or MRI for multi-parametric imaging.