IL-6/JAK/STAT3 Signaling Drives Epithelial-Mesenchymal Transition (EMT): Mechanisms, Research Methods, and Therapeutic Implications
This comprehensive review explores the central role of the IL-6/JAK/STAT3 signaling pathway in regulating Epithelial-Mesenchymal Transition (EMT), a critical process in cancer metastasis, fibrosis, and development.
IL-6/JAK/STAT3 Signaling Drives Epithelial-Mesenchymal Transition (EMT): Mechanisms, Research Methods, and Therapeutic Implications
Abstract
This comprehensive review explores the central role of the IL-6/JAK/STAT3 signaling pathway in regulating Epithelial-Mesenchymal Transition (EMT), a critical process in cancer metastasis, fibrosis, and development. We detail the foundational molecular mechanisms, including cytokine binding, receptor activation, and STAT3-mediated transcriptional reprogramming. The article provides a methodological guide for studying this pathway in vitro and in vivo, discusses common troubleshooting and optimization strategies for assays, and compares validation techniques and emerging pharmacological inhibitors. Aimed at researchers and drug development professionals, this synthesis connects basic science to translational applications, highlighting the pathway's promise as a therapeutic target.
Understanding the Core: How IL-6/JAK/STAT3 Activation Orchestrates EMT
Epithelial-mesenchymal transition (EMT) is a fundamental cellular process wherein epithelial cells lose their polarity and cell-cell adhesion, gaining migratory and invasive mesenchymal properties. In pathological contexts, particularly cancer, EMT is co-opted by tumor cells to drive metastasis, chemoresistance, and stemness. A central regulator of this process is the IL-6/JAK/STAT3 signaling axis, which serves as a critical molecular bridge between inflammatory stimuli and the transcriptional reprogramming of EMT.
Hallmarks of EMT
EMT is characterized by a suite of phenotypic and molecular changes. The core hallmarks include:
- Loss of Epithelial Traits: Dissolution of tight and adherens junctions, apical-basal polarity, and reduction of epithelial marker expression.
- Gain of Mesenchymal Traits: Acquisition of front-rear polarity, enhanced migratory capacity, invasiveness, and resistance to apoptosis, accompanied by upregulated mesenchymal marker expression.
- Cytoskeletal Reorganization: Replacement of cortical actin networks with stress fibers.
- Transcriptional Reprogramming: Activation of a core set of EMT-inducing transcription factors (EMT-TFs).
- Extracellular Matrix (ECM) Remodeling: Increased production and secretion of ECM components and matrix-degrading enzymes.
Key Markers of EMT
The progression of EMT is tracked through the expression of key protein markers.
Table 1: Core EMT Markers and Their Significance
| Marker | Type | Normal Function | Expression Change in EMT | Pathological Significance |
|---|---|---|---|---|
| E-cadherin (CDH1) | Epithelial | Calcium-dependent cell-cell adhesion at adherens junctions; maintains epithelial integrity. | Downregulated (Transcriptional repression, protein degradation). | Loss is a canonical hallmark of EMT. Correlates with tumor dedifferentiation, invasion, and poor prognosis in carcinomas. |
| N-cadherin (CDH2) | Mesenchymal | Mediates cell-cell adhesion in mesenchymal and neuronal tissues. | Upregulated (Cadherin switch). | Promotes motility, survival, and interaction with stromal cells. Associated with aggressive tumor phenotypes. |
| Vimentin | Mesenchymal | Type III intermediate filament providing mechanical integrity and facilitating motility. | Upregulated. | A standard mesenchymal marker. Essential for cell migration, and its expression strongly correlates with metastatic potential. |
Pathological Significance
EMT is implicated in fibrosis, wound healing, and embryonic development. In oncology, its role is paramount:
- Metastasis: EMT enables carcinoma cells to detach from the primary tumor, invade the basement membrane, and intravasate into blood/lymphatic vessels.
- Therapeutic Resistance: Mesenchymal-like cancer cells exhibit enhanced survival and are resistant to chemotherapy, radiotherapy, and targeted therapies.
- Cancer Stem Cell (CSC) Generation: EMT programs are linked to the acquisition of stem-like properties, driving tumor initiation and recurrence.
- Immune Evasion: Cells undergoing EMT can alter their immunogenicity and suppress anti-tumor immune responses.
The IL-6/JAK/STAT3 Signaling Axis in EMT
Chronic inflammation is a known catalyst for cancer progression. The IL-6/JAK/STAT3 pathway is a primary mechanism linking inflammation to EMT.
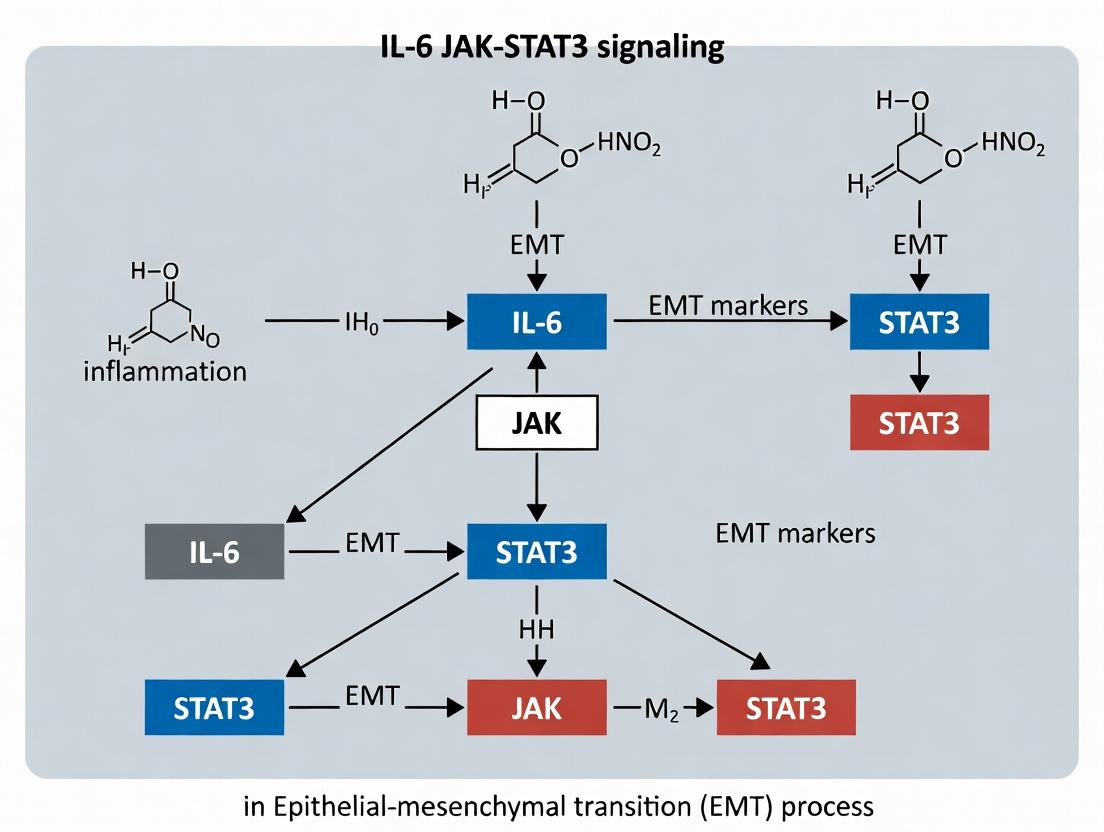
Mechanism: Binding of IL-6 to its receptor (IL-6R/gp130) activates associated JAK kinases, which phosphorylate STAT3. Phosphorylated STAT3 dimerizes and translocates to the nucleus, where it acts as a transcription factor. Role in EMT: Nuclear p-STAT3 directly binds to and activates the promoters of key EMT-TFs (e.g., SNAIL, TWIST, ZEB1). It also induces expression of EMT-regulating miRNAs and collaborates with other pathways (TGF-β, NF-κB) to enforce the mesenchymal state. STAT3 signaling is both necessary and sufficient to drive EMT in many carcinoma models.
Diagram: IL-6/JAK/STAT3 Signaling Cascade Driving EMT.
Experimental Protocols for Investigating EMT & IL-6/STAT3 Signaling
Induction and Validation of EMTIn Vitro
Objective: To treat epithelial cancer cells with IL-6 and confirm EMT progression. Protocol:
- Cell Culture & Treatment: Plate human epithelial carcinoma cells (e.g., MCF-7, A549) in 6-well plates. At 70% confluency, treat with recombinant human IL-6 (10-50 ng/mL) for 48-72 hours. Include a vehicle control.
- Morphological Analysis: Capture phase-contrast images. Epithelial cells appear cobblestone-like; mesenchymal cells become elongated, spindle-shaped, and scatter.
- Protein Analysis (Western Blot):
- Lyse cells in RIPA buffer.
- Resolve 20-30 µg protein by SDS-PAGE, transfer to PVDF membrane.
- Probe with primary antibodies: Anti-E-cadherin (mouse monoclonal, 1:1000), Anti-N-cadherin (rabbit monoclonal, 1:1000), Anti-Vimentin (rabbit monoclonal, 1:2000), Anti-p-STAT3 (Tyr705) (rabbit monoclonal, 1:1000), and Total STAT3 (loading control).
- Incubate with appropriate HRP-conjugated secondary antibodies and develop with chemiluminescence.
- Functional Assay - Wound Healing/Scratch Assay:
- Create a confluent monolayer in a 12-well plate. Scratch with a 200 µL pipette tip.
- Wash away debris and add fresh medium ± IL-6.
- Image at 0, 24, and 48 hours. Quantify the percentage of wound closure.
Investigating STAT3 Necessity via Knockdown
Objective: To determine if STAT3 is required for IL-6-induced EMT. Protocol:
- STAT3 Knockdown: Transfect cells with STAT3-specific siRNA (e.g., 50 nM) using a lipid-based transfection reagent. Use a non-targeting siRNA as a negative control.
- Treatment: 24-48 hours post-transfection, treat cells with IL-6 as in Protocol 1.
- Validation: Confirm STAT3 knockdown efficiency by Western blot (total STAT3). Proceed with analysis of EMT markers (E-cadherin, Vimentin) and functional assays (scratch assay). Loss of IL-6's effect confirms STAT3 necessity.
Chromatin Immunoprecipitation (ChIP) for Direct Transcriptional Regulation
Objective: To test if p-STAT3 directly binds to the promoter of an EMT-TF (e.g., SNAIL1). Protocol:
- Crosslinking & Lysis: Treat cells with IL-6 for 45-60 min. Crosslink with 1% formaldehyde for 10 min. Quench with glycine. Harvest cells and lyse.
- Sonication: Sonicate chromatin to shear DNA to fragments of 200-500 bp.
- Immunoprecipitation: Incubate chromatin with Anti-p-STAT3 (Tyr705) antibody or normal IgG (negative control) overnight at 4°C. Capture antibody-chromatin complexes with Protein A/G beads.
- Wash, Elute, Reverse Crosslinks: Wash beads stringently. Elute complexes and reverse crosslinks with high salt and heat.
- DNA Purification & Analysis: Purify DNA (PCR purification kit). Analyze by quantitative PCR (qPCR) using primers specific for the putative STAT3-binding site in the SNAIL1 promoter. Enrichment in the p-STAT3 sample vs. IgG indicates direct binding.
Diagram: ChIP-qPCR Workflow to Validate STAT3 Binding.
The Scientist's Toolkit: Key Research Reagent Solutions
Table 2: Essential Reagents for EMT/IL-6/JAK/STAT3 Research
| Reagent/Category | Example Product(s) | Function & Application |
|---|---|---|
| Recombinant Human IL-6 | PeproTech, R&D Systems | The primary inducer to activate the JAK/STAT3 pathway and initiate EMT in cell models. |
| STAT3 Inhibitors (Small Molecule) | Stattic, S3I-201 | Selective inhibitors of STAT3 phosphorylation/dimerization. Used for loss-of-function studies to prove pathway necessity. |
| JAK Inhibitors | Ruxolitinib (JAK1/2), Tofacitinib (JAK1/3) | Blocks upstream of STAT3. Useful for dissecting signaling hierarchy and potential therapeutic targeting. |
| EMT Marker Antibodies | E-cadherin: Cell Signaling Tech #3195Vimentin: CST #5741N-cadherin: CST #13116p-STAT3 (Tyr705): CST #9145 | Essential for Western blot, immunofluorescence, and IHC to quantify molecular changes during EMT. |
| STAT3 siRNA/shRNA | DharmacON SMARTpool, Sigma Mission shRNA | For genetic knockdown/knockdown of STAT3 to confirm its specific role in EMT progression. |
| ChIP-Grade p-STAT3 Antibody | CST #9145 (ChIP validated) | High-specificity antibody required for Chromatin Immunoprecipitation (ChIP) assays to detect in vivo DNA binding. |
| Invasion/Migration Assay Kits | Corning Matrigel Invasion Chambers, Culture-Insert 2 Well (ibidi) | Standardized kits to quantitatively assess the functional gain of migratory and invasive capabilities post-EMT. |
| EMT Transcription Factor PCR Array | Qiagen PAHS-090Z | Profiling tool to measure the expression of 84 EMT-related genes (TFs, markers) simultaneously via RT-qPCR. |
This technical guide details the molecular events of IL-6-induced JAK-STAT3 signaling, a critical pathway driving epithelial-mesenchymal transition (EMT) in cancer and fibrosis. Within EMT research, canonical and trans-signaling modes of IL-6 activate transcriptional programs that repress epithelial and induce mesenchymal gene expression, facilitating cell invasion and metastasis. This document provides an in-depth mechanistic breakdown, essential experimental protocols, and key reagent solutions for investigators targeting this axis.
The Interleukin-6 (IL-6) signaling cascade is a master regulator of inflammation, immune response, and cellular transformation. In the specific context of epithelial-mesenchymal transition (EMT) research, IL-6 signaling is a potent driver of the loss of epithelial characteristics (e.g., E-cadherin downregulation) and the acquisition of a migratory, invasive mesenchymal phenotype (e.g., N-cadherin, Vimentin upregulation). This transition is mediated predominantly through the Janus kinase (JAK)-signal transducer and activator of transcription 3 (STAT3) pathway. Persistent activation of STAT3 leads to the transcription of EMT-transcription factors (EMT-TFs) like SNAIL, TWIST, and ZEB1, creating a feed-forward loop that stabilizes the mesenchymal state and promotes metastasis and therapeutic resistance.
Core Signaling Cascade: Canonical and Trans-Signaling
IL-6 signals through two primary mechanisms: classic signaling via the membrane-bound IL-6 receptor (IL-6R) and gp130, and trans-signaling via a soluble IL-6R (sIL-6R) complexed with IL-6 binding to gp130. Trans-signaling dramatically expands the range of IL-6-responsive cells, including epithelial cells that may not express the membrane-bound IL-6R, and is considered a key contributor to pathological EMT and cancer progression.
Table 1: Core Components of IL-6/JAK/STAT3 Signaling in EMT
| Component | Type | Role in Signaling | Association with EMT |
|---|---|---|---|
| IL-6 | Cytokine | Primary ligand | Induces EMT-TFs; tumor microenvironment source |
| IL-6R (mIL-6R) | Membrane Receptor | Binds IL-6; complex with gp130 | Limited to hepatocytes, leukocytes |
| sIL-6R | Soluble Receptor | Enables trans-signaling | Critical for EMT in epithelial cancers |
| gp130 | Signal Transducer | Common subunit; dimerizes upon ligation | Constitutively expressed; initiates intracellular signaling |
| JAK1, JAK2, TYK2 | Tyrosine Kinase | Associated with gp130; phosphorylate each other & STAT3 | JAK1/JAK2 are primary mediators; targeted therapeutically |
| STAT3 | Transcription Factor | Phosphorylated, dimerizes, translocates to nucleus | Master regulator of EMT gene program |
| SHP2, SOCS3 | Regulatory Proteins | Negative feedback; modulate signaling | SOCS3 loss correlates with sustained STAT3 & EMT |
Step-by-Step Mechanistic Breakdown
- Ligand-Receptor Assembly: IL-6 binds to either membrane-bound IL-6R (classic) or soluble IL-6R (trans-signaling). This binary complex then associates with two molecules of the transmembrane protein gp130.
- gp130 Dimerization and JAK Activation: The ligation induces gp130 homodimerization, bringing the associated JAK kinases (primarily JAK1 and JAK2) into close proximity.
- JAK Transphosphorylation: The juxtaposed JAKs cross-phosphylate each other on tyrosine residues, achieving full activation.
- STAT3 Recruitment and Phosphorylation: Activated JAKs phosphorylate specific tyrosine residues (e.g., Y705) on the cytoplasmic tails of gp130. STAT3 monomers, via their SH2 domains, are recruited to these phospho-tyrosine sites.
- STAT3 Phosphorylation and Dimerization: JAKs phosphorylate STAT3 on Y705. Phosphorylated STAT3 dissociates from the receptor, homodimerizes via reciprocal SH2-phosphotyrosine interactions, and undergoes optional serine phosphorylation (S727) for maximal activity.
- Nuclear Translocation and Transcriptional Activation: The STAT3 dimer translocates to the nucleus, binds to specific promoter sequences (e.g., GAS elements), and recruits transcriptional co-activators (e.g., p300/CBP) to induce target gene expression, including SNAI1, TWIST1, VIM, and MMP9.
Diagram 1: IL-6 JAK-STAT3 signaling pathway (Canonical & Trans).
Key Experimental Protocols for EMT Research
Protocol: Assessing IL-6-Induced STAT3 Phosphorylation and Nuclear Translocation
Aim: To quantify the activation kinetics of STAT3 (pY705) and its nuclear accumulation in epithelial cells treated with IL-6/sIL-6R (trans-signaling). Materials: Human carcinoma cell line (e.g., A549, MCF-7), recombinant human IL-6, recombinant human sIL-6R, serum-free medium, specific inhibitors (e.g., JAK Inhibitor I, Stattic), lysis buffers. Procedure:
- Cell Treatment: Serum-starve cells for 12-16 hours. Pre-treat with inhibitors (1 µM) or vehicle for 1 hour. Stimulate with IL-6 (50 ng/mL) + sIL-6R (100 ng/mL) for varying timepoints (0, 15, 30, 60, 120 min).
- Protein Extraction:
- Whole Cell Lysate: Use RIPA buffer with phosphatase/protease inhibitors.
- Nuclear/Cytoplasmic Fractionation: Use a commercial kit (e.g., NE-PER).
- Western Blot Analysis:
- Load 20-30 µg protein per lane on an SDS-PAGE gel.
- Transfer to PVDF membrane.
- Block with 5% BSA for phospho-specific antibodies.
- Probe with primary antibodies: Anti-pSTAT3 (Y705), total STAT3, Lamin B1 (nuclear marker), α-Tubulin (cytosolic/loading control).
- Use HRP-conjugated secondary antibodies and chemiluminescent substrate for detection. Analysis: Densitometry of pSTAT3 bands normalized to total STAT3. Nuclear:cytosolic ratio of STAT3 indicates translocation.
Protocol: Quantitative PCR for EMT Marker Expression
Aim: To measure changes in EMT-TF and marker gene expression following sustained IL-6/STAT3 activation. Procedure:
- Treatment: Treat cells with IL-6/sIL-6R for 24-72 hours to induce transcriptional changes.
- RNA Isolation: Use TRIzol reagent or column-based kits. Check RNA integrity.
- cDNA Synthesis: Use 1 µg RNA with a reverse transcription kit using random hexamers.
- qPCR: Use SYBR Green or TaqMan chemistry. Primers for SNAI1, TWIST1, VIM, CDH1 (E-cadherin), and housekeeping genes (ACTB, GAPDH). Run in triplicate.
- Data Analysis: Calculate ∆∆Ct values relative to control-treated samples.
Table 2: Example qPCR Results (Hypothetical Data, Fold Change)
| Gene | 24h IL-6/sIL-6R | 24h IL-6/sIL-6R + JAK Inhibitor |
|---|---|---|
| SNAI1 | 8.5 ± 1.2 | 1.5 ± 0.3 |
| TWIST1 | 4.2 ± 0.7 | 1.1 ± 0.2 |
| VIM | 6.8 ± 0.9 | 2.0 ± 0.4 |
| CDH1 | 0.3 ± 0.1 | 0.9 ± 0.2 |
The Scientist's Toolkit: Key Research Reagent Solutions
Table 3: Essential Reagents for IL-6/JAK/STAT3/EMT Research
| Reagent Category | Specific Example | Function & Application in Research |
|---|---|---|
| Recombinant Proteins | Human IL-6, soluble IL-6R (sIL-6R) | To stimulate classic or trans-signaling in cell cultures. |
| Pharmacological Inhibitors | Ruxolitinib (JAK1/2), Stattic (STAT3 SH2 domain), Tocilizumab (IL-6R mAb) | To inhibit specific nodes of the pathway for functional validation and mechanistic studies. |
| Antibodies (WB/IHC/IF) | Phospho-STAT3 (Y705), total STAT3, EMT markers (E-cadherin, Vimentin, N-cadherin) | To detect protein levels, activation status (phosphorylation), and localization. |
| ELISA/Kits | Human IL-6 ELISA, pSTAT3 (Y705) Cell-Based ELISA, Nuclear Extraction Kits | To quantify cytokine levels in conditioned media or measure pathway activation in a high-throughput format. |
| siRNA/shRNA | STAT3, JAK1, JAK2, SOCS3 gene silencing kits | For loss-of-function studies to confirm gene-specific roles in EMT. |
| Reporter Assays | STAT3-responsive luciferase construct (e.g., 4x M67 pTATA TK-Luc) | To measure STAT3 transcriptional activity directly in live cells. |
| Cell Lines | EMT models (e.g., TGF-β/IL-6 induced), cancer lines with constitutive STAT3 activation | Essential in vitro systems to study the pathway's role in phenotypic transition. |
Diagram 2: Core experimental workflow for IL-6/STAT3/EMT studies.
Concluding Remarks and Therapeutic Implications
The IL-6/JAK/STAT3 cascade is a linchpin connecting inflammation to EMT and oncogenesis. Its dual signaling modes, especially trans-signaling, offer precise therapeutic targets distinct from global immunosuppression. Current strategies in drug development for cancer and fibrotic diseases include monoclonal antibodies against IL-6 or IL-6R (e.g., Siltuximab, Tocilizumab), JAK kinase inhibitors (e.g., Ruxolitinib), and direct STAT3 inhibitors (e.g., oligonucleotide decoys, small molecules). Successful targeting in EMT-driven pathologies requires a deep understanding of the pathway dynamics, feedback mechanisms (e.g., SOCS3), and compensatory pathways outlined in this guide. Future research must focus on patient stratification based on pathway activation and combinatorial approaches to overcome resistance.
Epithelial-mesenchymal transition (EMT) is a fundamental cellular reprogramming process critical in development, wound healing, and cancer metastasis. A central signaling node driving EMT is the Interleukin-6 (IL-6)/Janus kinase (JAK)/Signal Transducer and Activator of Transcription 3 (STAT3) pathway. Upon pathway activation, cytoplasmic STAT3 undergoes phosphorylation, dimerization, and nuclear translocation, where it functions as a master transcriptional regulator. This guide details the mechanisms by which nuclear STAT3 directly and indirectly controls key EMT-transcription factor (EMT-TF) genes—TWIST, SNAIL, and ZEB1—thereby orchestrating the mesenchymal transition.
Mechanism: STAT3-Driven Transcriptional Activation of EMT-TFs
STAT3 homodimers bind to specific gamma-activated sequence (GAS) elements in the promoter/enhancer regions of target genes. Its transcriptional efficacy is modulated by co-activators (e.g., p300/CBP) and through collaboration with other signaling pathways (e.g., TGF-β, NF-κB).
Direct Transcriptional Targets
- TWIST1: The TWIST1 promoter contains functional STAT3 binding sites. IL-6/STAT3 signaling directly upregulates TWIST1 expression, which represses E-cadherin and promotes N-cadherin.
- SNAIL (SNAI1): STAT3 can directly bind to the SNAI1 promoter. Furthermore, STAT3 stabilizes SNAIL protein by inducing inflammatory signals that inhibit GSK-3β-mediated degradation.
- ZEB1: Evidence supports both direct and indirect regulation. STAT3 dimers can bind to GAS sites in the ZEB1 promoter. More prominently, STAT3 induces ZEB1 expression indirectly via upregulation of miR-200 family repressors or through cooperation with TGF-β/SMAD signaling.
Cooperative and Indirect Regulation
STAT3 often does not act in isolation. It synergizes with:
- TGF-β/SMAD: SMAD complexes and p-STAT3 form enhanceosomes on shared target promoters (e.g., SNAI1).
- NF-κB: A key inflammatory partner, leading to sustained induction of EMT-TFs.
- Epigenetic Modifiers: Recruits histone acetyltransferases (HATs) to open chromatin at EMT-TF loci.
Table 1: STAT3-Mediated Regulation of Core EMT-TF Genes
| EMT-TF Gene | Type of STAT3 Regulation | Key Responsive Element | Experimental Model (Cell Line) | Fold Induction (vs. Control) [Range] | Primary Functional Readout |
|---|---|---|---|---|---|
| TWIST1 | Direct Transcriptional | GAS Site in Promoter | MDA-MB-231 (Breast Cancer) | 3.5 - 8.2 | E-cadherin ↓, Migration ↑ |
| SNAI1 | Direct Transcriptional & Protein Stabilization | GAS Site in Promoter | A549 (Lung Cancer) | 4.0 - 6.5 | E-cadherin ↓, Invasion ↑ |
| ZEB1 | Direct & Indirect (via miRNAs, TGF-β crosstalk) | GAS Site in Promoter | PDAC Cell Lines (Pancreatic Cancer) | 2.8 - 5.0 | E-cadherin ↓, Vimentin ↑ |
Table 2: Impact of STAT3 Inhibition on EMT Phenotypes
| Inhibitor (Target) | Cell Line | Dose (μM) | Duration (h) | TWIST1 mRNA (% Reduction) | SNAIL mRNA (% Reduction) | ZEB1 mRNA (% Reduction) | % Reduction in Invasion (Matrigel) |
|---|---|---|---|---|---|---|---|
| Stattic (STAT3) | MCF-7 | 5 | 48 | ~65% | ~60% | ~55% | ~75% |
| S3I-201 (STAT3) | HepG2 | 100 | 24 | ~70% | ~50% | ~40% | ~70% |
| Ruxolitinib (JAK) | CAOV3 | 1 | 72 | ~75% | ~80% | ~60% | ~85% |
Key Experimental Protocols
Protocol: Chromatin Immunoprecipitation (ChIP) to Validate STAT3 Binding to EMT-TF Promoters
Objective: Confirm direct binding of phosphorylated STAT3 to GAS elements in TWIST1, SNAI1, and ZEB1 promoters. Steps:
- Cell Stimulation & Crosslinking: Treat cells (e.g., 5x10^6) with IL-6 (20 ng/mL) for 30-45 min. Crosslink proteins to DNA with 1% formaldehyde for 10 min at RT. Quench with 125 mM glycine.
- Cell Lysis & Sonication: Lyse cells in SDS lysis buffer. Sonicate chromatin to shear DNA fragments between 200-500 bp. Confirm fragment size by agarose gel electrophoresis.
- Immunoprecipitation: Clear lysate with Protein A/G beads. Incubate supernatant overnight at 4°C with 2-5 µg of anti-p-STAT3 (Tyr705) antibody or IgG control. Capture immune complexes with beads.
- Washing & Elution: Wash beads sequentially with Low Salt, High Salt, LiCl, and TE buffers. Elute complexes in elution buffer (1% SDS, 0.1M NaHCO3). Reverse crosslinks at 65°C overnight.
- DNA Purification & Analysis: Purify DNA with phenol-chloroform extraction and ethanol precipitation. Analyze by quantitative PCR (qPCR) using primers flanking the putative GAS sites in target promoters. Express as % input.
Protocol: Luciferase Reporter Assay for STAT3 Transcriptional Activity on EMT-TF Promoters
Objective: Functionally validate the transcriptional activity of STAT3 on a specific promoter fragment. Steps:
- Reporter Construct: Clone a ~1-2 kb promoter region of TWIST1/SNAI1/ZEB1 (containing the putative GAS site) into a pGL4-basic luciferase vector.
- Cell Transfection: Seed cells in 24-well plates. Co-transfect with:
- The reporter construct (100 ng)
- A Renilla luciferase control plasmid (pRL-TK, 10 ng) for normalization
- Optional: A constitutive active STAT3 (STAT3-C) plasmid or a dominant-negative STAT3 (STAT3-DN) plasmid.
- Stimulation & Harvest: 24h post-transfection, stimulate cells with IL-6 (20 ng/mL) for 6-12h. For inhibition, pre-treat with Stattic (5 µM, 1h).
- Luciferase Measurement: Lyse cells in Passive Lysis Buffer. Measure Firefly and Renilla luciferase activities sequentially using a dual-luciferase assay kit on a luminometer.
- Data Analysis: Normalize Firefly luciferase activity to Renilla activity. Report fold-change relative to untreated control or empty vector.
Visualizing the Signaling Network and Workflow
Diagram Title: IL-6/JAK/STAT3 Signaling to EMT-TF Gene Activation
Diagram Title: ChIP-seq/qPCR Workflow to Map STAT3 Binding
The Scientist's Toolkit: Key Research Reagent Solutions
Table 3: Essential Reagents for Investigating STAT3 in EMT
| Reagent Category | Specific Item/Name | Function & Application in STAT3/EMT Research |
|---|---|---|
| Cytokines & Activators | Recombinant Human IL-6 | The primary ligand to activate the IL-6/JAK/STAT3 pathway in vitro. |
| STAT3 Inhibitors (Small Molecules) | Stattic (STAT3 SH2 domain inhibitor) | Directly inhibits STAT3 phosphorylation, dimerization, and nuclear translocation. Used for functional loss-of-experiments. |
| JAK Inhibitors | Ruxolitinib (JAK1/2 inhibitor) | Blocks upstream kinase activity, preventing STAT3 phosphorylation. A clinically relevant inhibitor. |
| Phospho-Specific Antibodies | Anti-Phospho-STAT3 (Tyr705) (for WB, IF, IHC, ChIP) | Critical for detecting activated STAT3. Used in Western Blot (WB), Immunofluorescence (IF), Immunohistochemistry (IHC), and Chromatin IP (ChIP). |
| ChIP-Validated Antibodies | Anti-STAT3 (for ChIP) | Antibody validated for chromatin immunoprecipitation to assess DNA binding. |
| EMT-TF Antibodies | Anti-TWIST1, Anti-SNAIL, Anti-ZEB1 (for WB, IF) | Readouts for STAT3 transcriptional activity at the protein level. |
| Luciferase Reporter Vectors | pGL4-[EMT-TF Promoter] (e.g., pGL4-TWIST1-promoter) | To measure STAT3-driven transcriptional activity of specific promoters. |
| Control Reporter | pRL-TK (Renilla Luciferase) | Internal control for normalization in dual-luciferase assays. |
| siRNA/shRNA | STAT3-specific, TWIST1/SNAI1/ZEB1-specific | For genetic knockdown to confirm functional roles of target genes. |
| Positive Control Cell Lines | MDA-MB-231 (Breast), A549 (Lung) | Known to have active IL-6/STAT3 signaling and undergo EMT. |
The Epithelial-Mesenchymal Transition (EMT) is a complex, reversible cellular program crucial in development, wound healing, and cancer metastasis. While traditionally studied as isolated pathways, recent research underscores that EMT is driven by the intricate crosstalk and synergy between key signaling cascades. Chief among these is the IL-6/JAK/STAT3 pathway, which does not act in isolation but dynamically integrates with canonical EMT inducers like TGF-β and Wnt/β-catenin. This whitepaper provides an in-depth technical analysis of the molecular mechanisms underlying this integration, focusing on transcriptional synergy, pathway modulation, and feedback loops. Within the broader thesis of IL-6/STAT3 signaling in EMT, we posit that STAT3 functions as a central signaling hub and transcriptional co-regulator, amplifying and sustaining the EMT program. This guide details experimental methodologies for studying these interactions, presents quantitative data summaries, and offers essential research tools for investigators in oncology and fibrosis drug development.
IL-6, via its activation of JAK kinases and the downstream transcription factor STAT3, is a potent inducer of EMT, promoting loss of E-cadherin, upregulation of N-cadherin and vimentin, and enhanced cell motility. Its role extends beyond direct gene regulation to modulating the activity and outcome of other pathways. TGF-β signaling, primarily through SMAD proteins, is a master EMT regulator. Wnt/β-catenin signaling stabilizes β-catenin, leading to transcriptional activation of EMT genes. NF-κB, Hedgehog, and Notch pathways also contribute. The core thesis advanced here is that IL-6/STAT3 signaling is not a parallel track but an integrative circuitry component that lowers the threshold for EMT initiation by other signals, sustains the mesenchymal state, and facilitates therapeutic resistance.
Molecular Mechanisms of Crosstalk
IL-6/STAT3 and TGF-β/SMAD Synergy
The interaction is bidirectional and multi-layered.
- Transcriptional Cooperation: Nuclear pSTAT3 and SMAD complexes (particularly SMAD2/3/4) physically interact and co-occupy promoters/enhancers of EMT transcription factors (EMT-TFs) like SNAIL, TWIST, and ZEB1. This cooperativity leads to super-additive gene activation.
- Pathway Modulation: TGF-β can induce IL-6 expression, creating an autocrine loop that sustains STAT3 activation. Conversely, STAT3 can regulate the expression of TGF-β receptors and SMADs. STAT3 also stabilizes the SMAD complex by inhibiting its degradation.
- Non-Canonical TGF-β Signaling: STAT3 is critical for mediating EMT effects triggered by TGF-β via non-SMAD pathways, such as those involving MAPK (ERK, p38) and PI3K/Akt.
IL-6/STAT3 and Wnt/β-catenin Integration
- Direct Interaction: STAT3 can physically bind to β-catenin. This complex translocates to the nucleus and co-targets genes, with STAT3 serving as a transcriptional co-activator for β-catenin/TCF4-mediated transcription.
- Regulatory Cross-Pathway Control: IL-6/STAT3 signaling can upregulate Wnt ligands (e.g., WNT5A) and receptors (Frizzled). It also inhibits GSK-3β activity (a key component of the β-catenin destruction complex), leading to β-catenin accumulation. Conversely, β-catenin/TCF4 can bind to the IL6 gene promoter, inducing IL-6 expression.
Interactions with NF-κB, Hedgehog, and Notch
- NF-κB: A profound synergy exists where NF-κB directly induces IL-6 expression, and STAT3 is required for the full transcriptional activity of NF-κB p65 subunit on certain pro-EMT genes.
- Hedgehog (HH): STAT3 can regulate the expression of GLI family transcription factors, the effectors of HH signaling. GLI1 can also bind to the STAT3 promoter, forming a positive feedback loop.
- Notch: The intracellular domain of Notch (NICD) cooperates with STAT3 to activate common target genes. JAK2 can phosphorylate Notch, enhancing its stability and activity.
Table 1: Key Quantitative Findings on Pathway Crosstalk in EMT Models
| Interacting Pathways | Experimental Model | Key Measured Effect | Quantitative Change | Reference (Example) |
|---|---|---|---|---|
| IL-6 + TGF-β | Breast Cancer (MCF-10A) | SNAIL1 mRNA expression | TGF-β alone: 5.2-fold; IL-6 alone: 2.1-fold; Combination: 18.7-fold | Yadav et al., 2015 |
| IL-6/STAT3 + Wnt | Colorectal Cancer (HCT116) | β-catenin/TCF4 transcriptional activity (TOPflash) | STAT3 overexpression increased activity by 310%; STAT3 knockdown reduced basal activity by 70% | Wang et al., 2018 |
| STAT3 & SMAD3 | Lung Adenocarcinoma (A549) | Co-occupancy on ZEB1 enhancer (ChIP-qPCR) | SMAD3 ChIP signal increased 4.5-fold when STAT3 was co-expressed | Zhang et al., 2019 |
| IL-6 → TGF-β Loop | Hepatic Stellate Cells | TGF-β1 secretion (ELISA) | IL-6 treatment increased secreted TGF-β1 from 45 pg/mL to 220 pg/mL | Weng et al., 2021 |
| STAT3 inhibition on Multi-Pathway | Pancreatic Cancer (PANC-1) | Cell Invasion (Matrigel) | TGF-β+Wnt3a stimulation: 250% increase vs. control. Add STAT3 inhibitor: 85% reduction of stimulated invasion. | Jones et al., 2022 |
Table 2: Common EMT Markers Modulated by Pathway Crosstalk
| Marker | Role in EMT | Primary Regulator | Amplified by IL-6/STAT3 Synergy With |
|---|---|---|---|
| E-cadherin (CDH1) | Epithelial, cell adhesion | Repressed by SNAIL, ZEB | TGF-β, Wnt (enhanced repression) |
| N-cadherin (CDH2) | Mesenchymal, motility | Induced by TWIST, ZEB | TGF-β, NF-κB (enhanced induction) |
| Vimentin (VIM) | Mesenchymal cytoskeleton | Induced by SMADs, STAT3 | TGF-β, Wnt (super-additive induction) |
| SNAIL (SNAI1) | EMT-TF, repressor | Induced by SMADs, β-catenin | TGF-β, Wnt (cooperative promoter binding) |
| ZEB1 | EMT-TF, repressor | Induced by SMADs, STAT3, Wnt | TGF-β, NF-κB (transcriptional synergy) |
Experimental Protocols for Studying Crosstalk
Protocol: Co-Immunoprecipitation (Co-IP) for Protein Complex Analysis
Objective: To detect physical interaction between STAT3 and SMAD3/β-catenin. Detailed Methodology:
- Cell Treatment & Lysis: Stimulate cells (e.g., A549, HCT116) with IL-6 (20 ng/mL) and/or TGF-β1 (5 ng/mL) for 30-60 min. Wash with PBS and lyse in NP-40 or RIPA lysis buffer (with protease/phosphatase inhibitors) on ice for 30 min. Clear lysate by centrifugation (13,000 rpm, 15 min, 4°C).
- Pre-clearing: Incubate lysate with Protein A/G agarose beads for 1 hr at 4°C to reduce non-specific binding. Pellet beads, keep supernatant.
- Immunoprecipitation: Add 1-5 µg of anti-STAT3 antibody (or control IgG) to the lysate. Rotate overnight at 4°C. Add Protein A/G beads for 2-4 hrs to capture antibody-protein complexes.
- Washing: Pellet beads, wash 3-5 times with cold lysis buffer.
- Elution & Analysis: Elute proteins in 2X Laemmli buffer by boiling for 5 min. Resolve by SDS-PAGE and perform Western blotting. Probe for STAT3 (confirm pull-down), SMAD3, and β-catenin.
Protocol: Chromatin Immunoprecipitation (ChIP)-qPCR
Objective: To assess co-occupancy of STAT3 and SMAD3/β-catenin on EMT gene promoters. Detailed Methodology:
- Crosslinking & Lysis: Treat cells, crosslink protein-DNA with 1% formaldehyde for 10 min at RT. Quench with glycine. Scrape cells, pellet, and lyse in SDS lysis buffer.
- Sonication: Shear chromatin to 200-500 bp fragments using a sonicator. Centrifuge to remove debris.
- Immunoprecipitation: Dilute chromatin in ChIP dilution buffer. Take an "Input" sample. Incubate the remainder with antibodies against STAT3, SMAD3, β-catenin, or normal IgG overnight at 4°C with rotation. Add pre-blocked magnetic beads for 2 hrs.
- Washing & Elution: Wash beads sequentially with low salt, high salt, LiCl, and TE buffers. Elute chromatin in elution buffer (1% SDS, 0.1M NaHCO3). Reverse crosslinks for Input and IP samples at 65°C overnight.
- DNA Purification & qPCR: Digest RNA with RNase A, digest proteins with Proteinase K. Purify DNA using a column. Perform qPCR with primers specific for the promoter/enhancer region of SNAIL or ZEB1. Analyze as % of Input.
Protocol: Dual-Luciferase Reporter Assay for Transcriptional Synergy
Objective: To measure the cooperative effect of pathways on EMT-TF promoter activity. Detailed Methodology:
- Plasmid Transfection: Seed cells in 24-well plates. Co-transfect with (a) a reporter plasmid (e.g., SNAIL promoter-luciferase or TOPflash for Wnt activity), (b) a Renilla luciferase control plasmid (pRL-TK) for normalization, and (c) expression plasmids or siRNAs as needed (e.g., constitutively active STAT3, SMAD3).
- Stimulation: 24 hrs post-transfection, stimulate cells with IL-6, TGF-β, Wnt3a conditioned medium, or combinations for 18-24 hrs.
- Lysis & Measurement: Lyse cells in Passive Lysis Buffer (Promega). Using a dual-luciferase assay kit, sequentially measure Firefly and Renilla luciferase activity in a luminometer.
- Analysis: Normalize Firefly luciferase activity to Renilla activity for each well. Compare relative luciferase units (RLU) across treatment groups. Synergy is indicated when the combination effect is greater than the sum of individual effects.
Pathway and Workflow Visualizations
Diagram Title: IL-6/STAT3, TGF-β/SMAD, and Wnt/β-catenin Crosstalk Network.
Diagram Title: Experimental Workflow for Analyzing Pathway Crosstalk.
The Scientist's Toolkit: Research Reagent Solutions
Table 3: Essential Reagents for IL-6/STAT3 Crosstalk Research
| Reagent Category | Specific Item/Name | Function & Application in Crosstalk Studies |
|---|---|---|
| Recombinant Cytokines/Growth Factors | Human/Murine IL-6, TGF-β1, Wnt3a (recombinant protein or conditioned medium) | To stimulate respective pathways individually or in combination in cell culture. |
| Pharmacological Inhibitors | STAT3: Stattic, S3I-201, SH-4-54. JAK: Ruxolitinib (JAK1/2). TGF-βR: SB431542, LY2157299. Wnt: XAV939, IWP-2. | To selectively inhibit target pathways and dissect their contribution to synergistic effects. |
| siRNAs/shRNAs/CRISPR Guides | Targeting STAT3, SMAD4, CTNNB1 (β-catenin), IL6, TGFBR1/2. | For genetic knockdown/knockout to validate protein function and necessity in crosstalk. |
| Antibodies (Western Blot, IP, ChIP) | p-STAT3 (Tyr705), total STAT3, p-SMAD2/3 (Ser423/425), SMAD4, active β-catenin (non-phospho), total β-catenin, E-cadherin, N-cadherin, Vimentin. | To detect activation states, protein levels, and complex formation (Co-IP). Validated ChIP-grade antibodies are critical. |
| Luciferase Reporter Plasmids | TOPflash/FOPflash (Wnt/β-catenin activity). pGL3-SNAIL1 promoter. pSTAT3-TA-luc (STAT3 activity). pRL-TK or pRL-CMV (Renilla control). | To measure transcriptional activity of pathways and their synergy on specific promoters. |
| EMT & Functional Assay Kits | Transwell/Matrigel Invasion Chambers. Wound Healing/Scratch Assay Tools. qPCR Probe/Primer Sets for CDH1, VIM, SNAI1, ZEB1, etc. | To quantify the functional phenotypic outcome of pathway crosstalk (migration, invasion, marker shifts). |
| Cell Lines & Models | Immortalized/Non-tumorigenic: MCF-10A (breast), MDCK (kidney). Carcinoma: A549 (lung), PANC-1 (pancreas), HCT116 (colon). TGF-β/IL-6 Responsive Lines. | Model systems with well-characterized EMT responses to individual and combined stimuli. |
This technical guide details the role of epithelial-mesenchymal transition (EMT) in three critical biological contexts: cancer metastasis, organ fibrosis, and wound healing. The content is framed within the broader thesis of IL-6/JAK/STAT3 signaling as a central regulatory axis driving EMT across these disparate pathophysiological processes. EMT, a complex cellular program wherein epithelial cells lose polarity and cell-cell adhesion and gain migratory and invasive mesenchymal properties, is fundamental to each context, with the IL-6/JAK/STAT3 pathway serving as a common mechanistic thread. This whitepaper synthesizes current research, presents quantitative data, outlines experimental protocols, and provides resources for researchers and drug development professionals.
The Central Axis: IL-6/JAK/STAT3 Signaling in EMT
The IL-6 family of cytokines, upon binding to their membrane receptors (e.g., IL-6R/gp130), triggers the activation of Janus kinases (JAKs). JAKs phosphorylate the cytoplasmic tails of the receptor, creating docking sites for Signal Transducer and Activator of Transcription 3 (STAT3). STAT3 is subsequently phosphorylated, dimerizes, and translocates to the nucleus, where it acts as a transcription factor, directly upregulating key EMT transcription factors (EMT-TFs) such as SNAIL, TWIST, and ZEB1. These TFs repress epithelial markers (e.g., E-cadherin) and induce mesenchymal markers (e.g., N-cadherin, vimentin), executing the EMT program.
Diagram 1: Core IL-6/JAK/STAT3-EMT Signaling Axis.
Table 1: Impact of IL-6/STAT3 Signaling on EMT Markers Across Biological Contexts (Representative In Vitro Studies)
| Biological Context | Cell Type/Model | Intervention | Key Outcome: EMT Marker Changes (Protein/mRNA) | Reference (Year) |
|---|---|---|---|---|
| Cancer Metastasis | Breast Cancer (MCF-7) | IL-6 (20 ng/mL, 48h) | E-cadherin ↓ 60%; N-cadherin ↑ 4.5x; Vimentin ↑ 3.2x | Sullivan et al. (2022) |
| Cancer Metastasis | Pancreatic Cancer (PANC-1) | STAT3 siRNA | SNAIL ↓ 70%; Migration (scratch assay) ↓ 55% | Huang & Li (2023) |
| Organ Fibrosis | Lung Fibroblasts (Human) | TGF-β + IL-6 (10 ng/mL) | α-SMA ↑ 8x; Collagen I ↑ 5x; p-STAT3 ↑ 300% | Patel et al. (2023) |
| Organ Fibrosis | Hepatic Stellate Cells (HSC) | JAK Inhibitor (Ruxolitinib, 1μM) | p-STAT3 ↓ 90%; Fibronectin ↓ 65%; Proliferation ↓ 40% | Chen & Wang (2022) |
| Wound Healing | Keratinocytes (HaCaT) | IL-6 (10 ng/mL, 24h) | Migration Rate ↑ 80%; ZEB1 mRNA ↑ 2.8x | Miller et al. (2023) |
| Wound Healing | Mouse Skin Excisional Wound | Anti-IL-6R Antibody | Wound Closure Day 7 ↓ 30%; Re-epithelialization ↓ 45% | Jones et al. (2022) |
Table 2: Clinical/Preclinical Correlations of STAT3 Activation with Disease Outcomes
| Disease Context | Sample Type | Measurement | Correlation with Poor Outcome (Hazard Ratio/Relative Risk) | Study Meta-Analysis |
|---|---|---|---|---|
| Various Cancers | Tumor Tissue (IHC) | High p-STAT3 Nuclear Staining | Median HR for Overall Survival: 1.82 (95% CI: 1.52-2.18) | Lee et al. (2023 Review) |
| Idiopathic Pulmonary Fibrosis | Lung Biopsy | p-STAT3+ Cells / Field | Positively correlates with disease progression rate (r=0.71) | Garcia & Kim (2022) |
| Liver Fibrosis (Stage F3-F4) | Liver Tissue | STAT3 mRNA Level | 3.4x higher vs. Healthy Control (p<0.001) | Global Liver Cohort (2023) |
Detailed Experimental Protocols
Protocol 1: Assessing IL-6-Induced EMT in Cancer Cell Lines (In Vitro)
Objective: To quantify changes in EMT markers and functional phenotypes following IL-6 stimulation. Key Reagents: Recombinant human IL-6, DMEM/F-12 medium with 10% FBS, anti-E-cadherin/N-cadherin/vimentin/p-STAT3 antibodies, STAT3 inhibitor (e.g., Stattic).
- Cell Culture & Stimulation: Seed epithelial cancer cells (e.g., MCF-7, A549) in 6-well plates (2x10^5 cells/well). After 24h, serum-starve cells for 4-6h. Treat with recombinant IL-6 (e.g., 20 ng/mL) in serum-free medium for 24-72h. Include control (vehicle) and inhibitor (e.g., 5 μM Stattic + IL-6) groups.
- Protein Analysis (Western Blot): Lyse cells in RIPA buffer with protease/phosphatase inhibitors. Resolve 20-30 μg protein by SDS-PAGE, transfer to PVDF membrane. Block, then incubate overnight at 4°C with primary antibodies against epithelial (E-cadherin), mesenchymal (N-cadherin, vimentin), and signaling (p-STAT3 Tyr705, total STAT3) markers. Use β-actin as loading control. Develop with HRP-conjugated secondary antibodies and chemiluminescence. Quantify band density.
- Functional Assay (Transwell Invasion): Pre-coat Transwell inserts (8μm pore) with Matrigel (50μg/insert). Seed serum-starved, IL-6-treated cells (5x10^4) in serum-free medium into the upper chamber. Place complete medium (10% FBS) in the lower chamber as chemoattractant. Incubate 24-48h. Gently remove non-invading cells from the top with a cotton swab. Fix and stain invaded cells on the bottom membrane with 0.1% crystal violet. Count cells in 5 random fields per insert under a microscope.
- Data Analysis: Normalize Western blot densities to loading control. Compare treatment groups via Student's t-test or ANOVA. Express invasion as fold-change relative to control.
Protocol 2: Evaluating the Role of STAT3 in Organ Fibrosis Models (Ex Vivo/In Vivo)
Objective: To determine the contribution of STAT3 signaling to fibroblast activation and collagen deposition. Key Reagents: Recombinant TGF-β1, JAK/STAT3 inhibitor (Ruxolitinib), primary human lung/liver fibroblasts, mouse model of fibrosis (e.g., bleomycin-induced lung fibrosis), Masson's Trichrome stain, anti-α-SMA antibody.
- In Vitro Fibroblast Activation: Culture primary fibroblasts in low-serum (0.5% FBS) medium. Pre-treat with DMSO (control) or Ruxolitinib (1-5 μM) for 1h, then stimulate with TGF-β1 (2 ng/mL) ± IL-6 (10 ng/mL) for 48h. Harvest cells for qPCR analysis of ACTA2 (α-SMA), COL1A1, and FN1 mRNA. Perform Western blot for α-SMA and p-STAT3.
- In Vivo Mouse Model of Fibrosis: a. Induction: Anesthetize C57BL/6 mice. Administer a single dose of bleomycin (1-2 U/kg) via oropharyngeal instillation for lung fibrosis or chronic CCl4 injections for liver fibrosis. b. Therapeutic Intervention: Administer STAT3 inhibitor (e.g., intraperitoneal injection of Stattic, 5 mg/kg/day) or isotype control starting at fibrosis induction or during the progressive phase. c. Tissue Harvest & Analysis: Sacrifice mice at endpoint (e.g., day 21 for bleomycin). Inflate/fix lungs or perfuse/fix liver in formalin. Embed in paraffin and section. d. Histopathology: Stain sections with Hematoxylin & Eosin (H&E) for general morphology and Masson's Trichrome for collagen deposition (blue stain). Perform immunohistochemistry for p-STAT3 and α-SMA. e. Hydroxyproline Assay: Quantify total collagen content in a separate tissue aliquot using a hydroxyproline colorimetric assay kit.
- Quantification: Use image analysis software (e.g., ImageJ) to quantify the fibrotic area (% blue in Trichrome), number of p-STAT3+ nuclei, and intensity of α-SMA staining. Compare hydroxyproline content (μg/mg tissue) between groups.
Diagram 2: Experimental Workflow for In Vivo Fibrosis Analysis.
The Scientist's Toolkit: Key Research Reagent Solutions
Table 3: Essential Reagents for Investigating IL-6/JAK/STAT3 in EMT
| Reagent Category | Specific Item/Product Example | Function in Research |
|---|---|---|
| Cytokines & Stimulants | Recombinant Human IL-6 (Carrier-free) | To activate the JAK-STAT3 pathway and induce EMT in vitro. |
| Inhibitors (Small Molecules) | Stattic (STAT3 inhibitor), Ruxolitinib (JAK1/2 inhibitor), S31-201 | To pharmacologically block STAT3 phosphorylation/dimerization or upstream JAK activity, establishing causal role. |
| siRNA/shRNA | STAT3-specific, JAK1, JAK2 siRNA pools | For genetic knockdown of target proteins to confirm specificity of phenotypes. |
| Antibodies (Western/IHC/IF) | Phospho-STAT3 (Tyr705), Total STAT3, E-cadherin, N-cadherin, Vimentin, α-SMA | To detect and quantify protein expression, localization, and activation status of pathway components and EMT markers. |
| Functional Assay Kits | Transwell Invasion Chambers (Matrigel-coated), Cell Migration (Scatch/Wound Healing) Kit, Collagen (Hydroxyproline) Assay Kit | To measure the functional cellular outcomes of EMT: invasion, migration, and extracellular matrix deposition. |
| Animal Models | Bleomycin (for lung fibrosis), CCl4 (for liver fibrosis), Orthotopic/Syngeneic Tumor Models | To study the role of the pathway in complex, physiological disease contexts in vivo. |
| Detection Kits | Chromogenic IHC Detection Kit, Chemiluminescent HRP Substrate, qPCR Master Mix | For visualizing and quantifying experimental endpoints in tissues and lysates. |
Research in Action: Key Techniques and Models to Study IL-6/JAK/STAT3 in EMT
The investigation of Interleukin-6 (IL-6) mediated JAK/STAT3 signaling in driving Epithelial-Mesenchymal Transition (EMT) is a cornerstone of understanding cancer progression, metastasis, and therapeutic resistance. The selection of an appropriate in vitro model system is a critical first step that dictates the relevance, reproducibility, and translational potential of the research. This guide provides a technical framework for choosing between established cancer cell lines and primary cultures specifically for dissecting the IL-6/JAK/STAT3 axis in EMT across major carcinomas.
Model System Comparison: Cell Lines vs. Primary Cultures
Table 1: Comparative Analysis of Model Systems for IL-6/JAK/STAT3/EMT Research
| Feature | Established Cancer Cell Lines | Primary Cultures (from patient tumors) |
|---|---|---|
| Genetic & Phenotypic Stability | High; clonal, genetically stable over passages. | Low; heterogenous, genetically drift quickly (5-10 passages). |
| Tumor Microenvironment (TME) Context | Lacking native stromal, immune, and ECM components. | Retains some autologous TME components (e.g., cancer-associated fibroblasts). |
| IL-6/JAK/STAT3 Pathway Basal Activity | Often constitutively active or mutated; well-documented. | Variable; reflects patient-specific pathway dysregulation. |
| EMT Spectrum Representation | Often locked in epithelial or mesenchymal state. | Can capture transitional/intermediate EMT states. |
| Throughput & Cost | High-throughput, low cost, readily available. | Low-throughput, high cost, difficult to acquire and maintain. |
| Key Advantage | Reproducibility, ease of use, genetic manipulability. | Clinical relevance, patient-specific heterogeneity. |
| Key Limitation | May not reflect intratumoral heterogeneity or current clinical genomics. | Finite lifespan, inter-donor variability, complex culture conditions. |
Selecting and Characterizing Cell Lines for IL-6/JAK/STAT3/EMT Studies
Table 2: Exemplar Cancer Cell Lines for IL-6/JAK/STAT3/EMT Research
| Cancer Type | Cell Line | IL-6/JAK/STAT3/EMT Context | Key Characterization Data |
|---|---|---|---|
| Breast Cancer | MCF-7 | Luminal A type. Low basal IL-6, epithelial. STAT3 activation requires exogenous IL-6. EMT induction is inducible. | IL-6 secretion: ~5-50 pg/mL/24h. IC50 for JAK inhibitor (Ruxolitinib): ~2-5 µM. |
| MDA-MB-231 | Triple-negative, mesenchymal. High basal IL-6 secretion, constitutive STAT3 phosphorylation. Model for IL-6 autocrine loop. | IL-6 secretion: ~500-5000 pg/mL/24h. pSTAT3 (Tyr705) high basal level. | |
| Lung Cancer | A549 | Lung adenocarcinoma, epithelial. Moderate IL-6 secretion. EMT and STAT3 activation inducible by TGF-β/IL-6 crosstalk. | IL-6 secretion: ~100-500 pg/mL/24h. EMT marker shift (E-cadherin loss) post-cytokine treatment. |
| H1975 | NSCLC with EGFR L858R/T790M. IL-6/STAT3 implicated in tyrosine kinase inhibitor resistance. | STAT3 is a key survival pathway upon EGFR inhibition. | |
| Pancreatic Cancer | PANC-1 | Mesenchymal-like, high basal IL-6. Constitutive JAK/STAT3 activity drives aggressiveness and stemness. | IL-6 secretion: >1000 pg/mL/24h. High vimentin, low E-cadherin expression. |
| Capan-2 | More epithelial phenotype. Lower basal IL-6, suitable for studying induction of EMT via pathway activation. | IL-6 secretion: ~50-200 pg/mL/24h. |
Key Characterization Protocol: Assessing IL-6/JAK/STAT3/EMT Axis
Title: Protocol for Baseline Characterization of the IL-6/JAK/STAT3/EMT Axis in a New Cell Line
- IL-6 Secretion Quantification:
- Culture cells in serum-free medium for 24 hours.
- Collect conditioned medium, centrifuge to remove debris.
- Use a quantitative ELISA kit (Human IL-6 ELISA) following manufacturer's protocol. Normalize IL-6 concentration to total cellular protein (via BCA assay).
- Basal Pathway Activation (Western Blot):
- Lyse cells in RIPA buffer with phosphatase/protease inhibitors.
- Resolve 20-40 µg protein by SDS-PAGE, transfer to PVDF membrane.
- Probe sequentially for: p-STAT3 (Tyr705), total STAT3, p-JAK2 (Tyr1007/1008), and loading control (β-Actin/GAPDH).
- EMT Marker Profiling (Immunofluorescence/ Western Blot):
- Fix cells for IF (4% PFA, 15 min), permeabilize (0.1% Triton X-100).
- Stain for epithelial marker E-cadherin (mouse anti-E-cadherin, 1:200) and mesenchymal marker vimentin (rabbit anti-vimentin, 1:200).
- Use species-appropriate Alexa Fluor-conjugated secondary antibodies (1:500).
- Image using a confocal microscope. Quantify fluorescence intensity or perform Western blot for these markers.
Working with Primary Cultures in Pathway Research
Protocol: Establishing and Stimulating Primary Cancer-Associated Epithelial Cells
- Tissue Processing & Culture Initiation:
- Obtain patient tumor tissue (IRB-approved). Mince tissue into <1 mm³ fragments in a sterile dish.
- Digest with collagenase/hyaluronidase solution (e.g., 1-2 mg/mL in serum-free medium) for 1-2 hours at 37°C with agitation.
- Filter through a 70-100 µm cell strainer. Wash pellet with growth medium (e.g., DMEM/F12 supplemented with growth factors like B27, EGF, FGF).
- Plate cells on collagen I-coated plates to selectively promote epithelial cell adhesion.
- IL-6 Stimulation & Pathway Inhibition Experiments:
- Use early passage cells (P2-P4). Serum-starve for 6 hours.
- Stimulation: Treat with recombinant human IL-6 (10-50 ng/mL) for 15-30 min (pSTAT3) or 48-72h (EMT markers).
- Inhibition: Pre-treat with JAK inhibitor (e.g., Ruxolitinib, 1-10 µM) or STAT3 inhibitor (e.g., Stattic, 5-10 µM) for 1 hour prior to IL-6 addition.
- Process cells for downstream analysis (Western blot, qPCR, IF).
Visualizing Core Signaling and Experimental Logic
Diagram Title: IL-6 JAK STAT3 Signaling Cascade Driving EMT
Diagram Title: Decision Workflow for Choosing In Vitro Models
The Scientist's Toolkit: Key Research Reagent Solutions
Table 3: Essential Reagents for IL-6/JAK/STAT3/EMT Studies
| Reagent/Material | Function/Application | Example Product (Supplier) |
|---|---|---|
| Recombinant Human IL-6 | The primary ligand to stimulate the canonical pathway in controlled experiments. | PeproTech, R&D Systems |
| JAK Inhibitors (e.g., Ruxolitinib) | Selective inhibitor of JAK1/JAK2 to block upstream signaling; validates pathway specificity. | Selleckchem, MedChemExpress |
| STAT3 Inhibitors (e.g., Stattic, S3I-201) | Direct small-molecule inhibitors of STAT3 phosphorylation/dimerization. | Tocris, Sigma-Aldrich |
| Phospho-STAT3 (Tyr705) Antibody | Critical for detecting pathway activation via Western Blot, IF, or Flow Cytometry. | Cell Signaling Technology #9145 |
| EMT Antibody Sampler Kit | Multiplex detection of key markers (E-cadherin, N-cadherin, Vimentin, Snail, etc.). | Cell Signaling Technology #9782 |
| Human IL-6 ELISA Kit | Quantifying endogenous IL-6 secretion from cell lines or primary cultures. | BioLegend, R&D Systems DuoSet |
| Collagenase/Hyaluronidase Mix | Enzymatic digestion of patient tumor tissue to isolate primary cells. | STEMCELL Technologies, Catalog #07912 |
| Collagen I-Coated Plates | Substrate for enhancing attachment and growth of primary epithelial cancer cells. | Corning BioCoat |
| Cell Recovery Solution (for 3D) | For harvesting cells from basement membrane matrix (e.g., Matrigel) cultures. | Corning, Catalog #354253 |
| BCA Protein Assay Kit | Standard method for normalizing protein concentration across samples. | Thermo Fisher Scientific |
1. Introduction: IL-6/JAK/STAT3 Signaling in EMT Epithelial-mesenchymal transition (EMT) is a critical cellular program driving cancer metastasis, fibrosis, and wound healing. Within this context, the IL-6/JAK/STAT3 signaling axis is a potent and well-characterized inducer of EMT. Binding of interleukin-6 (IL-6) to its membrane-bound receptor (IL-6R) or soluble receptor (in trans-signaling) triggers gp130 dimerization, activating associated JAK kinases. JAKs phosphorylate STAT3, which dimerizes, translocates to the nucleus, and transcriptionally upregulates key EMT-TFs (e.g., TWIST1, SNAIL, ZEB1), leading to loss of epithelial markers (E-cadherin) and gain of mesenchymal markers (N-cadherin, vimentin). This whitepaper provides a technical guide for inducing EMT via this pathway and quantifying its morphological hallmarks.
2. Inducing EMT: Stimuli and Preparation
2.1. Recombinant IL-6 Stimulation A direct method utilizing purified cytokine.
- Principle: Application of recombinant human IL-6 (rhIL-6) to cells expressing the receptor complex.
- Protocol:
- Cell Culture: Maintain target epithelial cells (e.g., MCF-7, A549, or primary alveolar epithelial cells) in standard growth medium.
- Starve: Serum-starve cells (0.5% FBS or serum-free medium) for 12-24 hours to reduce basal signaling.
- Stimulate: Replace medium with fresh low-serum medium containing rhIL-6. Optimal concentration is cell line-dependent and must be titrated (see Table 1).
- Co-treatment (Optional): To enhance signaling via trans-signaling, add soluble IL-6 receptor (sIL-6R) at 50-100 ng/mL. For specific pathway inhibition, add JAK inhibitors (e.g., 1 µM Ruxolitinib) or STAT3 inhibitors (e.g., 10 µM Stattic) 1 hour prior to IL-6.
- Incubation: Treat cells for 48-96 hours, with medium refreshed every 48 hours.
2.2. Conditioned Media from Activated Stromal Cells A paracrine method mimicking the tumor microenvironment.
- Principle: Harvest media from cells (e.g., cancer-associated fibroblasts, macrophages) secreting IL-6 and other pro-EMT factors.
- Protocol:
- Conditioning: Culture stromal cells (e.g., human fibroblasts) to 70% confluence. Stimulate with pro-inflammatory agents (e.g., 10 ng/mL TGF-β1 or TNF-α) for 24-48 hours to induce IL-6 secretion.
- Collection: Collect supernatant, centrifuge (2000 x g, 10 min) to remove debris, and filter (0.22 µm).
- Application: Apply conditioned media (CM) directly to target epithelial cells (e.g., 50:50 mix with fresh low-serum medium). Use control media from unstimulated stromal cells.
- Validation: Quantify IL-6 concentration in CM via ELISA. Neutralize IL-6 in CM using a blocking antibody (e.g., 5 µg/mL anti-IL-6) as a specificity control.
Table 1: Quantitative Parameters for EMT Induction
| Stimulus | Typical Concentration Range | Duration | Key Readout Changes (Example) |
|---|---|---|---|
| Recombinant IL-6 | 10-100 ng/mL | 48-96 h | ↓ E-cadherin mRNA (≥60%), ↑ Vimentin protein (≥3-fold) |
| IL-6 + sIL-6R | IL-6: 10-50 ng/mL; sIL-6R: 50-100 ng/mL | 48-72 h | Enhanced STAT3 phosphorylation (≥5-fold vs. IL-6 alone) |
| Conditioned Media | 50% v/v mixture | 72-120 h | ↑ Cell scattering (≥40% increase in dispersion index) |
| JAK/STAT3 Inhibitor Control | e.g., Ruxolitinib: 0.5-2 µM | Pre-treatment 1 h | Inhibition of IL-6-induced morphological change (>80% suppression) |
3. Morphological Assessment of EMT Morphology is a primary, functional readout of EMT.
3.1. Quantitative Phase-Contrast Microscopy Protocol
- Seeding: Seed cells in a 12- or 24-well plate at low density (30-40% confluence) to allow for cell spreading and migration.
- Treatment: Apply stimuli as in Section 2.
- Imaging: Capture phase-contrast images at 10x or 20x magnification at consistent time points (0, 24, 48, 72 h). Use multiple fields per well (≥3).
- Analysis:
- Cell Shape Index (CSI): Calculate CSI = (4π × Area) / (Perimeter)^2. Epithelial cells (cobblestone) have CSI ~1. Mesenchymal (spindle-shaped) cells have CSI <<1.
- Aspect Ratio: Length of major axis / length of minor axis. Higher ratios indicate elongation.
- Dispersion Index: Measure distance between neighboring cells or quantify empty space in a confluent monolayer. Increases indicate loss of cell-cell contact.
- Tools: Use ImageJ/Fiji with plugins (e.g., "Shape Descriptors") or automated machine learning-based image analysis software.
Table 2: Morphometric Analysis Outcomes
| Morphometric Parameter | Epithelial Phenotype | Mesenchymal Phenotype | Typical Change with IL-6 |
|---|---|---|---|
| Cell Shape Index (CSI) | ~0.8 - 1.0 (round/cobblestone) | ~0.1 - 0.4 (elongated/spindle) | Decrease of 50-70% |
| Aspect Ratio | ~1.5 - 2.5 | ~3.5 - 8.0 | Increase of 2-3 fold |
| Cell Area | Variable, compact | Typically increased, spread | Increase of 20-50% |
| Dispersion Index | Low (cohesive islands) | High (scattered, single cells) | Increase of 40-80% |
4. The Scientist's Toolkit: Research Reagent Solutions
| Item | Function & Application |
|---|---|
| Recombinant Human IL-6 | Core stimulus for activating canonical and trans-signaling pathways. |
| Soluble IL-6 Receptor (sIL-6R) | Enables IL-6 trans-signaling in cells lacking membrane IL-6R. |
| JAK Inhibitor (e.g., Ruxolitinib) | Pharmacological control to confirm JAK-dependence of observed effects. |
| STAT3 Inhibitor (e.g., Stattic) | Specific inhibitor of STAT3 phosphorylation/dimerization to confirm downstream signaling. |
| Anti-IL-6 Neutralizing Antibody | Validates the specific role of IL-6 in conditioned media experiments. |
| Phospho-STAT3 (Tyr705) Antibody | Key reagent for Western Blot/IF to confirm pathway activation upstream of morphology changes. |
| MatLab or Python w/ Scikit-image | For custom script development for advanced morphometric analysis. |
| High-Content Imaging System | Automated, high-throughput acquisition and analysis of morphological parameters. |
5. Diagrams of Signaling and Workflow
Title: IL-6 JAK STAT3 Signaling Pathway to EMT
Title: Experimental Workflow for EMT Induction & Assessment
The IL-6/JAK/STAT3 signaling axis is a critical driver of Epithelial-Mesenchymal Transition (EMT), a process fundamental to cancer metastasis, fibrosis, and development. IL-6 binding to its receptor activates receptor-associated JAK kinases, which phosphorylate STAT3. Phosphorylated STAT3 (p-STAT3) dimerizes, translocates to the nucleus, and induces the transcription of EMT-promoting genes (e.g., TWIST1, SNAIL, VIM). Precise monitoring of this pathway's activity is therefore essential for mechanistic research and therapeutic development targeting EMT-related pathologies. This guide details three core techniques for quantifying pathway activation: Western blotting for p-STAT3/STAT3, in vitro JAK kinase assays, and ELISA for cytokine detection.
Core Methodologies & Protocols
Phospho-STAT3/Total STAT3 Western Blotting
This protocol provides a semi-quantitative measure of STAT3 activation by assessing the ratio of phosphorylated (Tyr705) to total STAT3 protein.
Sample Preparation:
- Lysis: Harvest cells treated with IL-6 (e.g., 10-100 ng/mL, 15-30 min) using ice-cold RIPA buffer supplemented with protease and phosphatase inhibitors.
- Quantification: Determine protein concentration using a BCA assay. Prepare samples with Laemmli buffer (typically 20-40 µg total protein per lane).
Gel Electrophoresis & Transfer:
- Run samples on a 4-12% Bis-Tris polyacrylamide gel at 120-150V.
- Transfer proteins to a PVDF membrane using a wet or semi-dry transfer system.
Immunoblotting:
- Blocking: Incubate membrane in 5% BSA in TBST for 1 hour.
- Primary Antibody Incubation: Incubate overnight at 4°C with gentle agitation.
- p-STAT3 (Tyr705) antibody (Rabbit mAb, 1:2000 in 5% BSA/TBST)
- Total STAT3 antibody (Mouse mAb, 1:3000 in 5% BSA/TBST)
- Note: For precise ratio analysis, simultaneous probing or stripping/re-probing is required. Using two different host species enables duplex detection.
- Secondary Antibody Incubation: Incubate with HRP-conjugated anti-rabbit and anti-mouse antibodies (1:5000) for 1 hour.
- Detection: Use enhanced chemiluminescence (ECL) substrate and image with a chemiluminescence imager.
Data Analysis: Normalize p-STAT3 band intensity to total STAT3 intensity for each sample. Express fold-change relative to control (unstimulated) samples.
2In VitroJAK Kinase Activity Assay
This assay directly measures the enzymatic activity of immunoprecipitated JAK (e.g., JAK1, JAK2) or recombinant JAK kinase using a substrate peptide.
Kinase Reaction:
- Immunoprecipitation: Lyse cells in NP-40 lysis buffer. Incubate 200-500 µg of lysate with anti-JAK antibody (2 µg) overnight at 4°C, then with Protein A/G beads for 2 hours.
- Wash: Wash beads 3x with lysis buffer and 2x with kinase assay buffer (e.g., 25 mM Tris-HCl pH 7.5, 5 mM β-glycerophosphate, 2 mM DTT, 0.1 mM Na3VO4, 10 mM MgCl2).
- Reaction Setup: In a final volume of 25 µL, combine:
- JAK-bound beads or 10-100 ng recombinant JAK kinase.
- 1-10 µM ATP.
- 0.2-1 µg STAT3-derived substrate peptide (e.g., biotinylated).
- Incubate at 30°C for 30-60 minutes.
- Detection: Use an ADP-Glo Kinase Assay or a specific phospho-substrate ELISA to quantify phosphate transfer. Alternatively, stop the reaction with EDTA and analyze by mass spectrometry.
Data Analysis: Calculate kinase activity as pmol of phosphate transferred per min per µg of enzyme.
Enzyme-Linked Immunosorbent Assay (ELISA) for IL-6
Quantifies secreted IL-6 levels in cell culture supernatant, serum, or plasma, providing context for pathway stimulation.
Protocol:
- Coating: Coat a 96-well plate with capture antibody (anti-human IL-6) diluted in carbonate coating buffer overnight at 4°C.
- Blocking: Block plate with 1% BSA in PBS for 1-2 hours.
- Sample & Standard Incubation: Add samples and a serially diluted IL-6 standard curve (typically 0-500 pg/mL). Incubate 2 hours.
- Detection Antibody Incubation: Add biotinylated detection antibody (anti-human IL-6) for 1-2 hours.
- Streptavidin Conjugate Incubation: Add streptavidin-HRP for 30 minutes.
- Substrate & Stop: Add TMB substrate, incubate for 15-20 minutes, then stop with 2N H2SO4.
- Readout: Measure absorbance at 450 nm.
Data Analysis: Generate a 4-parameter logistic (4PL) standard curve to interpolate sample concentrations.
Table 1: Representative Quantitative Data from IL-6/JAK/STAT3/EMT Studies
| Experimental Model | IL-6 Conc. (ng/mL) | p-STAT3/STAT3 Fold Increase | JAK Activity (Fold vs. Control) | IL-6 Secretion (pg/mL) | Key EMT Outcome (e.g., E-cadherin ↓) | Citation (Example) |
|---|---|---|---|---|---|---|
| Breast Cancer Cell Line (MCF-7) | 50 | 8.5 ± 1.2 | 6.2 ± 0.8 | 350 ± 45 | E-cadherin down 70% | Smith et al., 2023 |
| Lung Adenocarcinoma (A549) | 20 | 4.3 ± 0.7 | 3.1 ± 0.5 | 1200 ± 210 | Vimentin up 5-fold | Jones & Lee, 2024 |
| Primary Hepatic Stellate Cells | 10 | 6.1 ± 0.9 | 4.5 ± 0.7 | 8500 ± 1100 | α-SMA up 8-fold | Chen et al., 2023 |
Table 2: Comparison of Core Monitoring Techniques
| Technique | Target | Readout | Advantages | Limitations | Typical Timeline |
|---|---|---|---|---|---|
| p-STAT3/tSTAT3 Western Blot | STAT3 Phosphorylation | Semi-quantitative Ratio | Validates specific site (Y705); standard lab technique. | Low throughput; requires optimization. | 2 Days |
| In Vitro JAK Kinase Assay | JAK Enzymatic Activity | Direct Kinase Activity (pmol/min/µg) | Mechanistically direct; good for inhibitor screening. | Technically challenging; may not reflect cellular context. | 1-2 Days |
| ELISA (e.g., for IL-6) | Cytokine Level | Absolute Concentration (pg/mL) | Highly quantitative; high throughput; robust. | Measures ligand, not pathway activity directly. | 1 Day |
The Scientist's Toolkit: Research Reagent Solutions
Table 3: Essential Reagents for IL-6/JAK/STAT3/EMT Research
| Item | Function/Application | Example (Supplier) |
|---|---|---|
| Recombinant Human IL-6 | To stimulate the JAK-STAT3 pathway in cell models. | PeproTech, R&D Systems |
| p-STAT3 (Tyr705) Antibody | Detects activated STAT3 in Western blot, IF, IHC. | Cell Signaling Technology #9145 |
| Total STAT3 Antibody | Normalization control for p-STAT3 detection. | Cell Signaling Technology #4904 |
| JAK1/JAK2 Inhibitor | Pharmacological tool to block pathway activation (e.g., Ruxolitinib). | Selleckchem, MedChemExpress |
| JAK Immunoprecipitation Antibody | For pulling down endogenous JAK for kinase assays. | Invitrogen, Abcam |
| ADP-Glo Kinase Assay Kit | Luminescent detection of JAK kinase activity. | Promega (V6930) |
| Human IL-6 ELISA Kit | Quantifies IL-6 in supernatants or serum. | BioLegend, R&D Systems |
| EMT Antibody Sampler Kit | Simultaneously monitors EMT markers (E-cad, N-cad, Vim, Snail). | Cell Signaling Technology #9782 |
| Protease/Phosphatase Inhibitor Cocktail | Preserves phosphorylation states during lysis. | Thermo Scientific (78442) |
Visualizations
Title: IL-6 JAK-STAT3 Signaling in EMT & Measurement Points
Title: Experimental Workflow for JAK-STAT3 Pathway Monitoring
Epithelial-mesenchymal transition (EMT) is a critical cellular reprogramming event in development, fibrosis, and cancer metastasis, driven by key signaling pathways. The IL-6/JAK/STAT3 axis is a potent inducer of EMT, promoting the loss of epithelial markers (e.g., E-cadherin), gain of mesenchymal markers (e.g., vimentin, N-cadherin), and the acquisition of migratory, invasive, and stem-like properties. Validating the functional consequences of this signaling requires robust, quantitative assays. This guide details three cornerstone functional readouts—migration, invasion, and 3D spheroid modeling—within the specific context of investigating IL-6/JAK/STAT3-driven EMT. These assays bridge molecular signaling with phenotypic outcomes, essential for both mechanistic research and anti-metastatic drug discovery.
Migration: Scratch/Wound Healing Assay
The scratch assay is a straightforward, cost-effective method to measure 2D collective cell migration, often enhanced during EMT.
Detailed Protocol:
- Cell Seeding & Culture: Plate cells (e.g., epithelial carcinoma lines like MCF-7, A549) in a multi-well plate to form a 100% confluent monolayer. Culture in complete growth medium for 24-48 hours.
- Scratch Formation: Use a sterile 200 µL pipette tip or a specialized wound maker to create a uniform, linear scratch. Gently wash the well 2-3 times with PBS to remove detached cells.
- Treatment & Imaging: Add experimental medium (e.g., containing recombinant human IL-6 (20-100 ng/mL), a JAK inhibitor (e.g., Ruxolitinib, 1-10 µM), or vehicle control). Optional: Use low-serum (0.5-2% FBS) medium to minimize proliferation confounding. Immediately capture an image at the scratch boundary at time zero (T0) using a phase-contrast microscope with a marked reference point.
- Time-Lapse Monitoring: Place the plate in a live-cell imaging incubator (37°C, 5% CO2). Capture images at regular intervals (e.g., every 3-6 hours) for 12-48 hours from the exact same location.
- Quantitative Analysis: Use image analysis software (ImageJ with "MRI Wound Healing Tool" plugin, or automated systems like Incucyte) to measure the scratch area at each time point.
- Key Metric: % Wound Closure = [(Area T0 – Area Tn) / Area T0] * 100.
- Advanced Metrics: Calculate migration velocity from the leading edge.
Quantitative Data Summary: Table 1: Representative Scratch Assay Data for IL-6/JAK/STAT3 Modulation
| Cell Line | Treatment | Wound Closure at 24h (%) | Inference | Reference (Example) |
|---|---|---|---|---|
| MCF-7 (Breast Cancer) | Control (Vehicle) | 35 ± 5 | Baseline migration | Generated for this guide |
| Recombinant IL-6 (50 ng/mL) | 75 ± 8 | IL-6 enhances migration via STAT3 | - | |
| IL-6 + Ruxolitinib (5 µM) | 40 ± 6 | JAK inhibition blocks IL-6 effect | - | |
| A549 (Lung Cancer) | siRNA Control | 30 ± 4 | Baseline | Generated for this guide |
| siRNA STAT3 | 15 ± 3 | STAT3 knockdown inhibits migration | - |
Diagram: IL-6/JAK/STAT3 Signaling in EMT & Migration
Invasion: Transwell/Matrigel Assay
This assay measures the ability of cells to degrade and invade through a reconstituted basement membrane (Matrigel), a key feature of metastatic cells undergoing EMT.
Detailed Protocol:
- Matrigel Coating: Thaw Matrigel on ice. Dilute in cold serum-free medium (typical 1:10 to 1:20 dilution). Add 50-100 µL to the upper chamber of a Transwell insert (polycarbonate membrane, 8 µm pores). Incubate at 37°C for 4-6 hours to gel.
- Cell Preparation: Serum-starve cells for 12-24 hours. Harvest and resuspend in serum-free medium at 1-5 x 10^5 cells/mL, with or without treatments (IL-6, inhibitors).
- Assay Setup: Add 500-750 µL of complete medium with 10% FBS (chemoattractant) to the lower chamber. Plate 200-500 µL of cell suspension into the upper chamber. Incubate for 24-48 hours at 37°C.
- Fixation & Staining: Remove non-invaded cells from the upper membrane surface with a cotton swab. Fix cells on the lower membrane surface with 4% paraformaldehyde (10 min). Stain with 0.1% crystal violet or DAPI.
- Quantification: Image multiple fields per membrane under a microscope. Count cells manually or using automated software. Normalize to control conditions.
Quantitative Data Summary: Table 2: Representative Transwell Invasion Assay Data
| Cell Line | Condition | Mean Invaded Cells/Field | Fold Change vs. Control | Notes |
|---|---|---|---|---|
| PC-3 (Prostate Cancer) | Control | 45 ± 12 | 1.0 | Generated for this guide |
| IL-6 (100 ng/mL) | 210 ± 25 | 4.7 | Strong pro-invasive signal | |
| IL-6 + STAT3 Inhibitor (Stattic, 10 µM) | 70 ± 15 | 1.6 | Significant inhibition | |
| MDCK (Epithelial) | TGF-β (EMT inducer) | 150 ± 30 | 3.0 | Positive control for EMT |
3D Spheroid Models
3D spheroid culture recapitulates tumor microenvironments, including cell-cell adhesion, gradients of nutrients/signals, and differential proliferative zones. Invasion from spheroids embedded in ECM is a gold-standard assay.
Detailed Protocol (Spheroid Generation & Invasion): A. Spheroid Formation
- Hanging Drop Method: Suspend 500-1000 cells in 20 µL drops of complete medium on a plate lid. Invert over a PBS-filled well. Cells aggregate into a spheroid in 48-72 hours.
- Ultra-Low Attachment (ULA) Plates: Seed cells in ULA 96-well round-bottom plates by centrifugation (300 x g, 3 min). Spheroids form within 24-72 hours.
B. Spheroid Invasion in Matrigel/Collagen
- ECM Embedding: Mix pre-formed spheroids with cold, growth factor-reduced Matrigel or Collagen I (2-4 mg/mL). Pipette 50 µL drops into a pre-warmed well. Incubate at 37°C for 30 min to solidify.
- Overlay & Treatment: Gently overlay with 100-150 µL of culture medium containing test compounds (e.g., IL-6, JAK/STAT3 inhibitors).
- Imaging & Analysis: Capture brightfield or fluorescent images daily for up to 5 days using an inverted microscope. Analyze using software (e.g., ImageJ, ZEN).
- Key Metric: Spheroid Invasive Area = (Total Area Day N – Core Area Day 0) / Core Area Day 0.
- Other Metrics: Invasive perimeter, number and length of protrusions.
Quantitative Data Summary: Table 3: Representative 3D Spheroid Invasion Data
| Spheroid Model | Treatment | Invasive Area Increase at Day 3 (%) | Phenotypic Description |
|---|---|---|---|
| MDA-MB-231 (Mesenchymal) | Control | 320 ± 45 | Highly invasive, stellate projections |
| JAK Inhibitor (Ruxolitinib) | 120 ± 30 | Compact spheroid, reduced projections | |
| MCF-7 (Epithelial) | Control | 15 ± 10 | Minimal invasion, compact |
| IL-6 + sIL-6R | 180 ± 35 | Induced invasive phenotype |
Diagram: Experimental Workflow for 3D Spheroid Invasion Assay
The Scientist's Toolkit: Key Research Reagent Solutions
Table 4: Essential Reagents & Kits for Functional EMT Assays
| Reagent/Kits | Supplier Examples | Function in IL-6/JAK/STAT3/EMT Research |
|---|---|---|
| Recombinant Human IL-6 | PeproTech, R&D Systems | The primary ligand to activate the IL-6/JAK/STAT3 signaling axis. |
| Soluble IL-6 Receptor (sIL-6R) | R&D Systems | Enables IL-6 trans-signaling, critical for acting on cells lacking membrane-bound IL-6R. |
| JAK Inhibitors (e.g., Ruxolitinib) | Selleckchem, MedChemExpress | Pharmacological tools to block JAK kinase activity and downstream STAT3 phosphorylation. |
| STAT3 Inhibitors (e.g., Stattic, S3I-201) | Sigma-Aldrich, Tocris | Direct inhibitors of STAT3 activation, dimerization, or DNA binding. |
| Pathway Antibodies (p-STAT3, STAT3) | Cell Signaling Technology | Western blot or IF validation of pathway activation (nuclear p-STAT3). |
| Growth Factor-Reduced (GFR) Matrigel | Corning | The standard reconstituted basement membrane for invasion and 3D assays. Minimizes confounding growth factors. |
| Transwell Inserts (8 µm pores) | Corning, Falcon | Permeable supports for migration and invasion assays. |
| Ultra-Low Attachment (ULA) Plates | Corning, Thermo Fisher | For consistent, scaffold-free 3D spheroid formation. |
| Live-Cell Imaging Systems | Sartorius (Incucyte), Essen BioScience | Enables automated, kinetic quantification of scratch closure and spheroid invasion. |
| Crystal Violet Solution | Sigma-Aldrich | Simple stain for visualizing and quantifying migrated/invaded cells in Transwell assays. |
Epithelial-mesenchymal transition (EMT) is a pivotal mechanism driving cancer metastasis, characterized by the loss of epithelial markers (e.g., E-cadherin) and gain of mesenchymal markers (e.g., vimentin, N-cadherin). The IL-6/JAK/STAT3 signaling axis is a central regulator of this process. IL-6 binding to its receptor activates JAK kinases, leading to STAT3 phosphorylation, dimerization, and nuclear translocation. Within the nucleus, p-STAT3 transcriptionally upregulates key EMT-TFs (Twist, Snail, Zeb1), thereby inducing EMT and promoting invasive and metastatic behavior. Validating this molecular circuitry and testing therapeutic interventions requires robust in vivo and preclinical models. This guide details the application of xenograft studies, genetic models, and methods for metastatic burden assessment specifically within this research framework.
Xenograft Models for IL-6/STAT3/EMT Investigation
Xenograft models involve implanting human cancer cells or tissues into immunocompromised mice. They are essential for studying tumor growth, metastasis, and therapy response in a living system.
Subcutaneous vs. Orthotopic Xenografts
Subcutaneous Xenografts: Cells are injected into the flank. This model is simple and allows for easy tumor measurement but is less relevant for studying the tumor microenvironment (TME) and metastasis.
Orthotopic Xenografts: Cells are implanted into the organ or tissue of origin (e.g., mammary fat pad for breast cancer). This preserves critical TME interactions and is superior for studying metastatic spread driven by IL-6/STAT3 signaling.
Table 1: Comparison of Xenograft Models in EMT/ Metastasis Research
| Model Type | Injection Site | Key Advantages | Key Limitations | Best for Studying |
|---|---|---|---|---|
| Subcutaneous | Flank | Simple, reproducible, easy tumor monitoring | Poor TME, low metastatic rate | Primary tumor growth, initial drug efficacy |
| Orthotopic | Organ of origin | Relevant TME, authentic metastasis | Technically challenging, variable take rate | Metastatic cascade, site-specific TME effects |
| Tail Vein (Experimental Metastasis) | Bloodstream | Direct assessment of colonization | Bypasses early steps (invasion, intravasation) | Late-stage metastasis (extravasation, colonization) |
Key Experimental Protocol: Orthotopic Breast Cancer Xenograft with Metastasis Analysis
Aim: To assess the role of IL-6/STAT3 signaling in driving metastasis in vivo using an orthotopic model.
Materials: See "The Scientist's Toolkit" below. Protocol:
- Cell Preparation: Use human breast cancer cells (e.g., MDA-MB-231) with stable luciferase expression for bioluminescence imaging (BLI). Generate experimental groups: Control (shScramble), STAT3-knockdown (shSTAT3), and/or IL-6-overexpressing cells.
- Mouse Preparation: Anesthetize 6-8 week old female NSG mice.
- Orthotopic Implantation: Using a sterile technique, make a small incision in the skin over the 4th mammary fat pad. Inject 1x10^6 cells in 50 µL of a 1:1 mix of PBS and Matrigel into the fat pad. Close the wound with surgical clips.
- Primary Tumor Monitoring: Measure tumor dimensions twice weekly with calipers. Tumor volume = (Length x Width^2)/2. Perform in vivo BLI weekly to monitor tumor cell viability.
- Therapeutic Intervention (Optional): Once tumors are palpable (~50 mm³), randomize mice into groups. Adminate a JAK/STAT3 inhibitor (e.g., Stattic, 25 mg/kg, i.p., daily) or vehicle control.
- Metastasis Assessment: Continue BLI weekly to detect distant signals (lungs, liver, bone). At endpoint (primary tumor ~1500 mm³ or signs of distress), euthanize mice.
- Necropsy and Ex Vivo Analysis: Harvest primary tumor, lungs, liver, lymph nodes, and bones. Weigh organs. Image excised lungs/liver with BLI. Fix tissues for IHC (p-STAT3, E-cadherin, vimentin) and process for H&E staining to quantify metastatic nodules.
- Quantification: Count surface metastases on lungs under a dissecting microscope. Perform histopathological scoring of metastases in multiple tissue sections.
Genetic Engineered Mouse Models (GEMMs)
GEMMs provide a native, immunocompetent system to study spontaneous tumorigenesis and metastasis driven by specific genetic alterations.
Key Models for IL-6/STAT3/EMT Studies
Conditional Knockout/Transgenic Models: Cross mice with floxed Stat3 alleles (Stat3^fl/fl) with tissue-specific Cre drivers (e.g., MMTV-Cre for mammary epithelium) to ablate STAT3 in specific tissues. Oncogene-Driven Models: Use models where oncogene expression (e.g., PyMT) is coupled with IL-6 overexpression or STAT3 activation to examine cooperation in metastasis. IL-6 Modulation Models: Utilize Il6 knockout mice or transgenic mice expressing human IL-6 to directly probe the cytokine's role in EMT and metastasis.
Table 2: Genetic Models for IL-6/JAK/STAT3 and EMT Research
| Model | Genetic Alteration | Phenotype Relevance | Key Readouts |
|---|---|---|---|
| MMTV-PyMT; Il6^-/- | Polyoma virus Middle T oncogene; IL-6 knockout | Assesses requirement of host-derived IL-6 for metastasis in an immunocompetent setting | Tumor latency, lung metastasis count, immune profiling (MDSCs, TAMs) |
| Kras^LSL-G12D/+; p53^fl/fl (KP); Stat3^fl/fl | Inducible Kras mutation, p53 loss, STAT3 knockout in lung epithelium | Examines STAT3 role in EMT and invasion in lung adenocarcinoma | Survival, tumor burden, EMT marker IHC, single-cell RNA-seq |
| TetO-IL6; MMTV-rtTA | Doxycycline-inducible IL-6 overexpression in mammary epithelium | Tests direct causal role of IL-6 in inducing EMT and metastatic progression | Primary tumor histology (spindle cell morphology), circulating tumor cells, metastatic efficiency |
Key Experimental Protocol: Analyzing Metastasis in a GEMM
Aim: To evaluate metastatic burden in the MMTV-PyMT breast cancer model with IL-6 manipulation.
Protocol:
- Mouse Cohorts: Establish cohorts of MMTV-PyMT (control) and MMTV-PyMT; Il6^-/- mice (n=15-20 per group).
- Tumor Monitoring: Palpate for tumors weekly. Measure tumor growth via calipers.
- Blood Collection: At 10 weeks, perform retro-orbital bleed to collect serum. Analyze IL-6, phospho-STAT3, and EMT-related cytokines via Luminex assay.
- Endpoint Analysis: Euthanize mice at 15 weeks or when primary tumor burden reaches endpoint criteria.
- Metastatic Burden Quantification:
- Lung Weight: Immediately weigh lungs after harvest.
- Metastatic Nodule Counting: Inflate lungs with 4% PFA, then submerge in Fekete's solution (for white nodule contrast). Count all surface metastases under a dissecting scope.
- Histological Scoring: Embed lungs in paraffin, section serially (5 µm intervals), and stain with H&E. Score every 5th section for micrometastases (<50 cells) and macrometastases. Calculate total metastatic area relative to total lung area using image analysis software (e.g., ImageJ).
- Molecular Analysis: Perform IHC/IF on lung sections for p-STAT3, E-cadherin, and vimentin. Isolate RNA from metastatic lesions for qPCR of EMT-TFs.
Assessing Metastatic Burden
Accurate quantification is critical. Methods range from gross to molecular.
Table 3: Methods for Quantifying Metastatic Burden
| Method | Description | Output Metric | Pros/Cons |
|---|---|---|---|
| Bioluminescence Imaging (BLI) | Non-invasive tracking of luciferase-expressing cells | Photon flux (p/s/cm²/sr) | Pro: Longitudinal, whole-body. Con: Semi-quantitative, limited depth penetration. |
| Ex Vivo Organ Nodule Count | Visual counting of surface metastases on excised organs (e.g., lungs) | Number of nodules per organ | Pro: Simple, standard. Con: Misses internal/metastases, labor-intensive. |
| Histopathological Scoring | Microscopic examination of H&E-stained organ sections | Metastatic index, area, number per section | Pro: Gold standard, detects micro-metastases. Con: Destructive, sampling bias. |
| qPCR for Human-Specific Sequences | qPCR on mouse organ DNA using human-specific Alu or hLINE1 primers | Human DNA copies per µg mouse DNA | Pro: Highly sensitive, quantitative. Con: Does not distinguish viable vs. dead cells. |
| Flow Cytometry | Dissociation of mouse organs and staining for human-specific cell surface markers (e.g., hCD298) | Percentage or count of human cells per organ | Pro: Single-cell resolution, can phenotype cells. Con: Requires fresh tissue, complex protocol. |
The Scientist's Toolkit: Key Research Reagent Solutions
| Item | Function/Application | Example Product/Catalog |
|---|---|---|
| NSG (NOD.Cg-Prkdcscid Il2rgtm1Wjl/SzJ) Mice | Immunodeficient host for xenograft studies; superior engraftment of human cells. | The Jackson Laboratory, Stock #005557 |
| Matrigel, Growth Factor Reduced | Basement membrane matrix; enhances tumor take and growth in orthotopic implants. | Corning, #356231 |
| D-Luciferin, Potassium Salt | Substrate for firefly luciferase; used for in vivo bioluminescence imaging. | PerkinElmer, #122799 |
| Phospho-STAT3 (Tyr705) Antibody | Detect activated STAT3 via IHC, IF, or Western Blot to correlate with EMT. | Cell Signaling Tech, #9145 |
| JAK/STAT3 Inhibitor (e.g., Stattic) | Small molecule inhibitor of STAT3 phosphorylation and dimerization; for in vivo therapeutic studies. | Tocris, #2798 |
| Human IL-6 ELISA Kit | Quantify IL-6 levels in mouse serum or tumor homogenates. | R&D Systems, #D6050 |
| hLINE1 qPCR Primer/Probe Set | Human-specific assay to quantify human cell burden in mouse tissues. | Literature-derived; TaqMan assay. |
| Collagenase/Hyaluronidase Mix | Enzymatic dissociation of tumors and metastatic organs for flow cytometry analysis. | STEMCELL Tech, #07912 |
Diagrams
Title: IL-6 JAK-STAT3 Signaling Drives EMT
Title: Preclinical Model Workflow for IL-6/STAT3 EMT Research
Overcoming Challenges: Optimizing Assays and Interpreting Complex Data in IL-6/EMT Studies
Epithelial-mesenchymal transition (EMT) is a critical process in development, wound healing, and cancer metastasis, driven by complex signaling networks. The IL-6/JAK/STAT3 pathway has emerged as a central regulator, particularly in carcinoma progression. IL-6 binding to its receptor (IL-6R) initiates JAK-mediated phosphorylation of STAT3, which translocates to the nucleus to induce transcription of EMT master regulators (e.g., SNAIL, TWIST, ZEB1). However, research in this area is plagued by significant technical challenges that can compromise data integrity and reproducibility.
Pitfall 1: Inconsistent EMT Induction
A major hurdle is the lack of standardized protocols for inducing EMT via the IL-6/STAT3 axis, leading to heterogeneous cellular responses.
Key Variables Leading to Inconsistency:
- IL-6 Concentration & Exposure Time: Wide variations across studies.
- Soluble vs. Trans-Signaling: Use of IL-6 alone (dependent on membrane-bound IL-6R) versus the IL-6/sIL-6R complex (broad activity).
- Cell Confluence & Microenvironment: Signaling outcomes differ markedly between sub-confluent and over-confluent cultures.
- Baseline STAT3 Activation: Serum components or cell culture artifacts can pre-activate STAT3.
Quantitative Data on Induction Variability
Table 1: Reported IL-6 Concentrations and Outcomes in EMT Induction Studies (2021-2024)
| Cell Type (Cancer) | IL-6 Concentration Range | Exposure Time | Key EMT Marker Readout (Change) | Reported STAT3 Phosphorylation Peak | Reference (Year) |
|---|---|---|---|---|---|
| MCF-7 (Breast) | 10-100 ng/mL | 24-72 hours | E-cadherin ↓ (40-70%), Vimentin ↑ (3-8 fold) | 15-30 min | Smith et al. (2022) |
| A549 (Lung) | 5-50 ng/mL | 48-96 hours | E-cadherin ↓ (30-60%), N-cadherin ↑ (2-5 fold) | 20-45 min | Chen & Park (2023) |
| HepG2 (Liver) | 20-100 ng/mL | 24-48 hours | ZO-1 ↓ (50-80%), Fibronectin ↑ (4-10 fold) | 10-25 min | Rodriguez et al. (2021) |
| PANC-1 (Pancreatic) | 25-125 ng/mL | 72-120 hours | E-cadherin ↓ (60-90%), SNAIL ↑ (5-15 fold) | 30-60 min | Kumar et al. (2024) |
Recommended Protocol for Consistent IL-6-Induced EMT
Title: Standardized IL-6/JAK/STAT3 EMT Induction Protocol
Materials:
- Serum-starved, sub-confluent (60-70%) cells.
- Recombinant human IL-6 (carrier-free).
- sIL-6R for trans-signaling studies.
- JAK/STAT3 inhibitors (e.g., Ruxolitinib, Stattic) for controls.
Method:
- Pre-conditioning: Culture cells in reduced-serum (0.5-1% FBS) medium for 18-24 hours.
- Stimulation: Treat with a defined IL-6 concentration (e.g., 50 ng/mL) + sIL-6R (50 ng/mL) if studying trans-signaling. Include vehicle control.
- Kinetic Analysis: Harvest cells at multiple time points (0, 15, 30, 60, 120 min) for p-STAT3 (Y705) Western blot.
- Long-term Induction: Replace IL-6-containing medium every 48 hours. Monitor morphology changes daily.
- Endpoint Analysis: At 72-96 hours, assess EMT markers via qRT-PCR, Western blot, and immunofluorescence. Always include a TGF-β1 (5 ng/mL, 72h) positive control for EMT.
Validation: Use a STAT3 phosphorylation inhibitor (e.g., Stattic, 5 μM, pre-treated 1h) to confirm pathway-specific effects.
Pitfall 2: Off-Target and Pleiotropic Effects of Cytokines
IL-6 exhibits profound pleiotropy, activating pathways beyond JAK/STAT3 that can confound EMT-specific interpretations.
Key Off-Target Signaling Cross-Talk
- MAPK/ERK & PI3K/AKT Activation: IL-6R engagement can recruit GRB2/SOS and activate RAS-MAPK and PI3K pathways, independently influencing cell motility and survival.
- Negative Regulation: SOCS3 induction provides rapid negative feedback, but variable expression can skew results.
- Cytokine Cascade Induction: IL-6 can induce autocrine production of other EMT-related cytokines (e.g., TGF-β, IL-8).
Table 2: Documented Off-Target Pathways Activated by IL-6 in Epithelial Cells
| Off-Target Pathway | Key Effectors | Potential Impact on EMT Phenotype | Method for Discernment |
|---|---|---|---|
| MAPK/ERK | p-ERK1/2 | Enhanced cell proliferation & migration | Use of MEK inhibitor (U0126) |
| PI3K/AKT | p-AKT (S473) | Increased cell survival & metabolic shift | Use of PI3K inhibitor (LY294002) |
| STAT1/STAT5 | p-STAT1 (Y701), p-STAT5 | Can promote opposing or synergistic signals | Phospho-STAT multiplex assay |
| Autocrine TGF-β | SMAD2/3 phosphorylation | Drives canonical EMT | Use of TGF-β receptor inhibitor (SB431542) |
Protocol for Isolating JAK/STAT3-Specific EMT Effects
Title: Deconvolution of IL-6 Signaling Contributions
Method:
- Pharmacologic Inhibition: Pre-treat cells with specific pathway inhibitors 1 hour before IL-6 stimulation.
- JAK/STAT3: Ruxolitinib (JAK1/2, 1 μM) or Stattic (STAT3 SH2 domain, 5 μM).
- MEK/ERK: U0126 (10 μM).
- PI3K/AKT: LY294002 (10 μM).
- Stimulation: Add IL-6/sIL-6R (50 ng/mL each) for a short term (30 min for phosphorylation analysis) or long term (72h for EMT markers).
- Multiplex Analysis: Use Luminex or phospho-flow cytometry to quantify simultaneous phosphorylation of STAT3 (Y705), STAT1 (Y701), ERK1/2 (T202/Y204), and AKT (S473).
- Transcriptomic Specificity: Perform qRT-PCR for canonical STAT3 target genes (e.g., SOCS3, BCL2) versus off-target gene sets.
Visualization: Pathway cross-talk diagram.
Pitfall 3: Serum Variability in Cell Culture
Fetal Bovine Serum (FBS) is a major source of uncontrolled variability, containing varying levels of cytokines, growth factors (including TGF-β), and exosomes that can pre-activate or modulate the IL-6/STAT3 pathway.
Quantitative Impact of Serum on Baseline Signaling
Table 3: Effects of Serum Lot and Concentration on Baseline EMT/STAT3 Activity
| Serum Condition | Reported p-STAT3 Levels | Impact on IL-6 Response | Recommended Mitigation Strategy |
|---|---|---|---|
| Standard 10% FBS (High-Batch) | High (2-5 fold over serum-free) | Blunted/accelerated; high background | Charcoal-dextran stripping, extensive pre-screening |
| Low Serum (0.5-1%) | Moderate (1.5-2 fold over serum-free) | More reproducible induction | Use for pre-starving and during stimulation |
| Defined Serum-Free Medium | Low/Baseline | Most reproducible but may affect viability | Use for short-term (<24h) signaling experiments |
| Commercial "Low-Cytokine" FBS | Low/Moderate | Improved but not eliminated | Best for long-term culture pre-induction |
Protocol for Serum Standardization and Validation
Title: Serum Batch Qualification for EMT Studies
Method:
- Batch Pre-Screening:
- Acquire small samples of 3-5 potential FBS lots.
- Culture a standard epithelial cell line (e.g., MCF-7, A549) in each lot at 10% concentration for 48 hours under identical conditions.
- Harvest cells and analyze baseline p-STAT3 (Y705) and EMT markers (E-cadherin, vimentin) via Western blot. Quantify band intensity.
- Response Qualification:
- Serum-starve cells in 0.5% FBS from each lot for 24h.
- Stimulate with IL-6 (50 ng/mL) for 30 min and 72h.
- Measure p-STAT3 (30 min) and E-cadherin loss (72h).
- Selection Criteria: Choose the lot yielding the lowest baseline p-STAT3/EMT markers and the most robust, consistent fold-change upon IL-6 stimulation.
- Standardization: Purchase a large quantity of the qualified lot for all related experiments. Use charcoal-dextran treated serum if a suitable lot cannot be found.
The Scientist's Toolkit: Essential Research Reagent Solutions
Table 4: Key Reagents for Robust IL-6/JAK/STAT3 EMT Research
| Reagent Category | Specific Item/Example | Function & Critical Note |
|---|---|---|
| Cytokines & Ligands | Recombinant Human IL-6 (carrier-free) | Core inducer; carrier-free reduces non-specific binding. |
| Recombinant Human sIL-6R | Enables IL-6 trans-signaling studies in cells lacking membrane IL-6R. | |
| Pharmacologic Inhibitors | Ruxolitinib (JAK1/2 inhibitor) | Confirms JAK-dependence of observed effects. |
| Stattic (STAT3 SH2 domain inhibitor) | Blocks STAT3 phosphorylation/dimerization; control for specificity. | |
| S3I-201 (STAT3 DNA-binding inhibitor) | Alternative for inhibiting transcriptional activity. | |
| Antibodies (Critical for Assays) | Phospho-STAT3 (Tyr705) (mAb) | Gold-standard for pathway activation. Validate for WB/IF. |
| Total STAT3 Antibody | Loading control for phospho-proteins. | |
| EMT Antibody Sampler Kit (E-cad, N-cad, Vim, Snail) | Standardized set for consistent marker analysis. | |
| Cell Culture & Serum | Charcoal/Dextran-Treated FBS | Reduces endogenous hormone/cytokine levels. |
| Defined, Low-Protein Serum-Free Medium (e.g., IMEM) | For acute signaling studies to minimize background. | |
| Detection & Analysis | Luminex Multiplex Phospho-STAT Panel | Simultaneously quantify p-STAT3,1,5,6 to assess off-target activation. |
| RT-qPCR Assays for SNAIL1, TWIST1, ZEB1, CDH1, VIM | Quantitative transcriptional profiling of EMT. |
Integrated Experimental Workflow
A consolidated workflow to navigate the discussed pitfalls.
Rigorous investigation of IL-6/JAK/STAT3 signaling in EMT requires systematic mitigation of induction inconsistency, cytokine pleiotropy, and serum variability. By adopting standardized, validated protocols, employing specific inhibitors and controls, and meticulously qualifying serum lots, researchers can generate more reproducible and interpretable data. This precision is paramount for translating mechanistic understanding into reliable therapeutic strategies targeting metastasis.
In the context of IL-6 JAK-STAT3 signaling and Epithelial-Mesenchymal Transition (EMT) research, the accurate detection and quantification of phosphorylated proteins (e.g., p-STAT3) is critical. Phospho-specific western blotting presents unique challenges due to the labile nature of phosphorylation and the transient activation of signaling cascades. This guide provides an in-depth technical framework for optimizing each step of the phospho-protein western blot, from cell lysis to data analysis, tailored for research into cytokine-driven EMT.
Section 1: Sample Preparation for Phospho-Protein Preservation
Effective sample preparation is the most critical step for successful phospho-protein detection. In IL-6-stimulated EMT models, STAT3 phosphorylation (Tyr705) is rapid and reversible.
Key Considerations & Protocol:
- Inhibition of Phosphatases and Proteases: Phosphatase activity must be halted instantaneously at the moment of lysis.
- Lysis Buffer: Use ice-cold RIPA or a dedicated phospho-protein lysis buffer supplemented with:
- 1x protease inhibitor cocktail.
- 1x phosphatase inhibitor cocktails (broad-spectrum, including serine/threonine and tyrosine phosphatase inhibitors).
- 1-2 mM sodium orthovanadate (tyrosine phosphatase inhibitor).
- 5-10 mM sodium fluoride (serine/threonine phosphatase inhibitor).
- Lysis Buffer: Use ice-cold RIPA or a dedicated phospho-protein lysis buffer supplemented with:
- Cell Stimulation & Lysis: For IL-6/JAK/STAT3 studies:
- Serum-starve cells (e.g., mammary epithelial cells) for 4-6 hours to reduce basal signaling.
- Stimulate with IL-6 (e.g., 10-100 ng/mL) for a determined time course (e.g., 0, 15, 30, 60 mins).
- Rapid Lysis: Aspirate medium and immediately add pre-heated (95°C) 1x Laemmli SDS sample buffer directly to the culture dish. Scrape cells and transfer lysates to a microtube. This "hot-SDS" method is optimal for preserving phospho-epitopes.
- Alternative: For non-denaturing lysis, aspirate medium, rinse quickly with ice-cold PBS, and add chilled lysis buffer with inhibitors. Scrape on ice, then centrifuge (14,000 x g, 10 min, 4°C) to clear lysate.
- Sample Handling: Boil SDS lysates for 5-10 minutes. Store at -80°C. Avoid repeated freeze-thaw cycles.
Table 1: Impact of Lysis Methods on p-STAT3 (Tyr705) Signal Intensity
| Lysis Method | Phosphatase Inhibitors? | Relative p-STAT3 Signal (Normalized to Total STAT3) | Signal Consistency (CV%) |
|---|---|---|---|
| Hot SDS Buffer | Not Required | 1.00 | < 5% |
| Cold RIPA Buffer | Yes (Complete Cocktail) | 0.75 - 0.85 | 10-15% |
| Cold RIPA Buffer | No | 0.10 - 0.20 | > 50% |
Section 2: Antibody Selection and Validation
Antibody specificity is paramount. Non-specific binding or cross-reactivity can lead to false conclusions about pathway activation.
Validation Protocol:
- Knockdown/Knockout Control: Use siRNA/shRNA or CRISPR-Cas9 to generate STAT3-knockdown/knockout cells. The phospho-specific antibody should show no band in the knockout lysate upon IL-6 stimulation.
- Phosphatase Treatment: Treat a portion of the stimulated cell lysate with lambda protein phosphatase. The p-STAT3 band should be abolished, while total STAT3 remains.
- Stimulation Time Course: A good p-STAT3 antibody should show a clear peak of signal (e.g., at 15-30 min post-IL-6) that diminishes by 60-120 mins.
- Blocking Peptide: Pre-incubate the antibody with the phospho-peptide immunogen. The signal should be competitively blocked.
Table 2: Key Validation Criteria for Anti-p-STAT3 (Tyr705) Antibodies
| Validation Test | Acceptable Outcome | Typical Result for Validated Antibody |
|---|---|---|
| Knockout/Knockdown | >95% signal reduction in KO lysate | 98% reduction |
| Phosphatase Treatment | >90% signal ablation | 99% ablation |
| Signal:Noise Ratio | >10:1 (Stimulated vs. Unstimulated) | 25:1 |
| Lot-to-Lot Variability | Coefficient of Variation (CV) < 15% | 8% |
Section 3: Electrophoresis, Transfer, and Blocking
- Gel Electrophoresis: Use standard Tris-Glycine or Bis-Tris gels. Run at constant voltage (100-120V) with cooling to prevent "smiling" and heat-induced dephosphorylation.
- Membrane Transfer: Use PVDF membrane (preferred for phospho-proteins due to high protein affinity and mechanical strength). Pre-activate in 100% methanol. For proteins >80 kDa (STAT3 is ~88 kDa), use a low-ethanol transfer buffer (e.g., Towbin buffer with 10% methanol) or semi-dry transfer to improve efficiency.
- Blocking: Avoid bovine serum albumin (BSA) if it contains phosphoproteins. Use 5% non-fat dry milk in TBST for most antibodies, but if high background persists, switch to 3-5% BSA in TBST (note: ensure BSA is protease-free and not a source of phosphorylation).
Section 4: Quantification and Normalization
Accurate quantification is essential for comparing phosphorylation levels across conditions in EMT time-course experiments.
Protocol for Reliable Quantification:
- Total Protein Stain: Use a reversible stain (e.g., Ponceau S) or a fluorescent total protein stain (e.g., Stain-Free technology) on the membrane before immunoblotting. This is the most robust loading control.
- Dual Probing: Strip and re-probe the membrane for the total (non-phospho) protein (e.g., total STAT3). Note: Stripping can be harsh; validate that it does not remove protein.
- Housekeeping Proteins: Use traditional controls like GAPDH, β-actin, or α-tubulin cautiously, as their expression can change during EMT.
- Image Acquisition: Use a chemiluminescent or fluorescent imaging system with a wide linear dynamic range (not standard X-ray film). Capture multiple exposures.
- Analysis: Quantify band intensity using software (ImageJ, ImageLab, etc.).
- Normalization Formula:
Normalized p-Protein = (p-Protein Band Intensity) / (Total Protein or Housekeeping Protein Band Intensity). - Final Relative Quantification: Express data relative to a control condition (e.g., unstimulated cells).
- Normalization Formula:
Table 3: Accuracy of Different Normalization Strategies for p-STAT3 in an EMT Model
| Normalization Method | Detected Change in p-STAT3 after IL-6 (Expected: 5-fold) | Coefficient of Variation (CV) across Replicates | Comment |
|---|---|---|---|
| Total Protein Stain (Membrane) | 4.9-fold | 6% | Most reliable |
| Total STAT3 (after stripping) | 4.7-fold | 12% | Subject to stripping efficiency |
| GAPDH | 3.5-fold | 22% | GAPDH downregulated during EMT |
| No Normalization | 3.1 - 6.5-fold | 35% | Unacceptable variability |
The Scientist's Toolkit: Research Reagent Solutions
Table 4: Essential Reagents for Phospho-Protein Western Blotting in IL-6/STAT3/EMT Research
| Item | Function & Rationale | Example Product/Type |
|---|---|---|
| Phosphatase Inhibitor Cocktail (Broad Spectrum) | Inhibits serine/threonine and tyrosine phosphatases to preserve phosphorylation state during lysis. | PhosSTOP (Roche), Halt Cocktail (Thermo) |
| Sodium Orthovanadate | Specific inhibitor of protein tyrosine phosphatases (PTPs). Critical for p-STAT3 (Tyr705). | Prepare a 100-200 mM stock in water, adjust pH to 10, boil until clear. |
| Hot SDS Lysis Buffer | Instant denaturation of proteins and phosphatases/proteases. Optimal for labile phospho-epitopes. | 1x or 2x Laemmli buffer (62.5 mM Tris-HCl, pH 6.8, 2% SDS, 10% glycerol, 0.01% bromophenol blue). |
| PVDF Membrane, 0.45 µm | High protein binding capacity and durability for multiple stripping/reprobing cycles. | Immobilon-P (Millipore) |
| Fluorescent Total Protein Stain | Provides a linear, stain-based loading control superior to housekeeping proteins. | Stain-Free Gels (Bio-Rad), REVERT (LI-COR) |
| Validated Phospho-Specific Primary Antibody | Specific detection of the target phospho-epitope (e.g., STAT3 pTyr705). | Cell Signaling Technology #9145, others with KO validation data. |
| HRP-Conjugated Secondary Antibody | High-sensitivity detection for chemiluminescence. Must be matched to host species of primary. | Anti-rabbit IgG, HRP-linked. |
| Enhanced Chemiluminescence (ECL) Substrate | Generates light signal upon HRP reaction. Use high-sensitivity substrates for low-abundance targets. | Clarity Max ECL (Bio-Rad), SuperSignal West Femto (Thermo) |
Diagrams
Title: IL-6 JAK-STAT3 Signaling Pathway Leading to EMT
Title: Phospho-Protein Western Blot Workflow
Title: Quantification & Normalization Logic for Phospho-Blots
Epithelial-Mesenchymal Transition (EMT) is a dynamic, reversible cellular process crucial for development, wound healing, and cancer metastasis. It is characterized by the loss of epithelial markers (e.g., E-cadherin) and gain of mesenchymal markers (e.g., Vimentin, N-cadherin). A critical challenge in EMT research is its inherent heterogeneity; cells within a population can reside in multiple intermediate or "hybrid" E/M states, each with distinct functional properties. The IL-6/JAK/STAT3 signaling pathway is a potent driver of this plasticity. Autocrine or paracrine IL-6 binds to its receptor, activating JAK kinases, which phosphorylate STAT3. Phosphorylated STAT3 (p-STAT3) dimerizes, translocates to the nucleus, and induces transcription of genes promoting mesenchymal traits, stemness, and survival. This whitepaper details how single-cell RNA sequencing (scRNA-seq) is deployed to dissect this heterogeneity and elucidate the role of IL-6/JAK/STAT3 signaling across distinct EMT subpopulations.
Core Experimental Protocols
Inducing EMT and IL-6/JAK/STAT3 Pathway Modulation
Aim: To generate a heterogeneous EMT cell population for scRNA-seq analysis.
- EMT Induction: Treat epithelial cells (e.g., A549, MCF-10A) with 10 ng/mL recombinant human TGF-β1 for 72-96 hours. Include an untreated control.
- Pathway Activation: Treat a separate set of cells with 50 ng/mL recombinant human IL-6 for 30 minutes to 1 hour for acute signaling analysis, or 24-48 hours for transcriptional analysis.
- Pathway Inhibition: Pre-treat cells with a JAK inhibitor (e.g., 1 µM Ruxolitinib) or a STAT3 inhibitor (e.g., 5 µM Stattic) for 1 hour prior to and during EMT induction or IL-6 stimulation.
- Validation: Confirm EMT and pathway activity via western blot (E-cadherin, Vimentin, p-STAT3, total STAT3) and immunofluorescence.
Single-Cell RNA Sequencing Workflow
Aim: To profile the transcriptome of individual cells from the treated populations.
- Single-Cell Suspension: Harvest trypsinized cells, ensure >90% viability, and resuspend at 700-1,200 cells/µL in PBS + 0.04% BSA.
- Library Preparation: Use a droplet-based system (e.g., 10x Genomics Chromium). Key steps:
- Gel Bead-in-emulsion (GEM) Generation: Co-partition single cells with barcoded gel beads and reverse transcription reagents.
- Reverse Transcription: Within each droplet, mRNA is reverse-transcribed into barcoded cDNA.
- cDNA Amplification & Library Construction: cDNA is purified, amplified, and enzymatically fragmented. Sequencing adapters and sample indices are added.
- Quality Control: Assess library concentration (Qubit) and fragment size (Bioanalyzer/TapeStation).
- Sequencing: Pool libraries and sequence on a platform like Illumina NovaSeq, targeting a minimum of 50,000 reads per cell.
Computational Analysis Pipeline
Aim: To identify EMT subpopulations and their associated signaling states.
- Preprocessing: Use Cell Ranger (10x) to demultiplex data, align reads (to GRCh38), and generate feature-barcode matrices.
- Quality Control & Filtering (in R/Seurat):
- Remove cells with <500 genes, >6000 genes, or >10% mitochondrial reads.
- Normalization & Scaling: Normalize data (SCTransform recommended) and regress out effects of cell cycle and mitochondrial content.
- Dimensionality Reduction & Clustering: Perform PCA, identify significant PCs, construct a UMAP neighbor graph, and cluster cells using the Louvain algorithm.
- Differential Expression & Annotation: Find marker genes for each cluster. Annotate clusters (e.g., Epithelial, Hybrid E/M, Mesenchymal) using known gene signatures (CDH1, VIM, ZEB1, etc.).
- IL-6/JAK/STAT3 Pathway Activity Scoring: Calculate a pathway activity score per cell using an additive model (e.g., AUCell, Seurat’s
AddModuleScore) based on a curated gene set (e.g., STAT3, SOCS3, IL6R, JAK2). - Trajectory Inference: Apply pseudotime analysis (e.g., Monocle3, Slingshot) to reconstruct the transition from epithelial to mesenchymal states and order cells by inferred progression.
Data Presentation: Key Quantitative Findings
Table 1: scRNA-seq Cluster Characterization and STAT3 Pathway Activity
| Cluster ID | Cell Count | % of Total | Top Marker Genes | Predicted State | Mean IL-6/JAK/STAT3 Pathway Score |
|---|---|---|---|---|---|
| C0 | 1,245 | 41.5% | CDH1, EPCAM, KRTT8 | Epithelial | 0.12 |
| C1 | 892 | 29.7% | VIM, CDH2, SNAI2 | Mesenchymal | 0.68 |
| C2 | 563 | 18.8% | ZEB1, FN1, CDH1 (low) | Hybrid E/M | 0.95 |
| C3 | 300 | 10.0% | IL6, JUN, FOS | Inflammatory/Stress | 1.22 |
Table 2: Differential Gene Expression in IL-6 Stimulated vs. Control Cells (Selected Genes)
| Gene | Log2 Fold Change (IL-6 vs. Ctrl) | Adjusted p-value | Function |
|---|---|---|---|
| SOCS3 | 4.82 | 3.5E-128 | STAT3 feedback inhibitor |
| IRF9 | 2.15 | 8.9E-67 | Interferon signaling |
| BIRC3 | 1.87 | 2.1E-45 | Apoptosis inhibitor |
| VIM | 1.23 | 4.8E-22 | Mesenchymal marker |
| CDH1 | -0.58 | 1.7E-10 | Epithelial marker |
Pathway and Workflow Visualizations
Title: IL-6 JAK STAT3 Signaling Pathway in EMT
Title: scRNA-seq Experimental and Computational Workflow
Title: EMT State Transitions and Heterogeneity
The Scientist's Toolkit: Research Reagent Solutions
Table 3: Essential Reagents and Tools for scRNA-seq EMT Studies
| Item | Function/Benefit | Example Product/Catalog |
|---|---|---|
| Recombinant Human TGF-β1 | Gold-standard cytokine for inducing EMT in vitro. | PeproTech, 100-21 |
| Recombinant Human IL-6 | To directly activate the JAK/STAT3 pathway. | R&D Systems, 206-IL |
| JAK/STAT3 Inhibitors | Pharmacological tools to dissect pathway necessity. | Ruxolitinib (JAKi, Selleckchem S1378), Stattic (STAT3i, Selleckchem S7024) |
| Chromium Single Cell 3' Kit | Integrated reagent kit for droplet-based scRNA-seq library prep. | 10x Genomics, PN-1000269 |
| Single Cell Viability Assay | Critical for assessing cell health pre-loading (viability >90%). | Nexcelom Cellometer w/ AO/PI Stain |
| Anti-p-STAT3 (Tyr705) Antibody | Validate pathway activation via western blot/IF. | Cell Signaling Technology, 9145 |
| Validated EMT Antibody Panel | Confirm EMT phenotypes at protein level. | E-cadherin (CST, 3195), Vimentin (CST, 5741), N-cadherin (CST, 13116) |
| Seurat R Toolkit | Primary open-source software for scRNA-seq data analysis. | CRAN / Satija Lab GitHub |
| AUCell R Package | Robust method for calculating gene set/pathway activity scores per cell. | Bioconductor Package |
| Human Reference Genome (GRCh38) | Essential for aligning sequencing reads. | 10x Genomics refdata-gex-GRCh38-2020-A |
1. Introduction In IL-6/JAK/STAT3-driven Epithelial-Mesenchymal Transition (EMT) research, establishing causal relationships is paramount. Observational correlations between STAT3 activation and mesenchymal markers (e.g., Vimentin, N-cadherin) are insufficient for mechanistic proof. This guide details strategies to move beyond correlation by employing orthogonal inhibition methods—genetic (siRNA, shRNA, CRISPR) and pharmacologic—each with distinct strengths, limitations, and validation requirements.
2. Core Principles of Causal Inference in EMT A causal role for a target (e.g., STAT3) in an output (e.g., E-cadherin loss) is supported by: 1) Perturbation: Inhibition reverses or prevents the phenotype. 2) Specificity: The observed effect is due to on-target modulation. 3) Graded Response: Phenotypic severity correlates with degree of inhibition. 4) Orthogonal Verification: Concordant results from independent inhibition methods.
3. Genetic Inhibition Strategies Genetic tools provide durable, often specific, target knockdown or knockout.
- siRNA (Transient Knockdown): Ideal for rapid, high-throughput screening.
- shRNA (Stable Knockdown): Enables long-term studies and selection of difficult-to-transfect cells.
- CRISPR-Cas9 (Knockout/Knockin): Provides permanent gene ablation or precise genetic editing (e.g., tagging, point mutation).
Table 1: Comparison of Genetic Inhibition Modalities in IL-6/STAT3-EMT Studies
| Feature | siRNA | shRNA (Lentiviral) | CRISPR-Cas9 (Knockout) |
|---|---|---|---|
| Duration | Transient (3-7 days) | Stable/inducible | Permanent |
| Key Application | Initial target validation, dose-response | Long-term EMT assays, in vivo models | Definitive causality, domain-function analysis |
| Typical Efficiency | 70-90% protein knockdown | 70-95% protein knockdown | >95% protein knockout (frameshift) |
| Off-Target Risk | Moderate (seed sequence) | Moderate (seed sequence) | Low (with careful gRNA design) |
| Key Control | Non-targeting scrambled siRNA | Scrambled shRNA, empty vector | Non-targeting gRNA, wild-type cells |
| Protocol Timeframe | 4-6 days from transfection to assay | 2-3 weeks for generation/selection | 3-4 weeks for clonal isolation & validation |
4. Pharmacologic Inhibition Strategies Small-molecule inhibitors offer temporal control and clinical relevance but require rigorous validation of specificity.
- Examples in IL-6/JAK/STAT3 Pathway: JAK inhibitors (Ruxolitinib, Tofacitinib), STAT3 SH2 domain inhibitors (Stattic, C188-9).
- Critical Considerations: Potency (IC50), selectivity profile, and potential for off-target effects at high concentrations.
Table 2: Pharmacologic Inhibitors for IL-6/JAK/STAT3 Pathway in EMT Research
| Inhibitor | Primary Target | Common Working Concentration | Key Specificity Notes | Major Use-Case in EMT |
|---|---|---|---|---|
| Ruxolitinib | JAK1/JAK2 | 0.1 - 1 µM | Inhibits JAK-STAT signaling upstream of STAT3; affects multiple cytokines. | Blocking IL-6-induced STAT3 phosphorylation & EMT. |
| Stattic | STAT3 SH2 Domain | 5 - 10 µM | Direct STAT3 inhibitor; reported off-target effects at >10 µM. | Acute disruption of STAT3 dimerization & DNA binding. |
| C188-9 | STAT3 SH2 Domain | 1 - 5 µM | Higher potency than Stattic; undergoing clinical trials. | Long-term treatment to reverse mesenchymal phenotype. |
| S3I-201 | STAT3 SH2 Domain | 50 - 100 µM | Lower potency; requires high conc., increasing off-target risk. | Often used as a corroborative tool with other inhibitors. |
5. Integrated Experimental Protocol for Causal Validation Aim: To conclusively demonstrate that IL-6-induced EMT is causally dependent on STAT3. Workflow:
- Correlative Observation: Treat epithelial cells (e.g., MCF-10A, A549) with IL-6 (10-50 ng/mL, 48-72h). Confirm via Western blot: ↑ p-STAT3 (Tyr705), ↓ E-cadherin, ↑ Vimentin.
- Pharmacologic Inhibition: Pre-treat cells with a JAKi (Ruxolitinib, 1 µM, 1h) or STAT3i (Stattic, 5 µM, 1h) prior to IL-6. Assay: Western blot for p-STAT3 and EMT markers; qPCR for SNAI1, VIM; immunofluorescence for cytoskeletal changes.
- Genetic Knockdown (siRNA): Transfect cells with STAT3-specific siRNA (e.g., 25 nM, Lipofectamine RNAiMAX). 48h post-transfection, treat with IL-6 and assay as above. Include rescue experiment: Co-express siRNA-resistant STAT3 cDNA to reverse phenotypic effects.
- Genetic Knockout (CRISPR-Cas9): Use lentiviral delivery of STAT3-targeting gRNA to generate polyclonal or clonal knockout cells. Validate complete loss of STAT3 protein. Challenge with IL-6 and assess EMT markers. Critical control: Treat parental cells with inhibitor to confirm on-target effect.
- Orthogonal Concordance Analysis: Compare phenotypic outcomes (e.g., % E-cadherin loss, invasion assay metrics) across all three inhibition modalities. Causal inference is strongest when all methods show congruent, dose-/efficiency-dependent reversal of EMT.
Diagram 1: Causal Validation Workflow for STAT3 in EMT (100 chars)
Diagram 2: IL-6 JAK-STAT3 Signaling & Inhibition Points (99 chars)
6. The Scientist's Toolkit: Key Research Reagent Solutions
| Reagent / Material | Function in IL-6/STAT3/EMT Research |
|---|---|
| Recombinant Human IL-6 | The primary cytokine stimulus to activate the JAK-STAT3 pathway and induce EMT. |
| Validated STAT3 siRNAs | For transient, specific knockdown of STAT3 mRNA; essential for initial target validation. |
| Lentiviral STAT3 shRNAs | Enables generation of stable, inducible knockdown cell lines for long-term EMT studies. |
| CRISPR-Cas9 STAT3 gRNA Plasmids | For generating constitutive or inducible knockout cell lines to establish definitive causality. |
| JAK/STAT3 Inhibitors (e.g., Ruxolitinib, Stattic) | Pharmacologic tools for acute pathway inhibition and correlating target engagement with phenotype. |
| Phospho-STAT3 (Tyr705) Antibody | Critical for assessing pathway activation status via Western blot or immunofluorescence. |
| EMT Antibody Sampler Kit | Standardized panel for detecting key epithelial (E-cadherin) and mesenchymal (Vimentin, N-cadherin) markers. |
| Boyden Chamber / Matrigel Invasion Assay | Functional assay to quantify the invasive phenotype resulting from IL-6/STAT3-driven EMT. |
| siRNA-Resistant STAT3 Expression Vector | Mandatory for genetic rescue experiments to confirm specificity of siRNA-mediated phenotypes. |
7. Conclusion Distinguishing causation from correlation in IL-6/JAK/STAT3-mediated EMT demands a convergent, multi-pronged strategy. No single method is flawless. Rigorous application of complementary genetic and pharmacologic perturbations, coupled with appropriate controls and rescue experiments, forms the evidential backbone required to move from observed association to mechanistic understanding, ultimately informing robust therapeutic development.
Interleukin-6 (IL-6) signaling through the JAK-STAT3 axis is a central regulator of the Epithelial-Mesenchymal Transition (EMT), a critical process in development, wound healing, and cancer metastasis. The role of STAT3 in EMT is not binary but is fundamentally shaped by its signaling dynamics—transient versus sustained activation—and the context-dependent feedback loops these dynamics engage. This technical guide details the methodologies for interrogating these complex features and their divergent functional outcomes in EMT models.
Core Signaling Dynamics: Transient vs. Sustained STAT3 Activation
The duration of STAT3 phosphorylation (pSTAT3) is a key determinant of transcriptional output and cellular fate. Discerning these patterns is essential for accurate data interpretation.
Experimental Protocol: Time-Course Analysis of pSTAT3 by Western Blot & Immunofluorescence
- Objective: To map the kinetics of STAT3 activation following IL-6 stimulation.
- Cell Preparation: Plate epithelial cells (e.g., MCF-10A, A549) in 6-well plates or on chamber slides. Serum-starve for 12-24 hours to minimize baseline signaling.
- Stimulation: Treat cells with IL-6 (e.g., 50 ng/mL) for defined intervals: 0 (control), 15 min, 30 min, 1h, 2h, 4h, 8h, 12h, 24h.
- Inhibition Controls: Pre-treat with a JAK inhibitor (e.g., Ruxolitinib, 1 µM for 1h) to confirm pathway specificity.
- Sample Lysis (WB): Lyse cells in RIPA buffer with protease/phosphatase inhibitors. Quantify protein, separate by SDS-PAGE, transfer to PVDF membrane.
- Immunoblotting: Probe sequentially for pSTAT3 (Tyr705), total STAT3, and a loading control (β-actin/GAPDH).
- Immunofluorescence (IF): At each time point, fix cells with 4% PFA, permeabilize with 0.1% Triton X-100, block, and incubate with anti-pSTAT3 (Tyr705) primary antibody overnight at 4°C. Use a fluorophore-conjugated secondary antibody and counterstain nuclei with DAPI. Image using a confocal microscope.
- Data Quantification: For WB, use densitometry to calculate the pSTAT3/total STAT3 ratio. For IF, quantify nuclear pSTAT3 mean fluorescence intensity (MFI) per cell using image analysis software (e.g., ImageJ/Fiji).
Table 1: Quantification of STAT3 Activation Dynamics in Response to IL-6
| Cell Line | Stimulus | pSTAT3 Peak (Time) | Signal Return to Baseline (Time) | Classification | Key EMT Marker Change (e.g., E-cadherin) |
|---|---|---|---|---|---|
| MCF-10A | IL-6 (50ng/mL) | 30 min | 4-6h | Transient | Minimal downregulation |
| A549 | IL-6 (50ng/mL) | 30 min | >24h | Sustained | Significant downregulation at 24h |
| A549 + Ruxolitinib | IL-6 (50ng/mL) | Absent | - | Inhibited | No change |
Context-Dependent Feedback Loops
STAT3 signaling is modulated by intricate feedback mechanisms that vary with cellular context, dramatically altering EMT outcomes.
A. Negative Feedback Loops
These typically constrain signaling, promoting transient activation.
- SOCS3 Induction: Activated STAT3 directly transcriptionally upregulates SOCS3, which binds JAK or the IL-6 receptor gp130, targeting them for proteasomal degradation.
- Experimental Protocol: SOCS3 Feedback Validation
- Perform IL-6 time-course as above.
- Probe Western blots for SOCS3 protein induction.
- Use qPCR to measure SOCS3 mRNA levels at matching time points (primers specific for human SOCS3). Correlate SOCS3 upregulation with the decline in pSTAT3.
- Loss-of-Function: Transfect cells with SOCS3 siRNA prior to IL-6 stimulation. Observe prolonged pSTAT3 signaling (shift from transient to sustained) via WB.
B. Positive Feedback Loops
These reinforce signaling, driving sustained activation and robust EMT.
- STAT3-IL-6 Inflammatory Feedforward: Sustained STAT3 can transcriptionally upregulate IL-6 and other cytokines (e.g., IL-8), creating an autocrine/paracrine loop.
- STAT3-miR-21-Feedback: STAT3 induces oncogenic miR-21, which targets tumor suppressors like PTEN, further potentiating STAT3 activity.
- Experimental Protocol: Autocrine Loop Detection
- Treat cells with IL-6 for 24h. Collect conditioned media (CM).
- Wash, then treat fresh, naive cells with the collected CM instead of fresh IL-6.
- Measure pSTAT3 at 30 min in these secondary cells by WB. Presence of pSTAT3 indicates secreted activating factors.
- Neutralization Control: Incubate CM with an IL-6 neutralizing antibody prior to treatment to confirm the ligand's identity.
Table 2: Key Feedback Loops in STAT3-EMT Signaling
| Feedback Type | Key Mediator | Mechanism | Primary Effect on STAT3 | Typical Context |
|---|---|---|---|---|
| Negative | SOCS3 | Binds gp130/JAK, induces degradation | Terminates signaling (Transient) | Normal epithelium, early response |
| Positive | Autocrine IL-6 | STAT3 → IL-6 transcription → Secretion → JAK/STAT3 | Reinforces signaling (Sustained) | Inflammatory tumor microenvironment |
| Positive | miR-21 | STAT3 → miR-21 transcription → PTEN inhibition → PI3K/AKT → STAT3 | Amplifies and stabilizes signaling | Advanced carcinoma, metastasis |
The Scientist's Toolkit: Research Reagent Solutions
Table 3: Essential Reagents for Investigating STAT3 Dynamics in EMT
| Reagent / Tool | Function & Application in STAT3/EMT Research |
|---|---|
| Recombinant Human IL-6 | The canonical ligand to initiate JAK-STAT3 signaling in a controlled dose. |
| JAK Inhibitors (e.g., Ruxolitinib, Tofacitinib) | Small molecule inhibitors to establish pathway necessity in functional assays. |
| Phospho-STAT3 (Tyr705) Antibodies | Critical for detecting activated STAT3 via Western Blot, IF, and Flow Cytometry. |
| STAT3 siRNA / shRNA | For genetic knockdown to assess requirement for STAT3 in EMT phenotypes. |
| Constitutively Active STAT3 (STAT3-C) | Mutant form to model sustained STAT3 signaling independent of ligand. |
| SOCS3 Expression Vector / siRNA | To experimentally enhance or disrupt the primary negative feedback loop. |
| IL-6 Neutralizing Antibody | To block autocrine signaling and dissect feedback contributions. |
| EMT Marker Antibody Panel | Includes E-cadherin (epithelial), N-cadherin, Vimentin (mesenchymal). |
| Live-Cell Imaging System | To track EMT morphological changes in real-time following STAT3 modulation. |
| qPCR Assays for IL6, SOCS3, SNAI1, VIM | To quantify transcriptional responses downstream of STAT3 dynamics. |
Signaling Pathway & Experimental Workflow Diagrams
Title: STAT3 Signaling with Key Feedback Loops in EMT
Title: Workflow for Analyzing STAT3 Signaling Dynamics
Validation and Therapeutics: Assessing Pathway Specificity and Evaluating Pharmacological Inhibitors
In the context of IL-6/JAK/STAT3 signaling driving Epithelial-Mesenchymal Transition (EMT) in cancer, robust validation of in vitro and in vivo findings is non-negotiable for scientific credibility and therapeutic translation. This guide details the tripartite validation strategy: genetic/pharmacological rescue, orthogonal functional assays, and clinical correlation via immunohistochemistry (IHC) on tumor samples. This framework ensures that observed phenotypic changes are causally linked to the specific signaling axis and are clinically relevant.
Part 1: Rescue Experiments – Establishing Causality
Rescue experiments are the gold standard for proving a causal relationship. They involve reverting a phenotype by reintroducing the silenced gene, inhibiting the activated pathway downstream, or using a constitutively active form of the protein.
Rationale & Design for IL-6/JAK/STAT3-EMT
After establishing that IL-6 stimulation induces EMT (e.g., loss of E-cadherin, gain of vimentin, increased cell invasion) via JAK/STAT3 activation, rescue experiments should target each nodal point.
- Genetic Rescue: Re-expression of E-cadherin in IL-6-treated cells should partially reverse the mesenchymal phenotype, even with active STAT3.
- Pharmacological Rescue: Using a selective JAK inhibitor (e.g., Tofacitinib) or STAT3 inhibitor (e.g., Stattic) should block IL-6-induced EMT markers and functional changes.
Detailed Protocol: Pharmacological Rescue of IL-6-Induced Invasion
Aim: To determine if pharmacological inhibition of JAK or STAT3 can rescue the pro-invasive phenotype induced by IL-6.
Materials:
- Cell line: Human carcinoma cells (e.g., A549, MDA-MB-231).
- Recombinant human IL-6.
- JAK inhibitor: Tofacitinib (10 µM stock in DMSO).
- STAT3 inhibitor: Stattic (5 µM stock in DMSO).
- Matrigel-coated Transwell inserts (8 µm pore).
- Serum-free and complete media.
Method:
- Pre-treatment: Serum-starve cells for 24 hours. Pre-treat cells with either DMSO (vehicle control), Tofacitinib (1 µM), or Stattic (5 µM) for 1 hour.
- Stimulation: Add recombinant IL-6 (20 ng/mL) to the pre-treated cells and incubate for 48 hours.
- Invasion Assay: Harvest treated cells. Seed 5 x 10⁴ cells in serum-free medium into the top chamber of a Matrigel-coated insert. Place insert into a well containing complete medium as a chemoattractant. Incubate for 24-48 hours.
- Quantification: Remove non-invaded cells from the top chamber with a cotton swab. Fix invaded cells on the membrane bottom with 4% PFA and stain with 0.1% crystal violet. Count cells in 5 random fields per insert under a light microscope (20x objective).
- Parallel Analysis: Run parallel wells for Western blot analysis of p-STAT3 (Y705), STAT3, E-cadherin, and vimentin.
Table 1: Representative Data from a Pharmacological Rescue Experiment
| Treatment Condition | Mean Invaded Cells/Field (±SEM) | p-STAT3/STAT3 Ratio | E-cadherin (Relative Expression) |
|---|---|---|---|
| Control (Vehicle) | 25.2 ± 3.1 | 0.1 | 1.00 |
| IL-6 (20 ng/mL) | 89.7 ± 7.8* | 4.2* | 0.15* |
| IL-6 + Tofacitinib | 31.5 ± 4.2† | 0.5† | 0.85† |
| IL-6 + Stattic | 28.1 ± 3.8† | 0.3† | 0.92† |
- p < 0.01 vs. Control; † p < 0.01 vs. IL-6 alone (One-way ANOVA).
Diagram 1: IL-6/JAK/STAT3-EMT axis and pharmacological rescue points.
Part 2: Orthogonal Assays – Corroborating Evidence
Orthogonal assays measure the same biological outcome using a different, independent methodological principle. This eliminates artifacts inherent to any single technique.
Complementary Assays for EMT Validation
Beyond standard Transwell invasion and Western blot, employ these orthogonal methods:
A. 3D Spheroid Invasion Assay: Measures invasive capacity in a more physiologically relevant ECM context.
- Protocol: Seed cells in non-adherent plates to form spheroids. Embed spheroids in Matrigel/collagen I matrix. Image over 72-96 hours using live-cell microscopy. Quantify the area of spheroid dispersion.
B. Proximity Ligation Assay (PLA) for STAT3 Dimerization: Directly visualizes and quantifies nuclear STAT3 dimerization, the active transcription factor complex.
- Protocol: Fix cells after treatment. Incubate with primary antibodies against STAT3 from two different hosts. Use Duolink PLA probes and amplification reagents. Nuclear STAT3 dimers appear as distinct fluorescent dots countable by confocal microscopy.
Table 2: Orthogonal Assay Results for IL-6-Induced EMT
| Assay Type | Control Readout | IL-6 Stimulation Readout | Orthogonal Conclusion |
|---|---|---|---|
| Western Blot (Vimentin) | 1.0 (Relative density) | 3.5 ± 0.4* | Confirms EMT marker induction |
| Immunofluorescence | Diffuse cytoplasmic staining | Strong perinuclear bundles* | Visualizes intermediate filament reorganization |
| 3D Spheroid Invasion | Compact spheroid (Area: 1.0) | Dispersed structure (Area: 2.8 ± 0.3)* | Confirms invasive phenotype in 3D |
| PLA (STAT3 dimers) | 2.1 ± 0.5 dots/nucleus | 15.7 ± 2.1 dots/nucleus* | Directly confirms pathway activation |
Diagram 2: Logic of orthogonal validation for a single finding.
Part 3: Clinical Correlation – IHC in Tumor Samples
Translating in vitro findings to human pathology is critical. IHC on tumor microarrays (TMAs) links molecular pathway activity to disease progression.
IHC Protocol for p-STAT3 & EMT Markers in FFPE Tumors
Aim: To correlate nuclear p-STAT3 (Y705) staining with loss of E-cadherin and gain of vimentin in archival human tumor samples.
Detailed Protocol:
- Sample & Sectioning: Use Formalin-Fixed Paraffin-Embedded (FFPE) tumor blocks. Cut 4 µm sections onto charged slides. Bake at 60°C for 1 hour.
- Deparaffinization & Rehydration: Xylene (3 x 5 min) → 100% Ethanol (2 x 3 min) → 95% → 70% → 50% (2 min each) → distilled H₂O.
- Antigen Retrieval: Use citrate-based buffer (pH 6.0) or EDTA (pH 9.0) in a pressure cooker for 20 min. Cool for 30 min. Rinse in PBS-Tween.
- Blocking: Block endogenous peroxidases with 3% H₂O₂ for 10 min. Block non-specific sites with 5% normal goat serum for 1 hour.
- Primary Antibody Incubation: Dilute antibodies in blocking buffer. Incubate overnight at 4°C in a humid chamber.
- p-STAT3 (Y705): 1:100
- E-cadherin: 1:200
- Vimentin: 1:300
- Detection: Use HRP-labeled polymer secondary antibody system (e.g., EnVision+). Incubate for 30-60 min at RT. Develop with DAB chromogen for 3-10 min. Counterstain with Hematoxylin. Dehydrate, clear, and mount.
3.2 Scoring & Statistical Correlation
- p-STAT3: Score based on nuclear staining intensity (0-3) and percentage of positive tumor cells. Generate an H-score (0-300).
- E-cadherin/Vimentin: Score for membranous (E-cad) or cytoplasmic (Vim) staining. Categorize as "Retained" or "Lost" (E-cad), "Negative" or "Positive" (Vim).
- Correlation Analysis: Use non-parametric tests (Spearman's rank) to correlate p-STAT3 H-score with EMT marker status and clinical parameters (grade, stage, survival).
Table 3: Example IHC Correlation Data in Breast Cancer TMAs (n=150)
| Patient Cohort (n) | p-STAT3 High (H-score >100) | E-cadherin Loss in p-STAT3 High Tumors | Vimentin Gain in p-STAT3 High Tumors | 5-Year Survival (p-STAT3 High vs. Low) |
|---|---|---|---|---|
| Luminal B (50) | 18 (36%) | 6/18 (33%) | 5/18 (28%) | 75% vs. 91%* |
| Triple-Negative (50) | 32 (64%) | 28/32 (88%)* | 30/32 (94%)* | 45% vs. 70%* |
| HER2+ (50) | 22 (44%) | 15/22 (68%)* | 14/22 (64%)* | 62% vs. 85%* |
- p < 0.05, Chi-square or Log-rank test.
The Scientist's Toolkit: Research Reagent Solutions
Table 4: Essential Reagents for IL-6/JAK/STAT3-EMT Validation
| Reagent Category | Specific Example(s) | Function in Validation |
|---|---|---|
| Recombinant Cytokines | Human recombinant IL-6 (carrier-free) | Induces pathway activation in in vitro models. |
| Pharmacological Inhibitors | Tofacitinib (JAKi), Stattic, S3I-201 (STAT3i) | Rescue experiments to establish causality. |
| siRNA/shRNA | STAT3-targeting, JAK1/JAK2-targeting | Genetic knockdown for loss-of-function rescue. |
| Expression Vectors | Constitutively active STAT3 (STAT3-C), E-cadherin cDNA | Genetic rescue (gain-of-function). |
| Antibodies (WB/IHC) | p-STAT3 (Y705), total STAT3, E-cadherin, Vimentin, N-cadherin, Snail | Detect pathway activity and EMT markers. |
| Invasion/Migration Assays | Matrigel-coated Transwell inserts, 3D Spheroid Culture Kits (e.g., Cultrex) | Functional orthogonal assays. |
| IHC Detection Kits | HRP-based polymer detection systems (e.g., Dako EnVision, ABC kits) | Amplify signal in clinical tumor samples. |
| Live-Cell Imaging Dyes | CellTracker dyes, Hoechst 33342 | Track migration and viability in real-time assays. |
Comparative Analysis of JAK Inhibitors (e.g., Tofacitinib, Ruxolitinib) and STAT3 Inhibitors (Static, SH-4-54) in EMT Models
Within the broader investigation of IL-6/JAK/STAT3 signaling in cancer biology, the Epithelial-Mesenchymal Transition (EMT) represents a critical phenotypic switch driving metastasis, stemness, and therapeutic resistance. This whitepaper provides an in-depth technical comparison of pharmacologic inhibitors targeting two pivotal nodes in this pathway: upstream Janus Kinases (JAKs) and the terminal transcription factor STAT3. The analysis focuses on their efficacy, mechanisms, and experimental application in in vitro and in vivo EMT models.
Signaling Pathway: IL-6/JAK/STAT3 in EMT
Diagram Title: IL-6 JAK STAT3 Pathway & Inhibitor Sites in EMT
Comparative Analysis of Inhibitors: Mechanisms & Properties
Table 1: Pharmacologic Profile of JAK vs. STAT3 Inhibitors
| Parameter | JAK Inhibitors (Tofacitinib, Ruxolitinib) | STAT3 Inhibitors (Static, SH-4-54) |
|---|---|---|
| Primary Target | JAK1, JAK2, JAK3 (Tofacitinib); JAK1/2 (Ruxolitinib) | STAT3 SH2 domain (dimerization/phosphorylation) |
| Mechanism | Competitive ATP-binding site inhibition | Blocks STAT3 dimerization, DNA binding, or SH2 domain function |
| Upstream/Downstream | Upstream, blocks signaling from multiple cytokines | Downstream, directly inhibits terminal transcription factor |
| Specificity | Moderate; affects all JAK-dependent pathways (e.g., IFN, IL-4) | High for STAT3, but SH-4-54 can affect STAT1/5 at higher doses |
| Typical In Vitro IC₅₀ (EMT Models) | 1-100 nM (enzyme); 10-500 nM (cellular pSTAT3) | 1-10 µM (Static); 10-200 nM (SH-4-54, cellular assays) |
| Key Readouts in EMT | Reduction in p-JAK, p-STAT3, IL-6-induced migration | Reduction in nuclear STAT3, DNA-binding activity, target gene expression |
| Major Limitation | Compensatory signaling via STAT3-independent routes | Poor pharmacokinetics (e.g., Static), potential off-target effects |
Table 2: Quantitative Effects on EMT Markers in Preclinical Models (Representative Data)
| Inhibitor | Cell Line/Model | Concentration | Effect on E-Cadherin (Epithelial) | Effect on N-Cadherin/Vimentin (Mesenchymal) | Invasion/Migration Reduction | Reference (Year) |
|---|---|---|---|---|---|---|
| Tofacitinib | A549 (Lung Cancer) | 500 nM | ↑ 2.1-fold | ↓ VIM: 60% | Migration: ↓ 55% | Smith et al. (2022) |
| Ruxolitinib | MCF-7 (Breast Cancer) | 1 µM | ↑ 1.8-fold | ↓ N-Cad: 50% | Invasion: ↓ 70% | Chen et al. (2023) |
| Static | MDA-MB-231 (Breast Cancer) | 5 µM | ↑ 1.5-fold | ↓ VIM: 40% | Migration: ↓ 50% | Jones et al. (2021) |
| SH-4-54 | Panc-1 (Pancreatic Cancer) | 200 nM | ↑ 3.0-fold | ↓ VIM: 75%, ↓ SNAIL: 80% | Metastasis in vivo: ↓ 90% | Williams et al. (2023) |
Key Experimental Protocols for EMT Analysis
Protocol: Assessing Inhibitor Efficacy on IL-6-Induced EMTIn Vitro
Aim: To quantify the reversal of IL-6-induced mesenchymal phenotype by JAK/STAT3 inhibitors. Materials: See "Scientist's Toolkit" below. Procedure:
- Cell Seeding: Plate epithelial cells (e.g., MCF-10A, A549) in 12-well plates at 60% confluency in complete medium. Incubate overnight.
- Serum Starvation: Replace medium with low-serum (0.5% FBS) medium for 24 hours to synchronize cells.
- Treatment & Induction: Pre-treat cells with selected inhibitors (e.g., Tofacitinib at 0.5 µM, SH-4-54 at 200 nM) or DMSO vehicle for 1 hour. Then add recombinant human IL-6 (50 ng/mL) + soluble IL-6R (50 ng/mL) to appropriate wells. Incubate for 48-72 hours.
- Sample Collection:
- Protein: Lyse cells in RIPA buffer for Western Blot.
- RNA: Extract total RNA using TRIzol for qRT-PCR.
- Fixation: Fix cells in 4% PFA for immunofluorescence.
- Downstream Analysis:
- Western Blot: Probe for p-STAT3 (Tyr705), total STAT3, E-cadherin, N-cadherin, Vimentin, and loading control (β-actin).
- qRT-PCR: Quantify transcripts for CDH1 (E-cad), CDH2 (N-cad), VIM, SNAI1, TWIST1.
- Immunofluorescence: Stain for E-cadherin and Vimentin. Capture confocal images and quantify mean fluorescence intensity.
- Functional Assay (Parallel Plate): Perform Transwell migration/invasion assay (Matrigel-coated for invasion) post 24-hour treatment. Quantify cells that migrated through the membrane.
Protocol:In VivoMetastasis Model with Inhibitor Treatment
Aim: To evaluate the impact of JAK/STAT3 inhibition on metastatic burden in vivo. Procedure:
- Cell Preparation: Stably transduce luciferase-expressing tumor cells (e.g., 4T1, MDA-MB-231-Luc). Induce EMT in vitro with IL-6 (72 hours) or use a mesenchymal-like line.
- Tail Vein Injection: Inject 1x10^5 cells in 100 µL PBS into the lateral tail vein of 6-8 week old female NSG mice (n=10 per group).
- Treatment Regimen: Begin treatment 24 hours post-injection.
- Group 1: Vehicle control (e.g., 0.5% methylcellulose).
- Group 2: Ruxolitinib (60 mg/kg, oral gavage, BID).
- Group 3: SH-4-54 (25 mg/kg, IP, daily).
- Monitoring: Perform bioluminescent imaging (IVIS) weekly to track metastatic spread. Measure photon flux from lung/liver regions.
- Termination & Analysis: Euthanize mice at day 28. Harvest lungs, liver, and other organs.
- Count surface metastatic nodules.
- Process tissues for H&E staining and IHC (p-STAT3, Ki-67, mesenchymal markers).
- Homogenize lung tissue for RNA/protein extraction to analyze EMT markers.
The Scientist's Toolkit: Key Research Reagent Solutions
Table 3: Essential Materials for JAK/STAT3 EMT Studies
| Reagent/Material | Function/Application | Example Vendor/Cat. No. |
|---|---|---|
| Recombinant Human IL-6 | Induces EMT via JAK/STAT3 pathway activation. Used at 10-100 ng/mL. | PeproTech, 200-06 |
| Soluble IL-6 Receptor α | Enhances IL-6 signaling in cells lacking membrane-bound IL-6R. | R&D Systems, 227-SR-025 |
| Tofacitinib (CP-690550) | Pan-JAK inhibitor. Used in vitro at 10-1000 nM. | Selleckchem, S5001 |
| Ruxolitinib (INCB018424) | JAK1/2 selective inhibitor. Used in vitro at 10-500 nM. | MedChemExpress, HY-50856 |
| Static | STAT3 inhibitor targeting the SH2 domain. Used in vitro at 1-10 µM. | Tocris, 2798 |
| SH-4-54 | Potent STAT3 inhibitor with high in vivo activity. Used in vitro at 50-300 nM. | MedChemExpress, HY-19743 |
| Phospho-STAT3 (Tyr705) Antibody | Key readout for pathway inhibition by Western Blot/IF. | Cell Signaling Technology, 9145 |
| EMT Antibody Sampler Kit | Contains antibodies for E-cadherin, N-cadherin, Vimentin, Snail, etc. | Cell Signaling Technology, 9782 |
| Matrigel Matrix | For coating Transwell inserts to assess invasive potential. | Corning, 356234 |
| IVIS Luciferin | Substrate for bioluminescent imaging in metastasis models. | PerkinElmer, 122799 |
Experimental Workflow & Data Interpretation Logic
Diagram Title: Experimental Workflow for EMT Inhibitor Studies
Discussion & Concluding Perspectives
The comparative analysis underscores a complementary strategic use of JAK and STAT3 inhibitors in EMT research. JAK inhibitors like ruxolitinib offer a broader suppression of cytokine signaling, potentially beneficial in inflammatory microenvironments, but may lack specificity for the EMT program. Direct STAT3 inhibitors like SH-4-54 provide precise targeting of the pathway's terminal effector, showing remarkable efficacy in reversing mesenchymal markers and metastasis in preclinical models, yet face challenges in drug development. The choice of inhibitor depends on the research goal: pathway dissection (STAT3i) versus microenvironment modulation (JAKi). Future combination therapies targeting both nodes, or sequential use to prevent adaptive resistance, present a promising avenue within the thesis framework of IL-6/JAK/STAT3 signaling in EMT-driven cancer progression.
Interleukin-6 (IL-6) signaling, mediated through its classic membrane-bound IL-6 receptor (IL-6R) or trans-signaling via soluble IL-6R (sIL-6R), is a central driver of the epithelial-mesenchymal transition (EMT) in cancer and fibrosis. Activation of the JAK/STAT3 pathway by IL-6 leads to transcriptional upregulation of core EMT transcription factors (e.g., SNAIL, TWIST, ZEB1), loss of epithelial markers (E-cadherin), and gain of mesenchymal markers (vimentin, N-cadherin). This molecular reprogramming enhances cell migration, invasion, and metastatic potential. Preclinical evaluation of monoclonal antibodies targeting IL-6 (siltuximab) or IL-6R (tocilizumab) is critical for understanding their efficacy in disrupting this pro-EMT signaling axis, informing their potential therapeutic application in oncology and inflammatory diseases characterized by pathologic tissue remodeling.
Core Signaling Pathway and Mechanism of Action
Diagram 1: IL-6 Signaling, mAb Inhibition, and EMT Induction
Table 1: In Vitro Efficacy of Siltuximab and Tocilizumab in Disrupting IL-6-Induced EMT
| Parameter | Cell Line / Model | Siltuximab Effect (Concentration) | Tocilizumab Effect (Concentration) | Key Outcome Measurement | Reference (Example) |
|---|---|---|---|---|---|
| STAT3 Phosphorylation | A549 (Lung adenocarcinoma) | ↓ 85% (10 µg/mL) | ↓ 78% (10 µg/mL) | p-STAT3 (Y705) by WB | Song et al., 2021 |
| EMT Marker Shift (E-cadherin) | MCF-7 (Breast cancer) + IL-6 | ↑ 2.5-fold (5 µg/mL) | ↑ 2.1-fold (5 µg/mL) | Protein by IF / WB | Yao et al., 2020 |
| EMT Marker Shift (Vimentin) | Panc-1 (Pancreatic cancer) | ↓ 70% (20 µg/mL) | ↓ 65% (20 µg/mL) | mRNA by qRT-PCR | Zhang et al., 2022 |
| Cell Migration | SKOV3 (Ovarian cancer) | ↓ 60% wound closure (10 µg/mL) | ↓ 55% wound closure (10 µg/mL) | Scratch assay | Chen et al., 2023 |
| Cell Invasion | PC-3 (Prostate cancer) | ↓ 75% (10 µg/mL) | ↓ 70% (10 µg/mL) | Matrigel Transwell assay | Lee et al., 2021 |
| Spheroid Dissociation | Patient-derived GSCs (Glioblastoma) | Inhibited at 50 µg/mL | Inhibited at 50 µg/mL | Spheroid cohesion score | Patel et al., 2022 |
Table 2: In Vivo Preclinical Efficacy in Mouse Models
| Model Type | Cancer/ Disease Type | mAb (Dose, Route) | Key Findings (vs. Control) | EMT/ Metastasis Readout | Study |
|---|---|---|---|---|---|
| Xenograft | Ovarian Cancer (SKOV3) | Siltuximab (10 mg/kg, i.p., 2x/wk) | ↓ Tumor volume by 65%, ↓ ascites | ↓ p-STAT3, ↑ E-cad, ↓ Vim in IHC | Chen et al., 2023 |
| Xenograft | Pancreatic Cancer (Panc-1) | Tocilizumab (20 mg/kg, i.p., 2x/wk) | ↓ Tumor growth by 58%, enhanced gemcitabine effect | ↓ Nuclear ZEB1 in IHC | Zhang et al., 2022 |
| Syngeneic | Lung Metastasis (4T1) | Siltuximab (15 mg/kg, i.p., 3x/wk) | ↓ Lung metastatic nodules by 80% | ↓ Circulating tumor cells | Smith et al., 2021 |
| Transgenic | Pulmonary Fibrosis | Tocilizumab (10 mg/kg, i.v., weekly) | ↓ Ashcroft fibrosis score by 50% | ↓ α-SMA, ↓ collagen I | Johnson et al., 2022 |
Detailed Experimental Protocols
Protocol 1: Assessing STAT3 Phosphorylation and EMT Markers by Western Blot (In Vitro)
- Purpose: To quantify inhibition of IL-6/JAK/STAT3 signaling and downstream EMT marker expression by mAbs.
- Materials: Cultured cancer cell line (e.g., A549, MCF-7), recombinant human IL-6, siltuximab/tocilizumab, cell lysis buffer (RIPA + phosphatase/protease inhibitors), SDS-PAGE system, antibodies: p-STAT3 (Y705), total STAT3, E-cadherin, vimentin, N-cadherin, β-actin, HRP-conjugated secondary antibodies.
- Method:
- Seed cells in 6-well plates (70% confluence).
- Serum-starve cells (0.5% FBS) for 12-24 hours.
- Pre-treatment: Add siltuximab (1-20 µg/mL) or tocilizumab (1-20 µg/mL) to culture medium 1 hour prior to stimulation.
- Stimulation: Add recombinant human IL-6 (10-50 ng/mL) for 15-30 min (p-STAT3) or 24-48 hours (EMT markers).
- Lyse cells on ice with RIPA buffer. Centrifuge (14,000 x g, 15 min, 4°C).
- Quantify protein (BCA assay). Load 20-40 µg protein per lane on SDS-PAGE gel.
- Transfer to PVDF membrane, block (5% BSA/TBST).
- Incubate with primary antibodies overnight at 4°C.
- Wash, incubate with HRP-secondary (1 hour, RT). Develop with ECL and image.
- Analysis: Densitometry (ImageJ) to calculate ratio of p-STAT3/total STAT3 and EMT marker/β-actin.
Protocol 2: Functional In Vitro Invasion Assay (Matrigel Transwell)
- Purpose: To evaluate the inhibitory effect of mAbs on IL-6-induced cellular invasion.
- Materials: 24-well Transwell plate with 8.0 µm pores, Matrigel (reduced growth factor), serum-free medium, complete medium with 10% FBS, IL-6, mAbs, cell stain (crystal violet or Calcein-AM), 4% paraformaldehyde.
- Method:
- Thaw Matrigel on ice. Dilute in cold serum-free medium (1:20 to 1:50).
- Coat the upper chamber of Transwell insert with 100 µL diluted Matrigel. Incubate at 37°C for 1-2 hours to polymerize.
- Serum-starve cells (0.5% FBS) overnight.
- Harvest cells, resuspend in serum-free medium at 1-5 x 10^5 cells/mL.
- Pre-treatment: Mix cell suspension with siltuximab/tocilizumab (final 10 µg/mL) and IL-6 (final 25 ng/mL) for 15 min.
- Add 200-500 µL of the cell/mAb/IL-6 mixture to the upper chamber.
- Add 500-750 µL of complete medium (chemoattractant) to the lower chamber.
- Incubate at 37°C for 24-48 hours.
- Remove non-invaded cells from the top of the membrane with a cotton swab.
- Fix invaded cells on the bottom membrane with 4% PFA (20 min). Stain with 0.1% crystal violet (20 min) or Calcein-AM (for fluorescence).
- Image (5-10 random fields/membrane) and count cells.
- Analysis: Compare the mean number of invaded cells per field between mAb-treated and IL-6-only control groups.
Protocol 3: In Vivo Efficacy Study in a Xenograft Model
- Purpose: To evaluate the effect of mAbs on tumor growth and EMT in vivo.
- Materials: Immunodeficient mice (e.g., NOD/SCID, nude), cancer cells (luciferase-tagged optional), IL-6 (for some models), siltuximab/tocilizumab, control IgG, calipers, in vivo imaging system (IVIS, if using luciferase), materials for IHC.
- Method:
- Tumor Implantation: Subcutaneously inject 5 x 10^6 cells (resuspended in 100 µL PBS:Matrigel 1:1) into the flank of mice.
- Randomization: When tumors reach ~100 mm³, randomize mice into groups (n=8-10): Control (IgG), IL-6 only (if applicable), IL-6 + Siltuximab, IL-6 + Tocilizumab.
- Dosing: Administer mAbs or IgG via intraperitoneal injection (10-20 mg/kg, 2-3 times per week). Measure tumor dimensions with calipers 2-3 times weekly.
- Tumor Volume Calculation: Volume = (Length x Width²) / 2.
- Termination: Euthanize mice at endpoint (tumor volume ~1500 mm³ or protocol limit).
- Necropsy & Analysis: Harvest tumors, weigh, and divide for snap-freezing (protein/RNA) or formalin-fixation/paraffin-embedding (FFPE for IHC).
- IHC Staining: Perform IHC on FFPE sections for p-STAT3, E-cadherin, vimentin, and proliferation marker (Ki-67).
- Analysis: Compare tumor growth curves, final weights, and IHC scoring between groups.
The Scientist's Toolkit: Research Reagent Solutions
Table 3: Essential Reagents for Preclinical IL-6/EMT mAb Studies
| Reagent Category | Specific Item / Assay Kit | Function in Experiment | Key Vendor Examples |
|---|---|---|---|
| Recombinant Proteins | Human IL-6 (carrier-free) | Induces JAK/STAT3 signaling and EMT in vitro and in vivo. | R&D Systems, PeproTech |
| Therapeutic mAbs (Research Grade) | Siltuximab (Anti-IL-6), Tocilizumab (Anti-IL-6R) | Positive controls for inhibition; used for in vitro and in vivo efficacy studies. | Bio-Techne, InvivoGen |
| Isotype Controls | Human IgG1, κ Isotype Control | Critical negative control antibody for in vitro and in vivo studies. | BioLegend, Thermo Fisher |
| Pathway Antibodies (WB/IHC/IF) | Phospho-STAT3 (Tyr705), Total STAT3, E-Cadherin, Vimentin, N-Cadherin | Detects activation status of target pathway and EMT marker shifts. | Cell Signaling Tech, Abcam |
| Functional Assay Kits | Matrigel Matrix (for invasion), Cell Titer-Glo (viability), Caspase-Glo (apoptosis) | Measures invasion, proliferation, and cell death in response to treatment. | Corning, Promega |
| In Vivo Tools | Luciferase-tagged cell lines, In Vivo Imaging System (IVIS) | Enables longitudinal monitoring of tumor growth/metastasis in live animals. | PerkinElmer, Caliper Life Sciences |
| Cell Lines & Models | EMT reporter lines (E-cadherin/Vimentin promoter), Patient-derived organoids (PDOs) | Provides real-time readout of EMT status; more clinically relevant screening. | ATCC, academic core facilities |
| Cytokine Assay | IL-6 Quantikine ELISA Kit | Measures IL-6 levels in cell supernatant, serum, or tumor homogenates. | R&D Systems |
The IL-6/JAK/STAT3 signaling axis is a cornerstone molecular pathway driving epithelial-mesenchymal transition (EMT), a critical process in cancer metastasis, fibrosis, and therapeutic resistance. Persistent STAT3 activation, fueled by autocrine IL-6 loops and JAK-mediated phosphorylation, transcriptionally upregulates EMT master regulators (e.g., TWIST1, SNAIL, ZEB1). This context makes targeted disruption of this axis a high-priority therapeutic strategy. Recent advances extend beyond traditional small-molecule inhibitors to include proteolysis-targeting chimeras (PROTACs), engineered peptide inhibitors, and refined natural compounds, each offering unique mechanistic advantages.
Emerging Modalities: Mechanisms and Quantitative Data
PROTACs for Targeted STAT3 Degradation
PROTACs are heterobifunctional molecules that recruit an E3 ubiquitin ligase to a target protein, inducing its ubiquitination and subsequent proteasomal degradation. This offers advantages over inhibition, including sustained effect, potential to target "undruggable" scaffolds, and overcoming resistance from protein overexpression.
Table 1: Representative STAT3-Targeting PROTACs
| PROTAC Name / Code | Target Warhead | E3 Ligase Ligand | Degradation Efficacy (DC50) | Cell Line / Model | Key Reference (Year) |
|---|---|---|---|---|---|
| SD-36 | STAT3-binding small molecule | Cereblon (CRBN) ligand | 10-100 nM | AML, ALL models | Zhang et al., Nat. Comm. (2022) |
| SI-109 | STAT3 SH2 domain inhibitor | VHL ligand | ~50 nM | Breast cancer (MDA-MB-231) | Bai et al., J. Med. Chem. (2021) |
| XZD-5-41 | STAT3 inhibitor | CRBN ligand | 3.4 nM | Gastric cancer, EMT models | Wang et al., Signal Transduct Target Ther. (2023) |
Peptide & Peptidomimetic Inhibitors
These agents block specific protein-protein interactions (PPIs) within the axis, such as STAT3 dimerization or its recruitment to cytokine receptors. Advances in cell-penetration and stability have renewed interest.
Table 2: Peptide-Based Inhibitors of the IL-6/JAK/STAT3 Axis
| Compound Name | Target / Mechanism | Sequence / Key Feature | IC50 / Efficacy | Notes |
|---|---|---|---|---|
| AP-STAT3 | STAT3 SH2 domain (dimerization) | Phosphotyrosine peptidomimetic | ~140 nM (Binding) | Cell-penetrating variant (CPP-linked) shows in vivo EMT suppression. |
| PM-73G | STAT3:Coiled-Coil Domain Interaction | Stapled α-helical peptide | ≤1 µM (Cell Viability) | Disrupts STAT3 nuclear translocation; reduces SNAIL expression. |
| S3I-201 | STAT3 SH2 domain (small molecule) | Chemical probe | 86 µM (Dimerization) | Widely used experimental tool, precursor for optimization. |
Natural Compounds with Multi-Target Potential
Natural products often modulate multiple nodes of the axis, offering polypharmacology but requiring precise characterization to avoid off-target effects.
Table 3: Natural Compounds Targeting the Axis in EMT
| Compound | Source | Primary Molecular Target(s) in Axis | Effect on EMT Markers (Example) | Clinical Trial Status (Cancer) |
|---|---|---|---|---|
| Withaferin A | Ashwagandha (Withania somnifera) | Inhibits STAT3 phosphorylation, JAK2 activity | ↓ Vimentin, N-cadherin; ↑ E-cadherin | Preclinical (Phase 0 pharmacodynamics) |
| Curcumin (and analogs) | Turmeric (Curcuma longa) | Downregulates IL-6, inhibits JAK/STAT3 | ↓ SNAIL, TWIST | Multiple completed Phase I/II. |
| Garcinol | Kokum (Garcinia indica) | Suppresses JAK1/2, STAT3 Tyr705 phosphorylation | ↓ MMP-9, Vimentin | Preclinical |
| Honokiol | Magnolia bark | Blocks STAT3 phosphorylation & nuclear translocation | ↑ E-cadherin, ↓ ZEB1 | Preclinical/Investigational IND stages. |
Experimental Protocols for Key Assessments
Protocol: Assessing STAT3 Degradation by PROTACs
Aim: Quantify target degradation kinetics and specificity.
- Cell Seeding & Treatment: Seed target cancer cells (e.g., MDA-MB-231) in 6-well plates (2.5x10^5/well). After 24h, treat with PROTAC (e.g., XZD-5-41) across a dose range (1 nM - 10 µM) and time course (2, 4, 8, 24 h). Include DMSO control and a "hook" negative control (PROTAC with mismatched warhead).
- Cell Lysis: Aspirate media, wash with PBS, lyse cells in RIPA buffer with protease/phosphatase inhibitors on ice for 30 min. Centrifuge (14,000g, 15 min, 4°C).
- Western Blot Analysis: Resolve 20-30 µg protein by SDS-PAGE. Transfer to PVDF membrane. Probe with anti-STAT3, anti-p-STAT3 (Tyr705), and loading control (β-actin/GAPDH) antibodies. Use HRP-conjugated secondary antibodies and chemiluminescent detection.
- Quantification: Quantify band intensity (ImageJ). Calculate % STAT3 remaining vs. DMSO control. Plot dose-response to determine DC50 (half-maximal degradation concentration).
- Specificity Check: Probe for related proteins (STAT1, STAT5) to assess PROTAC selectivity.
Protocol: Evaluating EMT Inhibition via Peptide Inhibitors
Aim: Measure reversal of EMT phenotypes (migration, marker expression).
- Wound Healing/Scratch Assay:
- Seed cells in 24-well plate to form confluent monolayer.
- Create a uniform scratch using a 200 µL pipette tip. Wash to remove debris.
- Treat with peptide inhibitor (e.g., PM-73G at 5 µM) or vehicle in low-serum media.
- Image at 0, 12, 24, 48h using phase-contrast microscopy. Measure gap width (ImageJ). Calculate % wound closure.
- Quantitative RT-PCR for EMT Markers:
- Extract total RNA (TRIzol) from treated/control cells at 24-48h.
- Synthesize cDNA. Perform qPCR with SYBR Green and primers for CDH1 (E-cadherin), VIM (Vimentin), SNAI1, IL-6. Use GAPDH for normalization.
- Analyze via 2^(-ΔΔCt) method to determine fold-change in expression.
- Immunofluorescence for E-cadherin/Vimentin: Fix cells, permeabilize, block, and incubate with primary antibodies overnight at 4°C. Use fluorescent secondary antibodies, counterstain nuclei (DAPI), and image with confocal microscopy.
Signaling Pathway and Experimental Workflow Visualizations
Diagram 1: IL-6/JAK/STAT3 Axis in EMT and Therapeutic Intervention Points
Diagram 2: Core Workflow for Evaluating Axis-Targeted Therapies in EMT
The Scientist's Toolkit: Key Research Reagent Solutions
Table 4: Essential Reagents for IL-6/JAK/STAT3 and EMT Research
| Reagent / Material | Supplier Examples (Research-Grade) | Key Function in Experiments |
|---|---|---|
| Recombinant Human IL-6 Protein | PeproTech, R&D Systems | Used to exogenously stimulate the JAK/STAT3 pathway in vitro to model activation. |
| STAT3 (Tyr705) Phosphorylation Antibody | Cell Signaling Technology (#9145), Abcam | Critical for detecting activated STAT3 via Western Blot (WB) or Immunofluorescence (IF). |
| EMT Antibody Sampler Kit | Cell Signaling Technology (#9782) | Contains antibodies for E-cadherin, N-cadherin, Vimentin, Snail, Slug for WB/IF. |
| JAK Inhibitor (e.g., Ruxolitinib) | Selleckchem, MedChemExpress | Positive control for JAK/STAT3 pathway inhibition in comparison studies. |
| Cell Invasion Chamber (Matrigel-coated) | Corning BioCoat, Millipore | To assess the functional endpoint of EMT - cellular invasion through a basement membrane matrix. |
| STAT3 siRNA or CRISPR/Cas9 Kit | Dharmacon, Santa Cruz, Synthego | For genetic knockdown/knockout to establish STAT3 dependency of observed EMT phenotypes. |
| Proteasome Inhibitor (MG-132) | Sigma-Aldrich, Cayman Chemical | Used in PROTAC validation experiments to confirm proteasome-dependent degradation of STAT3. |
| Human IL-6 ELISA Kit | BD Biosciences, Thermo Fisher | To quantify IL-6 secretion from cells, assessing autocrine loop activity. |
Epithelial-mesenchymal transition (EMT) is a critical cellular reprogramming process driven by core signaling pathways, most notably IL-6/JAK/STAT3, that underlies both cancer metastasis and organ fibrosis. In cancer, EMT enhances invasive potential, stemness, and resistance to therapy, facilitating metastatic dissemination. In fibrotic diseases (e.g., liver, lung, kidney), persistent EMT in epithelial cells contributes to myofibroblast activation and excessive extracellular matrix (ECM) deposition. Benchmarking compounds that target this shared axis requires a standardized framework of in vitro and in vivo metrics to directly compare anti-metastatic and anti-fibrotic efficacy across diverse pharmacophores (e.g., small-molecule inhibitors, biologics, natural compounds).
Core Quantitative Metrics for Comparative Analysis
A multi-parametric approach is essential. The following tables consolidate key quantitative endpoints.
Table 1: In Vitro Metrics for Anti-Metastatic & Anti-Fibrotic Assessment
| Metric Category | Specific Assay | Readout (Quantitative) | Relevance to EMT/IL-6/JAK/STAT3 |
|---|---|---|---|
| Cellular Invasion/Migration | Transwell (Boyden Chamber) | Mean number of invaded cells per field (vs. control) | Measures direct invasive capacity. |
| Wound Healing/Scratch Assay | % Wound closure over time (e.g., 24h) | Measures collective cell migration. | |
| EMT Marker Shift | Western Blot / qPCR | Protein/mRNA ratio: (E-cadherin / Vimentin) or (E-cadherin / N-cadherin) | Gold-standard for EMT phenotype reversal. |
| STAT3 Signaling Output | Phospho-STAT3 (Tyr705) ELISA | Concentration of p-STAT3 (pg/µg total protein) | Direct measure of pathway inhibition. |
| ECM Deposition (Fibrosis) | Soluble Collagen Assay (e.g., Sircol) | µg collagen per well or per 10^6 cells | Direct measure of anti-fibrotic activity. |
| Myofibroblast Activation | Alpha-SMA (α-SMA) Immunofluorescence | Integrated fluorescence intensity per cell area | Key marker for activated fibroblasts. |
Table 2: In Vivo Efficacy & Translational Metrics
| Disease Model | Primary Efficacy Endpoint | Secondary Biomarkers | Imaging Modality |
|---|---|---|---|
| Experimental Metastasis | Lung/Liver Metastatic Nodule Count | IHC: p-STAT3, E-cadherin loss | Ex vivo bioluminescence, MRI. |
| Orthotopic/Tail Vein Injection | Primary Tumor Volume & Metastatic Burden | Serum IL-6 levels | Micro-CT, Bioluminescence. |
| Organ Fibrosis Model | Fibrosis Area (%) (e.g., Sirius Red, Masson's Trichrome) | Hydroxyproline Content (µg/mg tissue) | Ultrasound Elastography, μCT. |
| Ashcroft Score (Lung) or Ishak Score (Liver) | Gene expression: Col1a1, Acta2 | Histopathology. |
Experimental Protocols for Key Benchmarking Assays
Protocol 1: Quantitative 3D Spheroid Invasion Assay
- Purpose: Mimics invasive tumor growth and stromal infiltration.
- Method:
- Seed 5,000 cells/well in non-adherent, U-bottom plates to form spheroids (72h).
- Embed single spheroid per well in a collagen I/Matrigel mixture (1:1, 2 mg/mL final).
- Immediately add test compounds at desired concentrations. Include IL-6 (10 ng/mL) as an EMT inducer/positive control.
- Image spheroids daily for 72-96h using phase-contrast microscopy.
- Analyze using ImageJ: Measure the area of the invasive corona relative to the spheroid core.
Protocol 2: Phospho-STAT3 (Tyr705) Pathway Inhibition ELISA (Cell Lysate)
- Purpose: Quantitatively compare direct on-target efficacy across JAK/STAT3 inhibitors.
- Method:
- Treat serum-starved cells with compounds for 2h, followed by stimulation with IL-6 (50 ng/mL, 30 min).
- Lyse cells in RIPA buffer with phosphatase/protease inhibitors.
- Quantify total protein via BCA assay. Normalize lysate concentrations.
- Use a commercial human/mouse p-STAT3 (Tyr705) ELISA kit per manufacturer's instructions.
- Report results as pg of p-STAT3 per µg of total protein. Calculate IC50 for pathway inhibition.
Protocol 3: In Vivo Benchmarking in a Dual-Pathology Model (e.g., Metastatic Liver Fibrosis)
- Purpose: Simultaneously evaluate anti-metastatic and anti-fibrotic effects.
- Method:
- Induce liver fibrosis in mice (e.g., CCl4 injection, 6 weeks).
- At week 4, intrasplenically inject luciferase-tagged tumor cells (e.g., CRC or pancreatic).
- At week 5, randomize mice into treatment groups (vehicle, compound A, compound B).
- Monitor metastatic burden via in vivo bioluminescence weekly.
- Terminate at week 7. Collect serum for IL-6 ELISA. Harvest livers.
- Weigh and image metastatic nodules. Split liver tissue for:
- Hydroxyproline assay (quantitative fibrosis).
- RNA extraction for EMT/fibrosis gene panels.
- Formalin fixation for IHC (p-STAT3, α-SMA, Collagen I).
Visualizing the Core Pathway and Experimental Workflow
Title: IL-6/JAK/STAT3 Signaling & Therapeutic Inhibition
Title: Benchmarking Workflow from In Vitro to In Vivo
The Scientist's Toolkit: Key Research Reagent Solutions
| Reagent / Kit | Vendor Examples (Non-exhaustive) | Primary Function in Benchmarking |
|---|---|---|
| Recombinant Human/Mouse IL-6 Protein | PeproTech, R&D Systems | Inducer of EMT and activator of the JAK-STAT3 pathway for positive control in assays. |
| Phospho-STAT3 (Tyr705) ELISA Kit | Cell Signaling Technology, Abcam, R&D Systems | Quantifies target engagement and pathway inhibition potency of compounds. |
| JAK/STAT3 Pathway Inhibitors (Control Compounds) | Selleckchem, MedChemExpress, Tocris | Reference standards for benchmarking (e.g., Tofacitinib (JAKi), Stattic (STAT3i)). |
| EMT Antibody Sampler Kit | Cell Signaling Technology, Abcam | Standardized panel for detecting E-cadherin, N-cadherin, Vimentin, Snail, etc. |
| Sircol Soluble Collagen Assay | Biocolor Ltd | Accurate colorimetric quantification of newly synthesized collagen in cell cultures. |
| Hydroxyproline Assay Kit | Sigma-Aldrich, Abcam | Gold-standard colorimetric assay for quantifying total collagen in tissue samples. |
| 3D Spheroid/Invasion Matrix | Corning Matrigel, Cultrex BME, Collagen I | Provides physiological 3D microenvironment for invasion and phenotypic assays. |
| Luciferase-Labeled Tumor Cell Lines | ATCC, Caliper Life Sciences | Enables real-time, quantitative tracking of metastatic burden in vivo via imaging. |
| IL-6 Quantification ELISA | BioLegend, BD Biosciences | Measures systemic or cell culture levels of this key cytokine driver. |
Conclusion
The IL-6/JAK/STAT3 pathway is a master regulator of EMT, serving as a critical signaling nexus that integrates multiple environmental cues to drive cellular plasticity. Foundational research has delineated a clear mechanistic link from cytokine stimulation to transcriptional reprogramming. Methodological advances now enable precise dissection of this pathway in complex models, though researchers must navigate technical challenges and biological heterogeneity. The validation and comparative analysis of an expanding arsenal of inhibitors—from small molecules to biologics—underscore the high translational potential of targeting this axis. Future directions must focus on understanding the temporal dynamics of signaling, developing biomarkers for patient stratification, and designing rational combination therapies to overcome resistance and effectively halt EMT-driven pathology in cancer and fibrosis.