M1 vs M2 Macrophage Markers: Decoding CD80, CD86, CD163, and CD206 for Research and Therapeutics
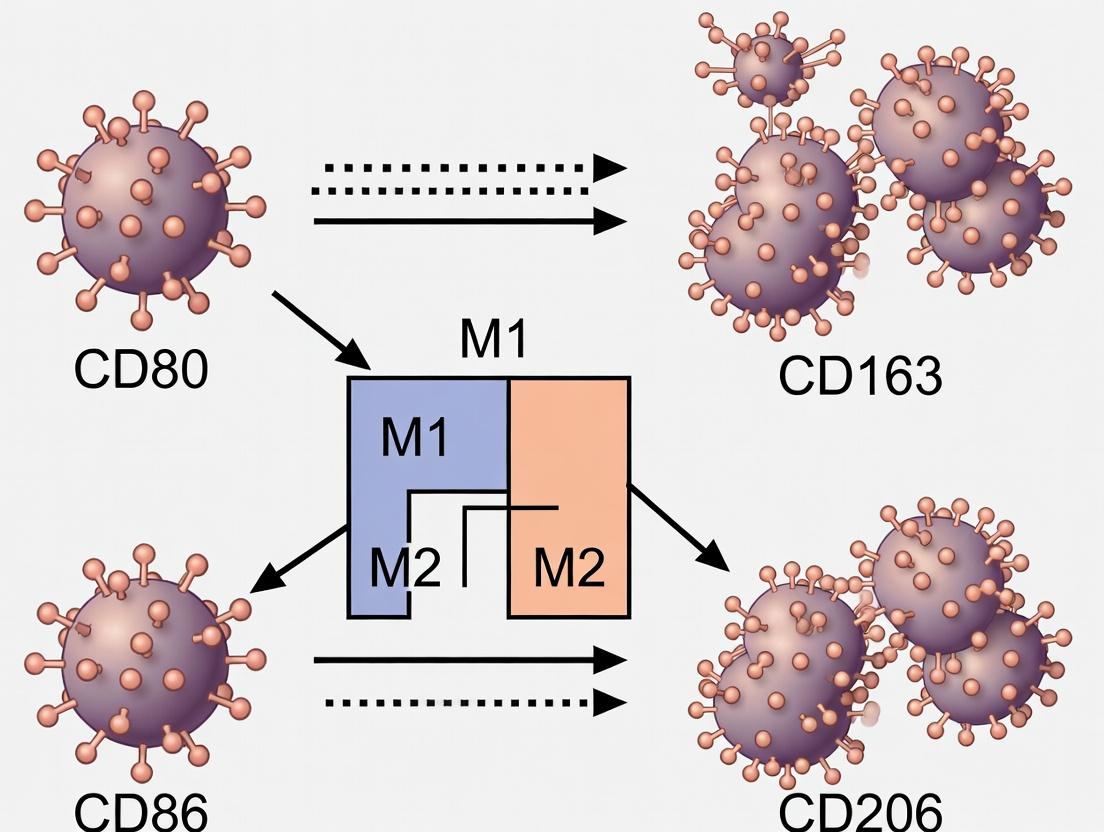
This comprehensive guide provides researchers, scientists, and drug development professionals with an in-depth analysis of the key surface markers—CD80, CD86 (M1-associated), CD163, and CD206 (M2-associated)—used to define macrophage polarization.
M1 vs M2 Macrophage Markers: Decoding CD80, CD86, CD163, and CD206 for Research and Therapeutics
Abstract
This comprehensive guide provides researchers, scientists, and drug development professionals with an in-depth analysis of the key surface markers—CD80, CD86 (M1-associated), CD163, and CD206 (M2-associated)—used to define macrophage polarization. The article explores the foundational biology and functional significance of these markers, details state-of-the-art methodologies for their detection and application in experimental models, addresses common challenges in assay optimization, and critically evaluates marker specificity and validation strategies. By synthesizing current literature and methodological insights, this resource aims to enhance the rigor of macrophage phenotyping in immunological research, disease modeling, and the development of macrophage-targeted therapies.
Understanding Macrophage Polarization: The Essential Roles of CD80, CD86, CD163, and CD206
This whitepaper details the M1/M2 macrophage activation paradigm as a functional spectrum, framed within a broader research thesis investigating surface markers CD80, CD86, CD163, and CD206. The dichotomous classification, while useful, is an oversimplification; macrophage activation exists as a continuum influenced by the tissue microenvironment. This document provides a technical guide for researchers, synthesizing current data, experimental protocols, and key resources to advance therapeutic targeting in immuno-oncology, fibrosis, and chronic inflammatory diseases.
Core Surface Markers: Quantitative Profiling
The phenotypic and functional spectrum of macrophage activation is defined by distinct, yet often co-expressed, surface markers. The table below summarizes key quantitative data for the canonical markers CD80, CD86, CD163, and CD206.
Table 1: Quantitative Profile of Core Macrophage Surface Markers
| Marker | Primary Association | Ligand/Function | Expression Level (Relative MFI ± SD)* | Key Inducing Stimuli | Reporter Cell Lines/Assays |
|---|---|---|---|---|---|
| CD80 (B7-1) | M1 / Classical | Binds CD28/CTLA-4; Co-stimulation | 850 ± 120 (M1) vs 45 ± 15 (M0) | LPS (100 ng/mL) + IFN-γ (20 ng/mL) | Mixed Lymphocyte Reaction (MLR) |
| CD86 (B7-2) | M1 / Classical | Binds CD28/CTLA-4; Co-stimulation | 1200 ± 180 (M1) vs 80 ± 20 (M0) | LPS, IFN-γ, GM-CSF (50 ng/mL) | MLR; CTLA-4-Ig Fusion Protein Binding |
| CD163 | M2c / Alternative | Hemoglobin-haptoglobin scavenger receptor | 3200 ± 450 (M2c) vs 150 ± 30 (M0) | IL-10 (50 ng/mL), Glucocorticoids | Soluble CD163 (sCD163) ELISA |
| CD206 (MMR) | M2a / Alternative | Mannose, fucose glycoprotein endocytosis | 4100 ± 600 (M2a) vs 200 ± 50 (M0) | IL-4 (20 ng/mL), IL-13 (20 ng/mL) | FITC-Dextran Uptake Assay |
*MFI: Mean Fluorescence Intensity from flow cytometry of in vitro-differentiated human monocyte-derived macrophages (MDMs). SD: Standard Deviation. M0: Unpolarized.
Key Signaling Pathways and Polarization
Polarization stimuli activate specific intracellular signaling cascades, leading to distinct transcriptional programs. The diagrams below illustrate the primary pathways for M1 and M2a polarization.
Detailed Experimental Protocols
Protocol 4.1: In Vitro Generation and Polarization of Human Monocyte-Derived Macrophages (MDMs) for Marker Analysis
Objective: To generate M0, M1, and M2a/c macrophages from human primary monocytes and analyze surface marker expression via flow cytometry.
Materials: See "The Scientist's Toolkit" (Section 6).
Procedure:
- Monocyte Isolation: Isolate PBMCs from leukapheresis or buffy coat using Ficoll-Paque density gradient centrifugation. Isolate CD14+ monocytes using positive magnetic selection (e.g., CD14 MicroBeads) per manufacturer's protocol.
- M0 Macrophage Differentiation: Resuspend monocytes at 0.5-1 x 10^6 cells/mL in differentiation medium (RPMI-1640, 10% FBS, 1% Pen/Strep, 50 ng/mL recombinant human M-CSF). Seed in tissue culture plates. Incubate at 37°C, 5% CO2 for 6 days. Refresh medium with fresh M-CSF on day 3.
- Macrophage Polarization (Day 6):
- M1: Treat M0 macrophages for 48 hours with 100 ng/mL Ultrapure LPS E. coli + 20 ng/mL IFN-γ.
- M2a: Treat for 48 hours with 20 ng/mL IL-4 + 20 ng/mL IL-13.
- M2c: Treat for 48 hours with 50 ng/mL IL-10.
- M0 Control: Continue culture in differentiation medium only.
- Flow Cytometry Staining: a. Harvest cells using gentle scraping with cold PBS + 2 mM EDTA. b. Wash with FACS buffer (PBS + 2% FBS). c. Incubate with Human TruStain FcX for 10 min to block Fc receptors. d. Stain with antibody cocktail for 30 min at 4°C in the dark. Recommended Panel: Anti-CD80-FITC, Anti-CD86-PE/Cy7, Anti-CD163-APC, Anti-CD206-PE, viability dye (e.g., Zombie NIR). e. Wash twice with FACS buffer, resuspend in fixation buffer (1% PFA), and acquire on a flow cytometer within 24 hours.
- Data Analysis: Gate on single, live, CD14+ cells. Report Mean Fluorescence Intensity (MFI) for each marker, normalized to unstained and fluorescence-minus-one (FMO) controls.
Protocol 4.2: Functional Validation of CD206 via Endocytosis Assay
Objective: To validate the functional activity of M2a-polarized macrophages by measuring mannose receptor (CD206)-mediated endocytosis.
Procedure:
- Generate M0 and M2a (IL-4/IL-13) MDMs as in Protocol 4.1 in a black-walled, clear-bottom 96-well plate.
- Prepare FITC-Dextran (MW 40,000) working solution at 100 µg/mL in pre-warmed assay medium (RPMI, 1% FBS).
- Inhibition Control: Pre-treat a subset of M2a wells with 10 mM Mannan in assay medium for 30 min to competitively block CD206.
- Aspirate polarization media from all wells. Add 100 µL of FITC-Dextran solution (with or without Mannan) to respective wells. Include wells with FITC-Dextran solution only (no cells) for background subtraction.
- Incubate at 37°C, 5% CO2 for 45 minutes.
- Stop and Wash: Immediately place plate on ice. Aspirate solution and wash cells 4x with ice-cold PBS containing 0.1% BSA and 0.1% sodium azide.
- Lyse cells in 100 µL of RIPA buffer with 1% Triton X-100. Measure fluorescence (Ex 485 nm / Em 520 nm) on a plate reader.
- Calculation: Subtract background fluorescence (solution-only wells). Report fluorescence units or calculate fold-change (M2a vs. M0). Mannan-treated wells should show >70% reduction in M2a uptake.
Experimental Workflow for Thesis Research
The following diagram outlines a comprehensive workflow for a research thesis investigating macrophage surface markers.
The Scientist's Toolkit: Essential Research Reagents
Table 2: Key Reagents for Macrophage Polarization and Analysis
| Reagent Category | Specific Product/Example | Function in Research |
|---|---|---|
| Cytokines (rh) | M-CSF (Cat# 300-25), IL-4 (Cat# 200-04), IL-10 (Cat# 200-10), IFN-γ (Cat# 300-02) (PeproTech) | Induce differentiation (M-CSF) and specific polarization (M1: IFN-γ; M2a: IL-4; M2c: IL-10). |
| Polarization Inducer | Ultrapure LPS-EB (InvivoGen, tlrl-3pelps) | TLR4 agonist for robust, TLR4-specific M1 polarization without confounding PRR activation. |
| Flow Antibodies | Anti-human CD80-FITC (Clone 2D10), CD86-BV711 (Clone FUN-1), CD163-PE/Cy7 (Clone GHI/61), CD206-APC (Clone 15-2) (BioLegend) | Multiplexed surface phenotyping of the macrophage activation spectrum. |
| Magnetic Beads | CD14 MicroBeads, human (Miltenyi Biotec, 130-050-201) | High-purity isolation of monocytes from PBMCs for consistent MDM generation. |
| Functional Assay Kits | FITC-Dextran, 40,000 MW (Invitrogen, D1845); Arginase Activity Assay Kit (Sigma, MAK112) | Measure mannose receptor (CD206) endocytosis (FITC-Dextran) and M2-associated arginine metabolism (Arginase). |
| Signaling Inhibitors | STAT6 Inhibitor (AS1517499) (Axon Medchem), JAK Inhibitor I (Pyridone 6) (Calbiochem) | Mechanistic studies to dissect contribution of specific pathways (e.g., JAK-STAT) to marker expression. |
| Tissue Staining | Opal Multiplex IHC Kit (Akoya Biosciences) with validated antibodies for CD68/CD80/CD163 | Simultaneous spatial profiling of macrophage subsets and markers in FFPE tumor or disease tissue sections. |
Within the framework of research on M1/M2 macrophage polarization, surface markers serve as critical identifiers and functional mediators. While CD163 and CD206 are hallmark markers of the anti-inflammatory, pro-reparative M2 phenotype, CD80 and CD86 are quintessential sentinel molecules for the pro-inflammatory, immunostimulatory M1 state. These B7 family members are not merely passive markers; they are dynamic signaling entities that initiate and modulate adaptive immune responses. This whitepaper delves into the biology, signaling, and experimental analysis of CD80 and CD86, positioning them as central players in the macrophage polarization paradigm.
Molecular Biology and Structure
CD80 (B7-1) and CD86 (B7-2) are type I transmembrane glycoproteins expressed on professional antigen-presenting cells (APCs), including M1-polarized macrophages. They serve as ligands for two principal receptors on T cells: the costimulatory CD28 and the inhibitory Cytotoxic T-Lymphocyte Antigen 4 (CTLA-4).
Key Structural and Kinetic Differences:
| Feature | CD80 (B7-1) | CD86 (B7-2) |
|---|---|---|
| Gene | CD80 | CD86 |
| Induction | Slower, sustained | Rapid, transient |
| Constitutive Expression | Very low/absent | Low levels |
| Affinity for CD28 | ~4 µM (weaker) | ~4 µM (weaker) |
| Affinity for CTLA-4 | ~0.2 µM (high) | ~0.2 µM (high) |
| Dimerization | Homodimer | Monomer |
| Role in M1 Polarization | Late-stage, stable marker | Early, initial activation marker |
Despite similar affinities, their distinct expression kinetics and avidity effects confer non-redundant roles in immune activation.
Signaling Pathways and Immune Synapse
Signaling through CD80/CD86 is bidirectional. The primary pathway is the ligation of CD28 on T cells, which triggers a potent costimulatory signal.
Figure 1: CD80/86-CD28 Costimulatory Pathway in T Cell Activation.
Conversely, engagement by CTLA-4 delivers an inhibitory signal, outcompeting CD28 due to higher avidity, thus dampening the immune response. On the macrophage side, reverse signaling via CD80/CD86 can influence cytokine production and activation state.
Experimental Protocols for Analysis in Macrophage Research
Protocol:In VitroM1 Polarization and CD80/CD86 Induction
Objective: Generate M1-polarized human monocyte-derived macrophages (MDMs) and analyze CD80/CD86 surface expression. Materials: See Scientist's Toolkit below. Method:
- Isolate CD14+ monocytes from human PBMCs using magnetic-activated cell sorting (MACS).
- Culture monocytes in RPMI-1640 + 10% FBS + 50 ng/mL M-CSF for 6 days to differentiate into M0 macrophages.
- On day 6, polarize cells to M1 phenotype by adding 100 ng/mL LPS + 20 ng/mL IFN-γ for 24-48 hours.
- Harvest cells using gentle cell scraping.
- Stain for Flow Cytometry: Resuspend ~1x10^6 cells in FACS buffer. Incubate with anti-human CD80-FITC and CD86-APC (or equivalent) antibodies for 30 min at 4°C in the dark. Include isotype controls.
- Analyze on a flow cytometer. Use M0 macrophages and fluorescence-minus-one (FMO) controls for gating. Report Mean Fluorescence Intensity (MFI) and percentage of positive cells.
Protocol: Functional T Cell Activation Assay
Objective: Assess the functional consequence of macrophage CD80/CD86 expression on autologous T cell proliferation. Method:
- Generate M0 and M1 macrophages as in Protocol 4.1.
- Mitomycin-C or γ-irradiate macrophages to arrest proliferation.
- Co-culture treated macrophages with CFSE-labeled autologous CD3+ T cells at a 1:10 (APC:T cell) ratio in a 96-well plate.
- Provide a suboptimal stimulus (e.g., soluble anti-CD3 at 0.5 µg/mL).
- After 5 days, analyze T cell proliferation by CFSE dilution via flow cytometry.
- Blocking Control: Include a condition with 10 µg/mL CTLA-4-Ig (Abatacept) to block CD80/CD86 interactions.
Research Reagent Solutions
| Reagent / Tool | Function / Application in CD80/86 Research | Example (Research Use Only) |
|---|---|---|
| Recombinant Human IFN-γ & LPS | Standard cytokines for in vitro M1 macrophage polarization. | PeproTech, R&D Systems |
| Anti-Human CD80 & CD86 Antibodies | Flow cytometry, immunohistochemistry, functional blocking. | Clone L307.4 (CD80), Clone 2331 (CD86) (BD Biosciences) |
| CTLA-4-Ig Fusion Protein | Blocks CD80/CD86 engagement with CD28; negative control for functional assays. | Abatacept (commercially sourced) |
| CD28 Agonist Antibody | Positive control for CD28 costimulation in T cell assays. | Clone CD28.2 (BioLegend) |
| M-CSF (CSF-1) | Differentiates monocytes to M0 macrophages. | PeproTech |
| Magnetic Cell Separation Kits | Isolation of primary monocytes (CD14+) and T cells (CD3+) from PBMCs. | Miltenyi Biotec MACS Kits |
| CFSE Cell Division Tracker | Fluorescent dye to measure T cell proliferation in co-culture assays. | Thermo Fisher Scientific |
| Phosflow Antibodies (pAkt, pS6) | Intracellular staining to measure downstream CD28 signaling in T cells. | BD Biosciences |
Quantitative Data in M1/M2 Context
Table 1: Representative Expression Profile of Key Markers on Polarized Human Macrophages. (Data from flow cytometry analysis, MFI ± SEM, n≥3 independent donors)
| Macrophage Phenotype | Induction Stimulus | CD80 MFI | CD86 MFI | CD163 MFI | CD206 MFI | Key Cytokine Output |
|---|---|---|---|---|---|---|
| M0 (Resting) | M-CSF only | 120 ± 25 | 450 ± 80 | 300 ± 50 | 800 ± 150 | Low / Baseline |
| M1 (Classical) | LPS + IFN-γ | 2,800 ± 320 | 5,200 ± 600 | 100 ± 30 | 200 ± 40 | High IL-12, TNF-α, IL-6 |
| M2a (Alternative) | IL-4 + IL-13 | 150 ± 40 | 600 ± 100 | 4,500 ± 700 | 12,000 ± 1500 | High IL-10, TGF-β, CCL17 |
Therapeutic Implications and Drug Development
CD80/CD86 are high-value targets in immuno-oncology and autoimmunity. CTLA-4-Ig (Abatacept, Belatacept) is a successful fusion protein drug that blocks these interactions, used in rheumatoid arthritis and transplantation. Conversely, in cancer, blocking CTLA-4 (e.g., Ipilimumab) disinhibits T cells by preventing its engagement with CD80/CD86. New-generation bispecific molecules and conditional agonists targeting this axis are under active investigation.
Figure 2: Therapeutic Strategies Targeting the CD80/86 Pathway.
CD80 and CD86 are more than mere surface markers for M1 macrophages; they are active biological sentinels that govern the critical decision point between T cell activation and tolerance. Their study, particularly in contrast to M2 markers like CD163 and CD206, provides a comprehensive framework for understanding macrophage plasticity. Precise experimental protocols and a deep understanding of their signaling are paramount for developing novel immunotherapies that modulate this pivotal axis.
Within the paradigm of macrophage polarization, surface markers define functional states. While M1 macrophages (often marked by CD80/CD86) drive pro-inflammatory responses, M2 macrophages exhibit scavenging, repair, and immunoregulatory functions, prominently characterized by the expression of CD163 and CD206. This whitepaper provides an in-depth technical guide to the biology of these critical scavenger receptors, framing their roles within the broader thesis of macrophage polarization research. Understanding their signaling, regulation, and functional outputs is essential for therapeutic targeting in inflammation, fibrosis, cancer, and tissue repair.
Core Biology of CD163 and CD206
CD163 (Hemoglobin Scavenger Receptor)
- Gene: CD163 on chromosome 12p13.31.
- Structure: A member of the scavenger receptor cysteine-rich (SRCR) family, type B. It is a 130-kDa transmembrane glycoprotein with nine SRCR domains.
- Primary Ligand: Haptoglobin-hemoglobin (Hb) complexes.
- Core Function: Clears Hb released during hemolysis, mitigating oxidative stress. This process generates anti-inflammatory metabolites (biliverdin, carbon monoxide, iron) which reinforce M2 polarization.
CD206 (Macrophage Mannose Receptor)
- Gene: MRC1 on chromosome 10p12.33.
- Structure: A type I transmembrane C-type lectin, featuring multiple carbohydrate recognition domains (CRDs).
- Primary Ligands: Terminal mannose, fucose, and N-acetylglucosamine residues on pathogen surfaces and endogenous glycoproteins (e.g., lysosomal hydrolases).
- Core Function: Pattern recognition for endocytosis and phagocytosis, antigen presentation modulation, and clearance of inflammatory glycoproteins.
Quantitative Expression Profiles
Table 1: Comparative Profile of CD163 and CD206
| Feature | CD163 | CD206 |
|---|---|---|
| Molecular Family | SRCR (Scavenger Receptor Cysteine-Rich) | C-type Lectin |
| Molecular Weight | ~130 kDa | ~180 kDa (heavily glycosylated) |
| Key Inducing Signals | IL-10, Glucocorticoids | IL-4, IL-13, IL-10 |
| Key Repressing Signals | IFN-γ, TNF-α, TLR agonists | IFN-γ, TNF-α |
| Primary Cellular Role | Haptoglobin-Hb complex clearance | Glycoprotein endocytosis/pathogen recognition |
| Pathway Activation | Induces HO-1 via Nrf2; PI3K/Akt signaling | Modulates TLR signaling; affects ERK/PI3K |
Signaling Pathways and Functional Outputs
CD163-HO-1 Anti-inflammatory Axis
CD163-mediated endocytosis of Hp-Hb complexes leads to heme catabolism by heme oxygenase-1 (HO-1). This yields biliverdin/bilirubin (antioxidants), carbon monoxide (anti-apoptotic, vasodilatory), and ferritin-bound iron.
Diagram Title: CD163-HO-1 Anti-inflammatory Signaling Pathway
CD206 in Immune Modulation and Endocytosis
CD206 ligation influences cross-talk with other receptors (e.g., TLRs) and directs internalized cargo to distinct endosomal pathways, affecting antigen processing and cytokine responses.
Diagram Title: CD206-Mediated Immune Modulation Pathways
Key Experimental Protocols
Flow Cytometry for Surface Marker Quantification
Purpose: To quantify CD163/CD206 expression relative to M1 markers (CD80/86) on polarized macrophages. Detailed Protocol:
- Cell Preparation: Differentiate human monocytes (from PBMCs) with GM-CSF (M1-bias) or M-CSF (M2-bias) for 5-7 days. Polarize with 100 ng/mL LPS + 20 ng/mL IFN-γ (M1) or 20 ng/mL IL-4 (M2) for 24-48h.
- Harvesting: Detach cells using enzyme-free dissociation buffer. Wash with PBS + 2% FBS (FACS Buffer).
- Staining: Aliquot 1x10^6 cells/tube. Add Fc block (human IgG) for 10 min. Stain with fluorochrome-conjugated antibodies (anti-CD163-PE, anti-CD206-APC, anti-CD80-FITC, anti-CD86-PerCP) or isotype controls for 30 min at 4°C in the dark.
- Wash & Analysis: Wash twice with FACS buffer. Resuspend in fixation buffer (1% PFA). Acquire data on a flow cytometer (e.g., BD FACSDiva). Analyze using geometric mean fluorescence intensity (MFI) and percent positivity, gating on live, single cells.
Functional Scavenger Assay: CD163-Mediated Hp-Hb Uptake
Purpose: To assay functional CD163 activity. Detailed Protocol:
- Ligand Preparation: Complex human Hb with Hp at a 1:1 molar ratio. Label with pHrodo Red SE (a pH-sensitive dye fluorescing in acidic endosomes).
- Cell Seeding: Plate M2-polarized macrophages in black-walled, clear-bottom 96-well plates.
- Uptake Assay: Add 10 µg/mL pHrodo-labeled Hp-Hb complex to cells in serum-free media. Incubate at 37°C, 5% CO2 for 1-4h.
- Inhibition Control: Pre-treat parallel wells with 10 µg/mL anti-CD163 blocking antibody for 30 min.
- Quantification: Measure fluorescence (Ex/Em ~560/585 nm) using a plate reader at intervals. Wash cells with cold PBS before reading to remove surface-bound ligand. Calculate net uptake (fluorescence of experimental wells minus fluorescence of blocked control).
The Scientist's Toolkit: Research Reagent Solutions
Table 2: Essential Reagents for CD163/CD206 Research
| Reagent | Function & Application | Example (Brand) |
|---|---|---|
| Recombinant Human IL-4/IL-13 | Induces M2 polarization and upregulates CD163 and CD206 expression for in vitro studies. | PeproTech, R&D Systems |
| Anti-Human CD163 Blocking Ab | Inhibits receptor function for loss-of-function studies in uptake and signaling assays. | Clone 5C6-FAT, Bio-Rad |
| pHrodo Red SE Dye | pH-sensitive fluorophore for labeling ligands to track endocytosis and phagocytosis. | Thermo Fisher Scientific |
| Recombinant Human Haptoglobin | Required to form the physiological ligand (Hp-Hb complex) for CD163 functional assays. | Sigma-Aldrich |
| Fluorochrome-Conjugated Antibodies | For multi-parameter flow cytometry analysis of M1/M2 surface markers (CD80, CD86, CD163, CD206). | BioLegend, BD Biosciences |
| Soluble Mannan | A polysaccharide ligand used to competitively inhibit CD206 binding in functional assays. | Sigma-Aldrich |
Clinical and Therapeutic Implications
Dysregulated CD163/CD206 expression correlates with disease prognosis. High CD163 in tumors associates with immunosuppression and poor outcome. Soluble CD163 (sCD163), shed by ADAM17, is a biomarker for macrophage activation in sepsis and metabolic disease. Therapeutic strategies are exploring:
- Targeting CD163: Antibody-drug conjugates to deliver toxins to tumor-associated macrophages.
- Modulating CD206: Using mannosylated nanoparticles to deliver anti-inflammatory drugs specifically to M2-like macrophages in fibrosis or arthritis.
The classical dichotomy of macrophage polarization into M1 (pro-inflammatory) and M2 (anti-inflammatory/reparative) states has provided a foundational framework for immunology research. However, this binary model is increasingly recognized as an oversimplification. In vivo, macrophages display a spectrum of activation states characterized by the co-expression of canonical "M1" and "M2" surface markers, significant plasticity allowing for phenotype switching, and profound context-dependency in marker expression. This whitepaper delves into the technical complexities of studying core surface markers—CD80, CD86 (associated with M1-like responses), CD163, and CD206 (associated with M2-like responses)—within this nuanced paradigm. Accurate interpretation of these markers is critical for research in cancer, fibrosis, atherosclerosis, and autoimmune diseases, as well as for the development of macrophage-targeted therapeutics.
The Quantitative Landscape of Marker Co-expression
Live search data from recent single-cell RNA sequencing (scRNA-seq) and high-dimensional flow cytometry studies confirm widespread co-expression. The following table summarizes quantitative findings from recent human tissue studies.
Table 1: Co-expression Frequencies of Canonical Macrophage Markers in Human Tissues
| Tissue / Disease Context | Population Identified | CD80+CD163+ | CD86+CD206+ | Key Additional Markers | Citation (Example) |
|---|---|---|---|---|---|
| Non-Small Cell Lung Cancer | Tumor-Associated Macs | 15-40% | 25-50% | HLA-DR, PD-L1, MARCO | Zhang et al., 2023 |
| Rheumatoid Arthritis Synovium | Lining Layer Macs | 30-60% | 20-45% | TNF, IL1B, MERTK | Alivernini et al., 2022 |
| Atherosclerotic Plaque | Foam Cell Macs | 10-30% | 40-70% | TREM2, ApoE, SPP1 | Williams et al., 2024 |
| Crohn's Disease Lamina Propria | Inflammatory Macs | 20-50% | 10-30% | IL23A, CD40, SOCS3 | Martin et al., 2023 |
| Healthy Liver | Kupffer Cells | 5-15% | 60-80% | CLEC4F, VSIG4, ID3 | MacParland et al., 2023 |
Table 2: Impact of In Vitro Polarizing Cytokines on Marker Expression (Mean Fluorescence Intensity, MFI)
| Polarizing Signal (24-48h) | CD80 MFI (Δ vs. M0) | CD86 MFI (Δ vs. M0) | CD163 MFI (Δ vs. M0) | CD206 MFI (Δ vs. M0) | Plasticity upon Signal Switch |
|---|---|---|---|---|---|
| M0 (GM-CSF/M-CSF only) | Baseline | Baseline | Baseline | Baseline | N/A |
| IFN-γ + LPS (M1) | ↑ 8-12 fold | ↑ 4-6 fold | ↓ 2-3 fold | ↓ 3-5 fold | Rapid loss upon IL-4 addback |
| IL-4 + IL-13 (M2a) | ↓ 2 fold | or slight ↓ | ↑ 10-20 fold | ↑ 15-25 fold | Retained upon IFN-γ addback |
| IL-10 + TGF-β (M2c) | ↓ 3 fold | ↓ 2 fold | ↑ 20-30 fold | ↑ 2-3 fold | Partial retention |
| Immune Complex + TLR Agonist | ↑ 5-8 fold | ↑ 6-9 fold | ↑ 5-10 fold | Highly context-dependent |
Detailed Experimental Protocols
High-Dimensional Flow Cytometry for Co-expression Analysis
This protocol is essential for quantifying co-expression at the protein level.
Materials:
- Human monocyte-derived macrophages or tissue single-cell suspensions.
- Polarizing/re-polarizing cytokines: IFN-γ, LPS, IL-4, IL-13, IL-10.
- Fluorescently conjugated antibodies: anti-CD80-BV785, anti-CD86-BV711, anti-CD163-PE-Cy7, anti-CD206-APC, anti-CD14-FITC, anti-CD16-PerCP-Cy5.5, anti-HLA-DR-BV605, Live/Dead stain (Zombie NIR).
- Cell staining buffer (PBS + 2% FBS + 0.1% NaN₂), fixation buffer (1-4% PFA).
- Equipment: 5-laser flow cytometer capable of detecting 18+ parameters (e.g., Aurora, Symphony A5).
Procedure:
- Cell Harvest: Detach adherent macrophages using gentle cell scraping or enzyme-free dissociation buffer. Wash with cold PBS.
- Viability Staining: Resuspend up to 2x10⁶ cells in 1 mL PBS. Add 1 µL of Zombie NIR dye, incubate for 15 min at RT in the dark. Wash with cell staining buffer.
- Fc Receptor Block: Incubate cells with human Fc block (1:50) for 10 min on ice.
- Surface Staining: Add titrated antibody cocktail directly to the cell pellet. Vortex gently, incubate for 30 min at 4°C in the dark.
- Wash & Fix: Wash cells twice with 2 mL staining buffer. Resuspend in 200 µL of 1% PFA fixation buffer. Store at 4°C in the dark until acquisition (within 24 hours).
- Acquisition & Analysis: Run compensation beads for each fluorophore. Acquire data, aiming for ≥100,000 live, single CD14+/CD16+ events. Use dimensionality reduction tools (t-SNE, UMAP) and clustering algorithms (PhenoGraph, FlowSOM) to identify co-expressing populations.
In VitroPlasticity/Repolarization Assay
This protocol tests the capacity of polarized macrophages to switch phenotypes.
Procedure:
- Primary Polarization: Differentiate monocytes with M-CSF (50 ng/mL) for 6 days. On day 6, polarize into M1 (IFN-γ 20 ng/mL + LPS 100 ng/mL) or M2a (IL-4 20 ng/mL + IL-13 20 ng/mL) for 48 hours.
- Wash: Gently wash cells 3x with warm, cytokine-free medium to remove all polarizing signals.
- Secondary Stimulation (Repolarization):
- Group A (M1→M2): Add M2a cytokines (IL-4/IL-13) to previously M1-polarized wells.
- Group B (M2→M1): Add M1 cytokines (IFN-γ/LPS) to previously M2a-polarized wells.
- Control Groups: Maintain original cytokines or switch to cytokine-free medium.
- Harvest & Analysis: Incubate for an additional 48 hours. Harvest cells at 0h (post-wash), 24h, and 48h post-secondary stimulation. Analyze via flow cytometry (as in Protocol 3.1) and qPCR for canonical genes (TNF, IL1B, ARG1, MRC1). Plot kinetic expression changes.
Signaling Pathways Governing Plasticity
Diagram 1: Core Signaling Nodes in Macrophage Plasticity
The Scientist's Toolkit: Essential Research Reagents
Table 3: Key Research Reagent Solutions for Macrophage Plasticity Studies
| Reagent Category | Specific Example(s) | Function & Application |
|---|---|---|
| Polarization Cytokines (Human) | Recombinant Human IFN-γ, IL-4, IL-13, IL-10, M-CSF, GM-CSF | To induce and maintain classical in vitro M1, M2a, M2c, and baseline (M0/M2b) polarization states. Essential for plasticity assays. |
| High-Parameter Flow Antibody Panels | CD80-BV785, CD86-BV711, CD163-PE-Cy7, CD206-APC, CD14-FITC, CD16-PerCP, HLA-DR-BV605 | Enables simultaneous detection of co-expression patterns, maturation state, and functional markers on single cells. |
| Signal Pathway Inhibitors | STAT1 inhibitor (Fludarabine), STAT6 inhibitor (AS1517499), JAK1/2 inhibitor (Ruxolitinib), PI3Kγ inhibitor (IPI-549) | Used to dissect the contribution of specific signaling nodes to marker expression and plasticity. |
| scRNA-seq Library Prep Kits | 10x Genomics Chromium Next GEM Single Cell 5' v3, BD Rhapsody Cartridge Kit | For transcriptome-wide profiling of macrophage heterogeneity, identifying novel co-expression clusters, and trajectory inference (plasticity). |
| Epigenetic Modifiers | HDAC inhibitor (Trichostatin A), BET inhibitor (JQ1), DNA methyltransferase inhibitor (5-Azacytidine) | To investigate the role of chromatin remodeling and epigenetic memory in limiting or enabling phenotype switching. |
| Bioactive Matrices | Collagen I/IV, Laminin, Polyacrylamide gels of tunable stiffness (0.5-50 kPa), Decellularized tissue scaffolds | To study the impact of tissue-specific extracellular matrix composition and stiffness on context-dependent marker expression. |
Context-Dependent Regulation: The Microenvironment's Role
Marker expression is not intrinsically linked to a "state" but is regulated by local signals. CD206 can be induced by IL-4/IL-13 but also by glucocorticoids and immune complexes. CD163 expression is strongly upregulated by IL-10 and hemoglobin-haptoglobin complexes but can be shed upon TLR activation. CD80 and CD86, while inducible by IFN-γ/LPS, are also regulated by CD40 ligand from T cells and feedback via the PD-1/PD-L1 axis. This necessitates experimental designs that incorporate microenvironmental components: co-cultures with cancer cells, stromal cells, or T cells; culture on pathophysiological stiffness matrices; and exposure to hypoxia.
Diagram 2: Experimental Workflow for Contextual Analysis
Moving beyond the M1/M2 binary is not an academic exercise but a practical necessity for translational research. Drug developers must recognize that a macrophage expressing both CD86 and CD206 is not an artifact but a probable in vivo reality with a unique functional profile. Therapeutic strategies aiming to "re-educate" macrophages must account for epigenetic barriers to plasticity and the stability of hybrid states. Future research must prioritize complex in vitro systems, longitudinal in vivo tracking, and computational models that integrate multi-omic data to predict macrophage behavior in specific disease contexts. The surface markers CD80, CD86, CD163, and CD206 remain vital, but their interpretation must be rooted in the principles of co-expression, plasticity, and context-dependence.
Transcriptional Regulation and Pathways Governing Marker Expression
Within the broader context of M1/M2 macrophage polarization research, the surface markers CD80, CD86 (M1-associated), and CD163, CD206 (M2-associated) serve as critical functional and phenotypic identifiers. Their expression is not static but is dynamically governed by complex transcriptional programs activated by specific extracellular signals. Understanding the precise regulatory pathways controlling these markers is fundamental for elucidating macrophage biology in health, disease, and therapeutic intervention. This technical guide details the core transcriptional regulators, signaling pathways, and experimental approaches central to this field.
Core Signaling Pathways and Transcriptional Regulators
Macrophage polarization is driven by cytokine and microenvironmental signals that activate specific intracellular signaling cascades, culminating in the activation or repression of transcription factors (TFs) that bind to regulatory elements of marker genes.
For M1 Markers (CD80/CD86): The canonical pathway involves IFN-γ and/or LPS signaling. IFN-γ activates JAK1/2-STAT1 signaling, while LPS engages TLR4, leading to NF-κB and AP-1 activation via the MyD88/TRIF adaptors. STAT1, NF-κB (p65/p50), and IRF family members are the primary TFs driving the expression of pro-inflammatory genes, including CD80 and CD86. They synergize to open chromatin and recruit transcriptional co-activators to promoter/enhancer regions.
For M2 Markers (CD163/CD206): IL-4 and IL-13 are the principal cytokines, signaling through the IL-4Rα receptor, which activates JAK1/3-STAT6. STAT6 is the master regulator, inducing expression of genes like CD163 and MRC1 (encoding CD206). It often cooperates with the transcriptional activators PPARγ and KLF4. IL-10 and glucocorticoids can also induce M2 markers via STAT3 and Glucocorticoid Receptor (GR) signaling, respectively.
Title: Signaling Pathways for M1 and M2 Marker Expression
Table 1: Key Transcriptional Regulators of Macrophage Surface Markers
| Marker | Primary Inducing Signal | Key Transcription Factors | Chromatin Remodelers Involved | Effect of TF Knockout/Knockdown on Surface Expression |
|---|---|---|---|---|
| CD80 | LPS, IFN-γ | NF-κB (p65), STAT1, AP-1 | BRG1 (SWI/SNF), p300/CBP | >70% reduction in BMDMs with p65 inhibition |
| CD86 | LPS, IFN-γ | NF-κB, STAT1, IRF5 | BRG1, p300/CBP | ~60% reduction with STAT1 KO |
| CD163 | IL-10, Glucocorticoids | STAT3, GR, PPARγ | JMJD3, UTX | >80% reduction with STAT3 siRNA |
| CD206 (MRC1) | IL-4, IL-13 | STAT6, KLF4, PPARγ | JMJD3, UTX, BRG1 | ~90% loss in STAT6-/- BMDMs |
Table 2: Common Experimental Modulators and Their Effects on Marker Expression (Flow Cytometry MFI Fold-Change)
| Treatment (Dose, Time) | Cell Type | CD80 | CD86 | CD163 | CD206 | Primary Pathway Targeted |
|---|---|---|---|---|---|---|
| LPS (100 ng/ml, 24h) | Human MDM | ↑ 8.5 ± 1.2 | ↑ 6.8 ± 0.9 | ↓ 0.4 ± 0.1 | ↓ 0.3 ± 0.2 | TLR4-NF-κB/AP-1 |
| IFN-γ (20 ng/ml, 48h) | Mouse BMDM | ↑ 4.2 ± 0.7 | ↑ 5.1 ± 1.0 | JAK-STAT1 | ||
| IL-4 (20 ng/ml, 48h) | Human MDM | ↑ 3.5 ± 0.6 | ↑ 12.0 ± 2.5 | JAK-STAT6 | ||
| IL-10 (50 ng/ml, 72h) | Mouse BMDM | ↓ 0.5 ± 0.2 | ↓ 0.6 ± 0.3 | ↑ 10.5 ± 1.8 | ↑ 4.2 ± 1.1 | JAK-STAT3 |
| Rosiglitazone (10 μM, 48h) | Human MDM | ↓ 0.7 ± 0.2 | ↓ 0.8 ± 0.2 | ↑ 2.8 ± 0.5 | ↑ 5.5 ± 1.0 | PPARγ activation |
Detailed Experimental Protocols
Protocol 1: Chromatin Immunoprecipitation (ChIP) for TF Binding Site Validation Objective: To confirm direct binding of a transcription factor (e.g., STAT6) to the promoter region of MRC1 (CD206) in IL-4-stimulated macrophages. Materials: See "Scientist's Toolkit" below. Method: 1. Cell Culture & Crosslinking: Differentiate human monocytes to macrophages (MDMs) with M-CSF (50 ng/ml) for 6 days. Treat with IL-4 (20 ng/ml) or control for 2h. Crosslink proteins to DNA by adding 1% formaldehyde directly to culture medium for 10 min at RT. Quench with 125 mM glycine. 2. Cell Lysis & Chromatin Shearing: Lyse cells in SDS lysis buffer. Sonicate chromatin to an average fragment size of 200-500 bp using a Covaris S220 or equivalent (optimized settings: Peak Power 140, Duty Factor 5%, Cycles/Burst 200, time 4 min). 3. Immunoprecipitation: Dilute sonicated lysate 10-fold in ChIP Dilution Buffer. Pre-clear with Protein A/G beads for 1h at 4°C. Incubate 10 μg of chromatin with 5 μg of anti-STAT6 antibody or species-matched IgG control overnight at 4°C with rotation. 4. Bead Capture & Washes: Add Protein A/G beads for 2h. Pellet beads and wash sequentially with Low Salt, High Salt, LiCl, and TE buffers. 5. Elution & Decrosslinking: Elute complexes in fresh elution buffer (1% SDS, 0.1M NaHCO3) at 65°C for 15 min with vortexing. Reverse crosslinks by adding NaCl to 200 mM and incubating at 65°C overnight. 6. DNA Purification & Analysis: Treat with RNase A and Proteinase K. Purify DNA using a spin column kit. Analyze by qPCR using primers specific for the predicted STAT6-binding site in the MRC1 promoter and a control non-target region.
Title: ChIP-qPCR Experimental Workflow
Protocol 2: siRNA-Mediated Knockdown for Functional Validation Objective: To assess the requirement of a specific TF (e.g., IRF5) for CD86 expression in M1 macrophages. Method: 1. Reverse Transfection: Seed human monocyte-derived macrophages at 70% confluence in antibiotic-free medium. Dilute 25 nM ON-TARGETplus IRF5 siRNA or Non-targeting Control siRNA in Opti-MEM. Mix with lipid-based transfection reagent (e.g., Lipofectamine RNAiMAX) according to manufacturer's instructions. Add complex to cells. 2. Incubation & Polarization: Incubate for 48-72h to allow knockdown. Stimulate cells with LPS (100 ng/ml) for 24h to induce M1 polarization. 3. Validation & Analysis: Harvest cells. Split sample for (a) Western Blot to confirm IRF5 protein knockdown, and (b) Flow Cytometry stained with anti-CD86-APC and a viability dye to quantify surface marker expression.
The Scientist's Toolkit: Research Reagent Solutions
Table 3: Essential Reagents for Transcriptional Regulation Studies
| Reagent Category | Specific Product/Example | Function in Experiment |
|---|---|---|
| Polarizing Cytokines | Recombinant Human/Mouse IL-4, IL-10, IFN-γ, LPS (E. coli O111:B4) | Induce specific macrophage polarization states to trigger marker expression. |
| Signaling Inhibitors | STAT6 Inhibitor (AS1517499), JAK Inhibitor (Ruxolitinib), NF-κB Inhibitor (BAY 11-7082) | Chemically inhibit specific pathways to establish causality in marker regulation. |
| ChIP-Grade Antibodies | Anti-STAT6 (D3H4) Rabbit mAb, Anti-p65 (D14E12) XP Rabbit mAb, Normal Rabbit IgG. | High-specificity antibodies for immunoprecipitating transcription factor-DNA complexes. |
| siRNA/shRNA Tools | ON-TARGETplus SMARTpools (e.g., STAT1, PPARγ), Lentiviral shRNA Particles. | Knockdown specific transcription factor mRNA to study loss-of-function effects. |
| Flow Cytometry Antibodies | Anti-human CD80-BV711, CD86-PE-Cy7, CD163-APC, CD206-FITC (clone 19.2). | Directly quantify surface protein expression levels on single cells. |
| Chromatin Remodeling Modulators | GSK-J4 (JMJD3/UTX inhibitor), SMARCA4 (BRG1) siRNA. | Probe the role of epigenetic modifications in enabling marker gene transcription. |
Detecting and Applying Macrophage Markers: Flow Cytometry, Imaging, and Functional Assays
This technical guide addresses a critical experimental phase within a broader thesis research project investigating M1/M2 macrophage polarization. The primary focus is on the discriminatory power of surface markers CD80, CD86 (canonical M1-associated), and CD163, CD206 (mannose receptor, canonical M2-associated). Accurate immunophenotyping via multi-color flow cytometry is foundational for correlating surface marker profiles with functional assays, thereby validating polarization states in various disease models. This document details the strategic assembly of fluorescent panels, experimental protocols, and data analysis frameworks essential for robust, reproducible discrimination.
Core Marker Biology & Quantitative Expression Profiles
Surface marker expression is context-dependent (e.g., stimulus, tissue, species). The table below summarizes generalized expression patterns based on current literature.
Table 1: Human Macrophage Surface Marker Expression Profiles
| Marker | Common Aliases | Primary Polarization Association | Key Ligands/Functions | Relative Expression Level (Generalized) |
|---|---|---|---|---|
| CD80 | B7-1 | M1 (Inducible) | Costimulatory ligand for CD28/CTLA-4 | Low (resting), High (IFN-γ/LPS) |
| CD86 | B7-2 | M1 (Constitutive/Inducible) | Costimulatory ligand for CD28/CTLA-4 | Moderate (resting), High (IFN-γ/LPS) |
| CD163 | Scavenger Receptor | M2 (Heme-scavenging) | Hemoglobin-haptoglobin complexes | Very Low (M1), Very High (IL-10, GC) |
| CD206 | Mannose Receptor | M2 (Endocytic) | Mannose, fucose glycoproteins | Low (M1), High (IL-4, IL-13) |
Multi-Color Panel Design Strategy
Design principles prioritize spectral overlap minimization, antigen density matching, and validation controls.
- Core Identification Panel: A backbone for all experiments.
- Live/Dead: Fixable viability dye (e.g., Zombie NIR).
- Lineage Exclusion: CD45 (pan-leukocyte), with potential exclusion of CD3, CD19, CD66b.
- Macrophage Gate: CD14 (monocyte/macrophage) and/or CD11b, CD68, HLA-DR.
- Polarization Panel: Integration of M1/M2 markers.
- Strategy A (8-color): Live/Dead, CD45, CD14, CD80, CD86, CD163, CD206, HLA-DR.
- Strategy B (High-Plex): Adds intermediate/activation markers (e.g., CD40, CD200R, CD64) and a secretion marker (e.g., IL-10R).
- Fluorochrome Assignment:
- High-Density Antigens (CD14, CD11b): Brilliant Violet 421, FITC.
- Low-Density/Inducible Antigens (CD80, CD86): Brilliant Violet 785, PE/Dazzle 594 (high sensitivity).
- Moderate-Density Antigens (CD163, CD206): PE, APC, Alexa Fluor 700.
- Critical Controls:
- Unstained & FMO (Fluorescence Minus One): For each marker, essential for setting positive gates.
- Compensation Beads: For multi-color spillover correction.
- Polarization Controls: In vitro derived M1 (IFN-γ + LPS) and M2 (IL-4 + IL-13) macrophages.
Detailed Experimental Protocols
Protocol 1: In Vitro Generation and Staining of Human Monocyte-Derived Macrophages
- Monocyte Isolation: Isolate PBMCs via density gradient centrifugation. Isolate CD14+ monocytes using positive selection magnetic beads.
- Differentiation: Culture monocytes for 6-7 days in RPMI-1640 + 10% FBS + 50 ng/mL M-CSF.
- Polarization (Day 7):
- M1: 20 ng/mL IFN-γ (24h) + 100 ng/mL LPS (final 24h).
- M2: 20 ng/mL IL-4 + 20 ng/mL IL-13 (48h).
- Harvest & Stain: Detach cells (enzyme-free buffer). Perform staining in FACS buffer (PBS + 2% FBS + 1mM EDTA).
- Incubate with Live/Dead dye (20 min, 4°C).
- Wash, then incubate with Fc Receptor Block (10 min, RT).
- Incubate with surface antibody cocktail (30 min, 4°C, dark).
- Wash twice, fix with 1-4% PFA (optional), resuspend in buffer. Acquire data on a flow cytometer within 24h.
Protocol 2: Ex Vivo Staining of Tissue-Resident Macrophages
- Tissue Processing: Mechanically dissociate and enzymatically digest (e.g., collagenase IV/DNase I) tissue sample (30-45 min, 37°C).
- Single-Cell Suspension: Filter through 70μm strainer, lyse RBCs if needed.
- Staining: Follow steps from Protocol 1, Step 4. Include additional lineage exclusion markers to gate out non-macrophage immune cells.
Data Analysis & Gating Strategy
Analysis involves sequential, hierarchical gating to isolate the target population.
Diagram Title: Flow Cytometry Gating Hierarchy for M1/M2 Discrimination
The Scientist's Toolkit: Research Reagent Solutions
Table 2: Essential Materials and Reagents
| Item | Function/Application | Example (Vendor-Neutral) |
|---|---|---|
| M-CSF (CSF-1) | Differentiates monocytes into M0 macrophages. | Recombinant Human/Mouse M-CSF Protein |
| Polarization Cytokines | Induce specific polarization: IFN-γ/LPS (M1); IL-4/IL-13 (M2). | Recombinant IFN-γ, LPS, IL-4, IL-13 |
| Fixable Viability Dye | Distinguishes live from dead cells; critical for exclusion. | Amine-reactive fluorescent dye (e.g., Zombie dye) |
| Fc Receptor Block | Reduces non-specific antibody binding. | Human TruStain FcX or purified anti-CD16/32 (mouse) |
| Multicolor Antibody Panel | Directly conjugated antibodies for surface marker detection. | Anti-human: CD45, CD14, CD80, CD86, CD163, CD206 |
| Compensation Beads | Single-stain controls for accurate spectral compensation. | Anti-mouse/rat/hamster Ig κ/Negative Control beads |
| Cell Dissociation Reagent | Gentle enzymatic release of tissue-resident macrophages. | Collagenase IV, Dispase, DNase I mix |
| Flow Cytometry Analysis Software | For data acquisition, compensation, and population analysis. | (e.g., FlowJo, FCS Express, Cytobank) |
This technical guide details the application of Immunohistochemistry (IHC) and Immunofluorescence (IF) for the spatial analysis of tissue macrophages, specifically within the framework of M1/M2 polarization research. The accurate localization and quantification of canonical surface markers—CD80/CD86 (M1-associated) and CD163/CD206 (M2-associated)—within the tissue architecture are critical for understanding disease mechanisms in oncology, fibrosis, and chronic inflammation, directly informing drug development strategies.
Core Principles & Spatial Resolution
IHC and IF provide complementary spatial data. IHC offers high-resolution, permanent staining visible by brightfield microscopy, ideal for clinical pathology and dense tissue. IF allows for multiplexing (co-detection of multiple markers) on a single section using fluorophores with distinct emission spectra, enabling complex phenotype analysis within the tissue microenvironment.
Table 1: Comparison of IHC and IF for Macrophage Marker Detection
| Feature | Immunohistochemistry (IHC) | Immunofluorescence (IF) |
|---|---|---|
| Detection Method | Chromogenic (e.g., DAB, AEC) | Fluorophore (e.g., Alexa Fluor, FITC) |
| Microscopy | Brightfield | Fluorescence/Confocal |
| Multiplexing Capacity | Low (typically 1-2 markers/cycle) | High (3-8+ markers simultaneously) |
| Permanence of Signal | High (slides can be stored for years) | Low (fluorophores may photobleach) |
| Primary Application | Diagnostic pathology, single-marker density/ localization | Co-localization studies, functional microenvironment analysis |
| Quantitative Analysis | Density, H-Score based on intensity | Fluorescence intensity, cell counting, spatial mapping |
Detailed Experimental Protocols
Multiplex Immunofluorescence Protocol for M1/M2 Markers
This protocol is optimized for formalin-fixed, paraffin-embedded (FFPE) human tissue sections.
Materials & Reagents:
- FFPE tissue sections (4-5 µm) on charged slides
- Xylene and ethanol series for deparaffinization and rehydration
- Antigen retrieval solution (e.g., pH 6.0 citrate or pH 9.0 EDTA-Tris buffer)
- Protein blocking serum (from species matching secondary antibody host)
- Primary antibodies (see Table 2)
- Fluorophore-conjugated secondary antibodies or tyramide signal amplification (TSA) kits
- Hoechst 33342 or DAPI for nuclear counterstain
- Autofluorescence quencher (e.g., Vector TrueVIEW)
- Anti-fade mounting medium
Procedure:
- Deparaffinization & Antigen Retrieval: Bake slides at 60°C for 1 hr. Deparaffinize in xylene (2 x 10 min), rehydrate through graded ethanol (100%, 95%, 70%) to distilled water. Perform heat-induced epitope retrieval (HIER) in appropriate buffer using a pressure cooker or steamer (20-30 min). Cool to room temperature (RT).
- Autofluorescence Quenching: Incubate with autofluorescence quencher for 5 min. Rinse in PBS.
- Peroxidase Block (if using TSA): Incubate with 3% H₂O₂ for 10 min to block endogenous peroxidase. Rinse.
- Protein Block: Apply blocking serum for 1 hr at RT in a humidified chamber.
- Primary Antibody Incubation: Apply carefully validated primary antibody (e.g., mouse anti-CD68) diluted in antibody diluent overnight at 4°C.
- Secondary Detection: For multiplex IF, a sequential staining approach is used. For the first marker, apply appropriate HRP-conjugated secondary antibody for 1 hr at RT, followed by incubation with a fluorophore-conjugated tyramide (e.g., Opal 520) for 10 min.
- Antigen Stripping: To strip the primary-secondary-HRP complex and prevent cross-reactivity, perform another round of HIER (microwave in retrieval buffer for 10-15 min). This step is critical for sequential labeling.
- Repeat for Subsequent Markers: Repeat steps 4-7 for the next primary antibody (e.g., rabbit anti-CD163, then rabbit anti-CD206), using a different fluorophore tyramide (e.g., Opal 570, Opal 650) each cycle.
- Nuclear Counterstain & Mounting: After the final cycle, apply DAPI (1 µg/mL) for 5 min. Rinse and mount with anti-fade medium.
- Imaging: Image using a fluorescence or confocal microscope with appropriate filter sets. Use spectral unmixing software if fluorophore spectra overlap.
Double-Stain IHC Protocol for Co-localization
For simpler two-marker analysis (e.g., CD68 with CD80 or CD206).
Procedure:
- Perform steps 1-4 as in the IF protocol.
- First Primary & Detection: Apply first primary antibody (e.g., anti-CD80). Detect using an HRP-conjugated polymer system and develop with DAB (brown precipitate).
- Antibody Elution: Wash slides in a mild stripping buffer (e.g., glycine-HCl, pH 2.0) for 1-2 hours or perform a second round of HIER to remove the first set of antibodies.
- Second Primary & Detection: Apply second primary antibody (e.g., anti-CD206). Detect using an AP-conjugated polymer system and develop with Fast Red or Vector Blue (red/blue precipitate).
- Counterstain & Mount: Counterstain with Hematoxylin. Dehydrate, clear, and mount with a non-aqueous mounting medium.
The Scientist's Toolkit: Essential Reagents & Materials
Table 2: Key Research Reagent Solutions for Macrophage IHC/IF
| Reagent/Material | Function/Benefit | Example Product/Clone |
|---|---|---|
| Pan-Macrophage Marker | Identifies total macrophage population for normalization. | CD68 (clone KP1), IBA1/AIF1 |
| M1-Associated Primary Antibodies | Labels pro-inflammatory, classically activated macrophages. | CD80 (clone 2D10), CD86 (clone BU63) |
| M2-Associated Primary Antibodies | Labels anti-inflammatory, alternatively activated macrophages. | CD163 (clone 10D6), CD206 (clone 15-2) |
| Multiplex IF Detection System | Enables sequential, high-sensitivity labeling of multiple antigens on one slide. | Opal Polychromatic IHC Kits, TSA Kits |
| Autofluorescence Quencher | Reduces tissue autofluorescence, improving signal-to-noise ratio in IF. | Vector TrueVIEW, Sudan Black B solution |
| Antigen Retrieval Buffers | Re-exposes epitopes masked by formalin fixation. | Citrate pH 6.0, Tris-EDTA pH 9.0 |
| Anti-Fade Mounting Medium | Preserves fluorescence signal during storage and imaging. | ProLong Diamond, VECTASHIELD |
| Multispectral Imaging System | Captures full spectrum data; enables spectral unmixing of overlapping signals. | Vectra/Polaris (Akoya), Z7 (Zeiss) |
Data Analysis & Quantification
- IHC: Use digital pathology software to calculate marker-positive cell density (cells/mm²) or semi-quantitative scores like H-Score (combining intensity and percentage).
- Multiplex IF: Use image analysis pipelines (e.g., in HALO, QuPath, CellProfiler) to perform single-cell segmentation based on DAPI. Measure fluorescence intensity for each channel per cell. Phenotype cells based on co-expression thresholds (e.g., CD68+CD163+CD206- vs. CD68+CD163+CD206+).
Signaling & Experimental Workflow Visualizations
Title: Multiplex Immunofluorescence Sequential Staining Workflow
Title: Macrophage Polarization to M1 and M2 Phenotypes
This technical guide details methodologies to functionally validate macrophage polarization states, defined by surface markers like CD80/86 (M1) and CD163/206 (M2), within the broader thesis of macrophage plasticity research. Moving beyond phenotypic classification, we establish standardized protocols to link marker expression to critical functional outputs: phagocytic capacity, secretory profiles, and metabolic reprogramming.
Table 1: Correlative Summary of M1/M2 Marker Expression with Functional Readouts
| Polarization State | Key Surface Markers (MFI Ratio) | Phagocytosis Index (pHrodo E. coli) | Cytokine Secretion (pg/mL) | Metabolic Phenotype (ECAR/OCR Ratio) |
|---|---|---|---|---|
| Classical (M1) | CD80hi, CD86hi, CD163lo, CD206lo | 55 ± 12 | IL-6: 1250 ± 320, TNF-α: 850 ± 210 | Glycolytic (2.8 ± 0.5) |
| Alternative (M2) | CD80lo, CD86lo, CD163hi, CD206hi | 85 ± 18 | IL-10: 980 ± 250, TGF-β: 550 ± 120 | Oxidative (0.7 ± 0.2) |
| M0 (Naïve) | CD80int, CD86int, CD163int, CD206int | 45 ± 10 | Low/Undetectable | Quiescent (1.1 ± 0.3) |
MFI: Mean Fluorescence Intensity; ECAR: Extracellular Acidification Rate; OCR: Oxygen Consumption Rate. Data represent mean ± SD from representative *in vitro human monocyte-derived macrophage studies.*
Detailed Experimental Protocols
Protocol 1: Simultaneous Surface Marker Phenotyping and Functional Assay Initiation
Objective: To correlate surface marker expression with subsequent functional assays from the same cell population.
- Cell Preparation: Differentiate human monocytes to macrophages (M-CSF, 7 days). Polarize with IFN-γ + LPS (100 ng/mL, 20 ng/mL) for M1 or IL-4 (20 ng/mL) for M2 for 48 hours.
- Surface Staining: Harvest cells, wash with PBS. Stain with fluorochrome-conjugated antibodies: Anti-human CD80-APC, CD86-PerCP-Cy5.5, CD163-PE, CD206-FITC and viability dye for 30 min at 4°C.
- Analysis & Sorting: Analyze an aliquot by flow cytometry to confirm polarization. Optionally, use FACS to sort high-purity populations based on marker combinations into separate tubes for parallel functional assays.
Protocol 2: Phagocytosis Assay (pHrodo-based)
Objective: Quantify phagocytic capacity correlated with pre-measured marker expression.
- Label Targets: Incubate pHrodo Red E. coli BioParticles (1 mg/mL) in assay buffer for 30 min.
- Assay Setup: Plate stained or sorted macrophages (from Protocol 1) in a black-walled, clear-bottom 96-well plate. Add opsonized pHrodo particles (10 µg/well).
- Kinetic Measurement: Immediately place plate in a pre-warmed (37°C, 5% CO2) microplate reader. Measure fluorescence (Ex/Em: 560/585 nm) every 5 min for 2 hours. The fluorescence increases dramatically upon phagocytosis and acidification.
- Data Analysis: Calculate the phagocytosis index as the area under the curve (AUC) of fluorescence over time, normalized to cell count.
Protocol 3: Cytokine Secretion Profile (Multiplex ELISA)
Objective: Profile secreted cytokines from phenotyped macrophages.
- Stimulation & Collection: After phenotyping in Protocol 1, rest cells for 1 hour. Stimulate with ultrapure LPS (100 ng/mL) for M1 or IL-4 (20 ng/mL) for M2 for 24 hours.
- Supernatant Harvest: Centrifuge cell culture, collect supernatants, and store at -80°C.
- Multiplex Assay: Use a commercially available Luminex or MSD human cytokine panel. Follow manufacturer's protocol to quantify IL-6, TNF-α, IL-10, and TGF-β concentrations.
Protocol 4: Metabolic Profiling (Seahorse XF Analyzer)
Objective: Determine the metabolic phenotype (glycolysis vs. oxidative phosphorylation) of defined populations.
- Cell Preparation: Seed phenotyped macrophages (from Protocol 1) onto Seahorse XF96 cell culture microplates (50,000 cells/well). Centrifuge to attach.
- Assay Medium: Replace medium with XF assay medium (unbuffered DMEM, 1 mM pyruvate, 2 mM glutamine, 10 mM glucose) and incubate at 37°C, non-CO2 for 1 hour.
- Mitochondrial Stress Test: Sequentially inject port compounds: Oligomycin (1.5 µM) to inhibit ATP synthase, FCCP (1 µM) to uncouple mitochondria for maximal respiration, and Rotenone/Antimycin A (0.5 µM) to shut down mitochondrial respiration.
- Data Analysis: Calculate basal and maximal OCR, and basal ECAR. The ECAR/OCR ratio indicates metabolic preference.
Visualizing Signaling and Workflow
Workflow: From Macrophage Polarization to Functional Correlation
Core Signaling Pathways in M1 and M2 Macrophage Polarization
The Scientist's Toolkit: Key Research Reagent Solutions
Table 2: Essential Reagents and Tools for Phenotype-Function Correlation Studies
| Item / Reagent | Function / Application | Key Considerations |
|---|---|---|
| Recombinant Human Cytokines (IFN-γ, IL-4, IL-13, M-CSF) | Induce and polarize macrophage differentiation in vitro. | Use carrier-free, high-purity (>95%) variants. Validate bioactivity with dose-response. |
| Fluorochrome-conjugated Anti-human Antibodies (CD80, CD86, CD163, CD206) | Phenotypic characterization by flow cytometry. | Titrate for optimal signal-to-noise. Use validated clones (e.g., CD80: 2D10, CD206: 15-2). |
| pHrodo BioParticles (E. coli or S. aureus) | Quantitative, fluorescence-based phagocytosis assay. | Signal increases only in acidic phagosomes. Allows real-time, live-cell kinetics. |
| Multiplex Cytokine Assay Kits (Luminex or MSD) | Simultaneous quantification of multiple cytokines from limited sample volumes. | Superior dynamic range and sensitivity vs. traditional ELISA. |
| Seahorse XF Glycolysis Stress Test & Mito Stress Test Kits | Live-cell metabolic profiling of glycolysis and oxidative phosphorylation. | Requires specialized XF analyzer. Optimize cell seeding density. |
| Cell Isolation Kits (CD14+ Monocytes) | Source primary human macrophages for translational relevance. | Consider magnetic-activated (MACS) or FACS sorting for purity. |
| Flow Cytometer with Cell Sorter (FACS) | Phenotype analysis and isolation of pure populations for downstream functional assays. | Enables direct correlation from a defined starting population. |
Within the broader thesis on M1/M2 macrophage surface markers (CD80, CD86, CD163, CD206), this technical guide details their application as critical metrics for tracking macrophage polarization in three major disease contexts. Macrophage plasticity is a central regulator of disease progression, making the quantification of M1 (pro-inflammatory, anti-tumor) and M2 (pro-resolutive, pro-fibrotic, pro-tumor) phenotypes via surface markers essential for mechanistic studies and therapeutic development. This document provides a current, in-depth analysis of experimental approaches, data interpretation, and practical protocols.
Marker Expression Profiles Across Disease Models
Quantitative data on surface marker expression are contextual and depend heavily on the disease model, tissue source, and stimulation milieu. The following tables summarize key findings from recent literature.
Table 1: Characteristic Surface Marker Expression in Polarized Macrophages In Vitro
| Polarization State | Inducing Stimuli | CD80 | CD86 | CD163 | CD206 | Key Cytokine Secretion |
|---|---|---|---|---|---|---|
| Classical M1 | IFN-γ + LPS | High | High | Very Low | Low | High TNF-α, IL-12, IL-1β |
| Alternative M2a | IL-4 / IL-13 | Low | Moderate | High | Very High | High TGF-β, CCL17, CCL22 |
| Alternative M2c | IL-10 / Glucocorticoids | Moderate | Low | Very High | Moderate | High IL-10, TGF-β |
Table 2: Marker Expression in Disease-Specific Microenvironments (Mouse & Human Studies)
| Disease Model | Primary Tissue/Source | Predominant Phenotype | CD80/86 Trend | CD163/CD206 Trend | Functional Implication |
|---|---|---|---|---|---|
| Solid Tumors (e.g., Breast Ca) | TAMs (Tumor-Assoc. Macrophages) | M2-like | Low / Variable | Consistently High | Promotes angiogenesis, immunosuppression, metastasis |
| Liver / Pulmonary Fibrosis | Lesion-Associated Macrophages | M2a / M2c | Low | Significantly Elevated | Drives myofibroblast activation, ECM deposition |
| Chronic Infection (e.g., Tuberculosis) | Granuloma Macrophages | Mixed, often M2-skewed | Moderate | High in permissive niches | May facilitate pathogen persistence via immunomodulation |
Table 3: Correlation of Marker Levels with Clinical/Pathological Outcomes
| Marker | Cancer (High Expression) | Fibrosis (High Expression) | Infection (High Expression) |
|---|---|---|---|
| CD163 | Poor prognosis, advanced stage | Severity of fibrosis, progression | Associated with chronicity, pathogen load |
| CD206 | Metastasis, treatment resistance | Degree of collagen deposition | Immunosuppressive milieu |
| CD80 | Improved response to immunotherapy (context-dependent) | Inversely correlated with progression | May indicate active immune response |
Detailed Experimental Protocols
Protocol: Multispectral Flow Cytometry for Polarization Assessment from Tumor Digests
Objective: To quantify the proportion of M1 (CD80+/CD86+) and M2 (CD163+/CD206+) macrophages from a single-cell suspension of dissociated solid tumors.
Materials: See "The Scientist's Toolkit" below.
Procedure:
- Tissue Dissociation: Mechanically mince tumor tissue and digest using the recommended enzyme cocktail (e.g., Tumor Dissociation Kit) in a gentleMACS Octo Dissociator (37°C, 30-40 mins). Pass through a 70µm strainer.
- Cell Enrichment: Isolate CD11b+ cells using magnetic-activated cell sorting (MACS) per manufacturer's protocol.
- Surface Staining: Aliquot 1x10^6 cells per tube. Block Fc receptors with purified anti-mouse CD16/32 (15 mins, 4°C). Stain with fluorescently conjugated antibodies against CD11b, F4/80, CD80, CD86, CD163, CD206, and a live/dead discriminator for 30 mins at 4°C in the dark. Include fluorescence-minus-one (FMO) controls.
- Acquisition & Analysis: Wash cells, resuspend in buffer, and acquire data on a flow cytometer equipped with at least 3 lasers. Use FMO controls to set positive gates. Analyze data using FlowJo software:
- Gate on single, live cells > CD11b+ F4/80+ macrophages.
- Create biaxial plots: CD80 vs CD86, and CD163 vs CD206.
- Define populations: M1-like (CD80+ and/or CD86+); M2-like (CD163+ and/or CD206+). Calculate percentages and MFI (Mean Fluorescence Intensity).
Protocol: Immunofluorescence Co-Staining for Spatial Context
Objective: To visualize the spatial distribution and co-localization of M1/M2 markers in fibrotic lung or liver tissue sections.
Procedure:
- Tissue Preparation: Fix paraffin-embedded tissue sections (5 µm) from fibrotic models. Deparaffinize and perform antigen retrieval using citrate-based buffer (pH 6.0).
- Multiplex Staining: Block with serum-free protein block. Apply primary antibody cocktail (e.g., anti-F4/80 + anti-CD206) overnight at 4°C.
- Detection: Apply appropriate species-specific secondary antibodies conjugated to distinct fluorophores (e.g., Alexa Fluor 488, 594). Counterstain nuclei with DAPI.
- Imaging & Quantification: Image using a confocal or multiplex fluorescence microscope. Use image analysis software (e.g., QuPath, HALO) to:
- Identify F4/80+ regions.
- Quantify the percentage of F4/80+ area that is co-positive for CD206 (M2) within fibrotic foci versus healthy adjacent tissue.
Visualization of Key Pathways & Workflows
Title: M2 TAM Polarization & Pro-Tumor Function in Cancer
Title: M2-Driven Fibrosis Progression Pathway
Title: Flow Cytometry Workflow for Phenotyping
The Scientist's Toolkit: Research Reagent Solutions
| Item / Reagent | Function / Application | Example (Brand) |
|---|---|---|
| Tumor Dissociation Kit | Gentle enzymatic blend for generating viable single-cell suspensions from solid tumors. | Miltenyi Biotec, Tumor Dissociation Kit |
| anti-mouse CD16/32 (Fc Block) | Blocks non-specific antibody binding via Fcγ receptors, critical for myeloid cells. | BioLegend, Clone 93 |
| Fluorophore-Conjugated Antibodies | Primary detection tools for surface markers (CD11b, F4/80, CD80, CD86, CD163, CD206). | BioLegend, eBioscience, BD Biosciences |
| Live/Dead Fixable Stain | Distinguishes viable cells from dead cells during flow cytometry, improving accuracy. | Thermo Fisher, Zombie dyes |
| Magnetic Cell Separation Kits | Isolates specific populations (e.g., CD11b+ monocytes/macrophages) for downstream assays. | Miltenyi Biotec, MACS Kits |
| Multiplex IHC/IF Detection Kits | Enables simultaneous visualization of multiple markers (e.g., F4/80 & CD206) on one tissue section. | Akoya Biosciences, OPAL Polychromatic Kits |
| Cytokine ELISA/Multiplex Array | Validates functional polarization by quantifying secreted cytokines (TNF-α, IL-10, TGF-β). | R&D Systems DuoSet ELISA; Luminex Assays |
| Flow Cytometry Analysis Software | Essential for complex data visualization, gating, and MFI quantification. | FlowJo, FCS Express |
Optimizing Macrophage Marker Analysis: Solving Common Pitfalls in Specificity and Reproducibility
A cornerstone of macrophage research in immunology and oncology is the accurate identification and quantification of M1 (classically activated) and M2 (alternatively activated) phenotypes. This technical guide focuses on the critical, yet often underestimated, process of antibody validation for four key surface markers: the co-stimulatory M1-associated molecules CD80 (B7-1) and CD86 (B7-2), and the scavenger receptors M2-associated CD163 and CD206 (Macrophage Mannose Receptor). Reliable detection is fundamental to any thesis investigating macrophage polarization dynamics, their role in disease progression (e.g., cancer, fibrosis, atherosclerosis), and the development of immunomodulatory therapies. Inaccurate antibody performance directly compromises data integrity, leading to false phenotypic assignments.
Clone Selection: Specificity is Paramount
The choice of antibody clone is the first and most critical step. Different clones recognize distinct epitopes on the same target protein, leading to variable performance in different applications (flow cytometry, immunohistochemistry, western blot).
Table 1: Recommended Antibody Clones for Key Macrophage Markers
| Target | Common Aliases | Recommended Clones (Examples) | Primary Application | Key Consideration |
|---|---|---|---|---|
| CD80 | B7-1, CD28LG1 | 2D10, L307.4, MEM-233 | Flow Cytometry, Functional Blockade | 2D10 is widely used for flow; L307.4 is a common blocking/functional antibody. |
| CD86 | B7-2, CD28LG2 | IT2.2, FUN-1, BU63 | Flow Cytometry, Functional Blockade | IT2.2 is a standard for high-sensitivity flow detection. |
| CD163 | Scavenger Receptor | GHI/61, RM3/1, EDHu-1 | IHC, Flow Cytometry | GHI/61 is robust for IHC; RM3/1 is common for flow. Epitope stability post-fixation varies. |
| CD206 | MRC1, Mannose Receptor | 15-2, 19.2, 3.29B1.10 | Flow Cytometry, IHC | 15-2 is frequently cited for mouse/human flow cytometry. Binding can be calcium-dependent. |
Protocol: Epitope Mapping Verification via Competitive ELISA
- Coat a high-binding ELISA plate with recombinant CD80/86/CD163/CD206 protein.
- Pre-incubate a constant concentration of your primary antibody (clone under test) with a serial dilution of a competing antibody known to bind a specific linear epitope.
- Add the mixture to the antigen-coated plate and incubate.
- Proceed with standard ELISA detection (e.g., HRP-conjugated secondary antibody, TMB substrate).
- Interpretation: A significant reduction in signal indicates the clones bind identical or overlapping epitopes, confirming the target region.
Antibody Titration: Optimizing Signal-to-Noise
Using a manufacturer's recommended concentration is a starting point. Optimal titration is essential to maximize specificity and minimize background.
Protocol: Serial Dilution Titration for Flow Cytometry
- Prepare a single-cell suspension of positive control cells (e.g., LPS/IFN-γ stimulated PBMCs for CD80/86; IL-4/IL-13 stimulated monocytes for CD163/206) and negative control cells (unstimulated monocytes or a cell line lacking the target).
- Aliquot equal cell numbers into multiple tubes.
- Prepare a series of antibody dilutions (e.g., 1:50, 1:100, 1:200, 1:400) in FACS buffer.
- Stain the cell aliquots with each antibody dilution. Include an unstained control.
- Acquire data on a flow cytometer. Plot fluorescence intensity (MFI) vs. dilution for both positive and negative populations.
- Optimal Concentration: The dilution that provides the highest Staining Index = (MFIpositive – MFInegative) / (2 × SD_negative), or the point before the positive MFI plateaus while the negative MFI remains low.
Table 2: Example Titration Results for Flow Cytometry (Hypothetical Data)
| Antibody | Clone | Tested Conc. (µg/mL) | Positive MFI | Negative MFI | Staining Index |
|---|---|---|---|---|---|
| Anti-CD86 | IT2.2 | 0.5 | 45,200 | 520 | 28.5 |
| 0.25 | 42,100 | 450 | 32.1 | ||
| 0.125 | 38,500 | 420 | 30.1 | ||
| 0.0625 | 25,000 | 410 | 15.0 | ||
| Anti-CD206 | 15-2 | 1.0 | 12,500 | 380 | 16.2 |
| 0.5 | 11,200 | 370 | 14.9 | ||
| 0.25 | 8,100 | 365 | 10.8 |
The Critical Role of Isotype & Negative Controls
Isotype controls match the host species, immunoglobulin class (IgG1, IgG2a, etc.), and conjugation of the primary antibody but have irrelevant specificity. They identify non-specific Fc receptor binding or background staining.
Protocol: Proper Use of Isotype and Biological Controls
- Isotype Control Tube: Stain cells with the isotype control antibody at the same protein concentration as the optimal primary antibody concentration.
- Primary Antibody Tube: Stain cells with the target-specific antibody.
- Biological Negative Control: Always include cells known not to express the marker (e.g., a T-cell line for CD163/CD206).
- Fc Receptor Blocking: For macrophages (high FcγR expression), include a blocking step with human/mouse Fc block or normal serum for 10-15 minutes prior to antibody staining.
- Gating: Set the positive gate so that ≤1% of cells in the isotype control tube (on the biological population of interest) are positive.
The Scientist's Toolkit: Research Reagent Solutions
Table 3: Essential Reagents for Macrophage Marker Validation
| Reagent / Solution | Function & Importance |
|---|---|
| Recombinant Protein (Target Antigen) | Positive control for specificity assays (ELISA, western blot). Essential for absorption/blocking experiments to confirm signal is target-specific. |
| CRISPR/Cas9 Knockout Cell Line | Gold-standard negative control. Provides a biological system completely lacking the target protein, unequivocally proving antibody specificity. |
| Fluorophore-Conjugated Secondary Antibodies | For indirect detection methods (IHC, IF). Must be highly cross-adsorbed against immunoglobulins of other species to prevent cross-reactivity. |
| Cell Stimulation Cocktails | LPS+IFN-γ (for M1/CD80/86 upregulation) and IL-4+IL-13 (for M2/CD163/CD206 upregulation). Generate reliable positive controls. |
| Viability Dye (e.g., Zombie NIR, Propidium Iodide) | Distinguishes live from dead cells. Dead cells exhibit high non-specific antibody binding, a critical confounding factor in flow/imaging. |
| Validated Positive Control Cell Lysate or Slide | Commercially available lysates or tissue microarrays with certified expression levels. Used as inter-experiment benchmarks. |
Visualization of Experimental Workflows & Signaling Context
Diagram 1: Antibody Validation Workflow for Macrophage Markers
Diagram 2: Macrophage Polarization Signaling & Marker Expression
Rigorous antibody validation—informed by thoughtful clone selection, empirical titration, and stringent use of isotype and biological controls—is non-negotiable for credible research into macrophage polarization. The markers CD80/CD86 and CD163/CD206 serve as critical, though not exclusive, indicators of M1/M2 states. Implementing the protocols and controls outlined in this guide ensures that subsequent data interpretation within a thesis or drug development program is built upon a foundation of technical reliability, accurately reflecting the complex biology of macrophage phenotypes.
Within the broader research on M1/M2 macrophage polarization, characterized by surface markers like CD80, CD86 (M1) and CD163, CD206 (M2), a fundamental and persistent challenge is the accurate identification and isolation of macrophages from other myeloid cells. Monocytes, dendritic cells (DCs), neutrophils, and other myeloid-derived suppressor cells (MDSCs) share overlapping phenotypes, complicating flow cytometry gating and functional analysis. This technical guide addresses these gating challenges with current strategies and protocols.
Key Surface Markers for Myeloid Cell Discrimination
Accurate discrimination requires a multi-parameter approach. The table below summarizes the classic and emerging markers used to distinguish these populations in human samples.
Table 1: Key Surface Markers for Human Myeloid Cell Discrimination
| Cell Type | Classic Defining Markers | Negative/Low Markers | Key Polarization/Functional Markers | Notes |
|---|---|---|---|---|
| Classical Monocyte | CD14++ CD16- HLA-DR+ | CD123- (IL-3Rα) | CCR2+, CD62L+ | Precursors for tissue macrophages and Mo-DCs. |
| Non-Classical Monocyte | CD14+ CD16++ HLA-DR+ | CD123- | CX3CR1++, CD11c+ | Patrolling subset. |
| Myeloid Dendritic Cell (mDC) | CD11c+ HLA-DR++ CD141/BDCA-3* or CD1c/BDCA-1* | CD14- CD16- (Lin-) | CD80/86 (constitutive), CD83 (activation) | *Subsets; Specialized antigen presentation. |
| Plasmacytoid DC (pDC) | CD123+ HLA-DR+ BDCA-2/CD303+ BDCA-4/CD304+ | CD11c- CD14- CD16- | TLR7/9+, produce IFN-α. | |
| Macrophage (Tissue) | CD14+ CD64++ (high) HLA-DR+ | Often CD16- (variable) | M1: CD80, CD86, HLA-DR (high) M2: CD163, CD206, CD200R | High autofluorescence; Expression varies by tissue and activation. |
| Neutrophil | CD15+ CD66b+ CD11b+ | HLA-DR- CD14- | CD62L (high in resting), CD11b (up on activation) | Short-lived, granular. |
| Monocytic-MDSC (M-MDSC) | CD14+ HLA-DR-low/neg CD11b+ | (Defined by low HLA-DR) | CD33+, CD124 (IL-4Rα)+ | Immunosuppressive; Critical to assess HLA-DR density. |
Experimental Protocol: High-Dimensional Flow Cytometry for Myeloid Discrimination
This protocol outlines a 12-color panel for identifying human PBMC and tissue-derived myeloid subsets.
1. Sample Preparation:
- PBMCs: Isolate from heparinized blood via density gradient centrifugation (Ficoll-Paque). Wash twice in PBS + 2% FBS.
- Tissue: Process single-cell suspensions using mechanical dissociation and enzymatic digestion (e.g., collagenase IV/DNase I). Filter through a 70µm strainer and perform RBC lysis if needed.
2. Viability and Fc Block:
- Resuspend cells in PBS. Stain with a viability dye (e.g., Zombie NIR Fixable Viability Kit) for 20 min at RT in the dark. Wash.
- Incubate with Human Fc Block (e.g., anti-CD16/32) or human serum for 10 min on ice.
3. Surface Staining:
- Prepare master mix of antibodies in Brilliant Stain Buffer. The recommended panel includes:
- Lineage/Identification: CD45 (BV785), HLA-DR (BV711), CD14 (BV605), CD16 (BV510), CD11c (PE-Cy7), CD123 (APC-Fire750), CD64 (FITC).
- Subset/Polarization: CD86 (PE) for M1/activation, CD163 (APC) for M2.
- Add antibody cocktail to cells. Incubate 30 min at 4°C in the dark. Wash twice.
4. Fixation and Data Acquisition:
- Fix cells in 1-2% PFA for 10 min. Wash and resuspend in FBS buffer.
- Acquire data on a flow cytometer equipped with at least 3 lasers (405, 488, 640 nm). Collect >100,000 events in the live cell gate.
5. Gating Strategy Workflow: The logical gating hierarchy is depicted in the following diagram.
The Scientist's Toolkit: Research Reagent Solutions
Table 2: Essential Reagents for Myeloid Cell Research
| Reagent Category | Specific Example(s) | Function in Experiment |
|---|---|---|
| Density Gradient Medium | Ficoll-Paque PLUS, Lymphoprep | Isolation of PBMCs or specific cell densities from whole blood or tissue homogenates. |
| Fc Receptor Block | Human TruStain FcX, purified anti-CD16/32 | Blocks non-specific antibody binding via Fc receptors, critical for clear myeloid marker staining. |
| Viability Dye | Zombie dyes, Fixable Viability Dye eFluor 506/780 | Distinguishes live from dead cells during flow analysis, improving accuracy of population gates. |
| Clone-Validated Antibody Panels | Anti-human CD14 (M5E2), CD16 (3G8), CD64 (10.1), HLA-DR (L243) | High-quality, titrated antibodies are essential for resolving populations with similar antigen density (e.g., HLA-DR low on MDSCs). |
| Cell Stimulation Cocktails | PMA/Ionomycin, LPS, IFN-γ, IL-4/IL-13 | Used to induce M1 or M2 polarization in vitro for functional validation of marker expression (CD80/86 vs. CD163/206). |
| Intracellular Staining Buffer Kits | Foxp3/Transcription Factor Staining Buffer Set, Cytofix/Cytoperm | Permeabilizes cells for staining of intracellular or nuclear markers (e.g., cytokines, transcription factors). |
| Compensation Beads | UltraComp eBeads, ArC Amine Reactive Beads | Essential for setting accurate fluorescence compensation in multicolor flow cytometry. |
| Data Analysis Software | FlowJo, FCS Express, Cytobank | Enables high-dimensional data analysis, dimensionality reduction (t-SNE, UMAP), and population clustering. |
Key Signaling Pathways in Macrophage Polarization
The M1/M2 paradigm is driven by distinct signaling pathways that regulate the surface markers used for gating. The core pathways are summarized below.
Distinguishing macrophages from related myeloid cells is a non-trivial task central to accurate research in immunology and macrophage polarization. A rigorous, multi-parameter gating strategy that incorporates high-sensitivity discrimination of HLA-DR density, uses specific marker combinations (CD14, CD16, CD64, CD11c, CD123), and contextualizes findings within M1/M2 marker expression (CD80, CD86, CD163, CD206) is essential. The integration of standardized protocols, high-quality reagents, and advanced analytical techniques will continue to refine our understanding of these dynamic cell populations in health and disease.
Within the critical research on M1/M2 macrophage surface markers (CD80, CD86, CD163, CD206), a fundamental challenge is the introduction of activation artifacts during ex vivo manipulation. These artifacts, manifested as unintended phenotype shifts, confound data interpretation and threaten the translational validity of findings. Macrophages are exquisitely sensitive to their microenvironment; routine procedures like cell isolation, culture conditions, and experimental stimulation can inadvertently induce or suppress marker expression. For instance, "resting" macrophages isolated via collagenase digestion may exhibit elevated CD86 (M1-associated) due to enzymatic activation, while standard culture on polystyrene can suppress CD163 (M2-associated). This whitepaper provides a technical guide for identifying, minimizing, and controlling for these artifacts to ensure the fidelity of macrophage phenotype data.
Cell Isolation & Tissue Dissociation
Mechanical and enzymatic dissociation induces acute stress and activation. The choice of reagents directly impacts baseline marker levels.
Culture Substrate & Media Components
Standard tissue culture plastic, fetal bovine serum (FBS) lot variability, and common additives like antibiotics can skew polarization states.
3Ex VivoStimulation Protocols
Non-physiological doses or durations of polarizing agents (e.g., LPS/IFN-γ, IL-4/IL-13) can drive extreme, non-representative phenotypes.
Analytical Procedures
Antibody incubation conditions, cell staining time, and the use of fixation/permeabilization buffers can alter epitope availability and detection.
Table 1: Impact of Common Procedures on Key Macrophage Markers
| Procedure/Component | Artifactual Effect on M1 Markers | Artifactual Effect on M2 Markers | Recommended Mitigation |
|---|---|---|---|
| Collagenase IV Digestion | Upregulates CD80, CD86 | Downregulates CD206 | Use gentle mechanical dissociation; limit enzyme time; use inhibitors. |
| FBS (Standard Lot) | Variable CD86 expression | Can induce basal CD163 | Use defined, serum-free media or rigorously pre-screened FBS lots. |
| Culture on Polystyrene | May elevate basal CD80 | Suppresses CD163 & CD206 | Use low-attachment plates or pre-coated (e.g., poly-HEMA) surfaces. |
| LPS Carryover | Extreme, sustained CD80/86 | Suppresses all M2 markers | Use ultrapure LPS; include controls for endotoxin in media/reagents. |
| Fixation (4% PFA) | Can mask CD86 epitopes | May enhance CD206 detection | Titrate fixation; validate antibodies for fixed-cell staining. |
Optimized Experimental Protocols
Protocol 3.1: Minimally Activating Human Monocyte-Derived Macrophage (hMDM) Generation
Objective: Generate unprimed M0 macrophages with minimal baseline activation for M1/M2 polarization studies. Key Reagents: See The Scientist's Toolkit.
- Isolation: Isolate PBMCs via density gradient centrifugation (e.g., Ficoll-Paque PLUS). Use cold, Ca2+/Mg2+-free PBS throughout.
- Monocyte Selection: Use negative selection kits (avoid CD14+ positive selection via column/magnetic bead activation). Resuspend cells in cold buffer.
- Culture Setup: Seed monocytes in serum-free macrophage differentiation media or media with human platelet lysate (screened for low endotoxin). Use tissue culture plates pre-coated with poly(2-hydroxyethyl methacrylate) (poly-HEMA) to prevent adhesion-induced activation.
- Differentiation: Add M-CSF (25 ng/mL) for 6 days. Do not change media; only supplement with fresh growth factors on day 3.
- Harvesting M0: On day 6, do not trypsinize. Gently dislodge cells using cold PBS + 0.5 mM EDTA on a rocking platform (20 min, 4°C). Confirm phenotype: low CD80, CD86, CD163, CD206.
Protocol 3.2: Physiological Polarization & Stimulation
Objective: Induce M1/M2 phenotypes using physiological reagent concentrations and timelines.
- M1 Polarization: Stimulate M0 macrophages with ultra-pure LPS (10-100 pg/mL) and IFN-γ (1-5 ng/mL) for 18-24 hours. This mimics chronic low-grade inflammation vs. septic shock.
- M2 Polarization: Stimulate with IL-4 (10-20 ng/mL) for 48 hours. Avoid supra-physiological IL-4 (>50 ng/mL).
- Controls: Always include a "media change control" (cells subjected to fresh media without cytokines) to account for activation from handling.
Protocol 3.3: Artifact-Aware Flow Cytometry
Objective: Accurately measure surface markers without staining-induced artifacts.
- Staining Buffer: Use PBS with 0.5% BSA and 2 mM EDTA. Avoid sodium azide (affects metabolism).
- Antibody Titration: Perform on ex vivo tissue-resident macrophages (if possible) or carefully generated M0.
- Staining Conditions: Perform all steps at 4°C using pre-chilled buffers. Limit total staining time to 45 minutes.
- Fixation: If required, use 0.5% PFA for 10 min at 4°C, followed by immediate analysis. Do not store fixed cells for >24h before CD86 analysis.
- Gating Strategy: Use viability dye, doublet exclusion, and include fluorescence-minus-one (FMO) controls for all markers.
Signaling Pathways and Workflow Diagrams
Diagram 1: Sources and Impact of Activation Artifacts
Diagram 2: Non-Physiological Stimulation Drives Artifacts
Diagram 3: Optimized Workflow to Minimize Artifacts
The Scientist's Toolkit: Essential Reagents & Materials
Table 2: Key Research Reagent Solutions for Artifact Minimization
| Reagent/Material | Specific Product Example/Attribute | Function & Rationale for Artifact Reduction |
|---|---|---|
| Dissociation Enzyme | Liberase TL Research Grade (Roche) or GentleMACS Octo Dissociator | Defined enzyme blend; gentler than crude collagenase. Mechanical dissociator standardizes process. |
| Monocyte Isolation Kit | Pan Monocyte Isolation Kit, human (negative selection, Miltenyi) | Avoids antibody cross-linking of CD14, preventing pre-activation. |
| Culture Substrate | Poly(2-hydroxyethyl methacrylate) (poly-HEMA) coating solution | Creates a non-adherent surface, preventing integrin-mediated activation from tissue culture plastic. |
| Basal Media | Macrophage-SFM (Gibco) or RPMI-1640 without phenol red | Defined, serum-free formulation eliminates FBS batch variability and unknown factors. |
| Serum Alternative | Human Platelet Lysate (hPL), screened for low endotoxin (<0.01 EU/mL) | Provides human-specific growth factors without the high immunoglobin/immune complex load of FBS. |
| Polarizing Cytokines | Carrier-free, ultrapure recombinant proteins (e.g., BioLegend, PeproTech) | Avoids BSA or other carriers that can have batch effects. Ensures precise, low-concentration dosing. |
| Endotoxin Testing | LAL Chromogenic Endotoxin Quantitation Kit (Pierce) | Critical for screening all media, reagents, and coatings for contaminating LPS which activates TLR4. |
| Low-Binding Plates | Corning Costar Ultra-Low Attachment Multiple Well Plates | Pre-fabricated plates with hydrogel coating to minimize adhesion. |
| Flow Cytometry Antibodies | Recombinant antibodies, validated for low non-specific binding | Reduced lot-to-lot variability. Must be titrated on ex vivo or minimally activated cells. |
| Viability Dye | Fixable Viability Dye eFluor 780 (Invitrogen) | Allows fixation post-stain without loss of signal. Critical for analyzing fragile ex vivo isolates. |
Within the research thesis focusing on the functional dichotomy of tumor-associated macrophages (TAMs) via surface markers CD80/CD86 (M1-like) and CD163/CD206 (M2-like), the initial tissue dissociation step is critically decisive. Suboptimal digestion protocols degrade these key epitopes, leading to inaccurate phenotyping, flawed data on M1/M2 polarization states, and compromised conclusions on tumor immunology. This guide details technical strategies to maximize epitope preservation for robust downstream analysis by flow cytometry or single-cell RNA sequencing.
The Challenge: Proteolytic Sensitivity of Key Markers
Surface markers exhibit variable susceptibility to enzymatic cleavage. In the context of M1/M2 research, CD163 (a highly sensitive scavenger receptor) and CD206 (a mannose receptor) are particularly vulnerable to collagenase-based digestion, while CD80/CD86 can also be affected by excessive protease activity or mechanical stress, skewing the apparent macrophage polarization profile.
Comparative Analysis of Digestion Enzyme Systems
The choice of enzyme cocktail is the primary variable. The table below summarizes quantitative findings on cell yield, viability, and critical marker preservation from recent studies.
Table 1: Impact of Digestion Protocols on Macrophage Yield and Marker Integrity
| Enzyme System | Typical Incubation (37°C) | Relative Cell Yield | Median Viability | CD163/CD206 Preservation | CD80/CD86 Preservation | Best For |
|---|---|---|---|---|---|---|
| Collagenase IV + DNase I | 60-90 min | High (+++) | 75-85% | Low-Moderate | High | General stromal dissociation; may compromise M2 markers. |
| Liberase TL + DNase I | 45-60 min | High (+++) | 80-90% | Moderate-High | High | Balanced protocol for multi-lineage recovery. |
| Collagenase/Dispase + DNase I | 90-120 min | Moderate (++) | 70-82% | Moderate | Moderate | Epithelial-rich tissues. |
| Gentle MACS Octase (Tumor Dissociation Kit) | 30-45 min | Moderate-High (++/+++) | 85-95% | High | High | Optimal for sensitive immune cell phenotyping. |
| Cold-Active Protease (e.g., Subtilisin A) | 4-16 hrs at 4-6°C | Low (+) | >95% | Excellent | Excellent | Maximum epitope preservation, but lower yield. |
Detailed Recommended Protocol for M1/M2 Marker Preservation
This protocol is optimized for fresh human or murine solid tumor samples (e.g., carcinoma, sarcoma).
Materials:
- Gentle MACS Octase Tumor Dissociation Kit (Miltenyi Biotec) or equivalent low-activity, purified enzyme blend.
- Hanks' Balanced Salt Solution (HBSS) with calcium and magnesium.
- DNase I (1-10 U/mL final concentration).
- GentleMACS Dissociator or manual pipetting with wide-bore tips.
- Temperature-controlled orbital shaker.
- Stopping Buffer: PBS with 10% FBS and 1mM EDTA.
- 70µm and 40µm cell strainers.
- Pre-chilled centrifuge.
Methodology:
- Tissue Preparation: Mince tissue into 2-4 mm³ pieces in a small volume of cold HBSS using scalpels. Minimize mechanical shear.
- Enzyme Solution: Prepare the enzyme mix per manufacturer instructions (typically a blend of collagenase, dispase, and thermolysin) in HBSS. Add DNase I. Pre-warm to 37°C.
- Digestion: Combine tissue pieces and enzyme solution in a C-tube. Process on a GentleMACS dissociator using the pre-programmed "human tumor" or "mouse tumor" setting (typically a short, gentle mechanical run). Immediately transfer to the orbital shaker for a 30-minute incubation at 37°C with mild agitation.
- Termination: After incubation, add a large volume (>10x) of ice-cold Stopping Buffer to inactivate enzymes.
- Cell Isolation: Filter the suspension sequentially through 70µm and 40µm cell strainers. Wash cells with cold PBS + 2% FBS.
- Debris and Dead Cell Removal: Perform density gradient centrifugation or use a dead cell removal kit.
- Immediate Staining: Proceed to surface staining for flow cytometry. Crucially, include Fc receptor blocking prior to antibody incubation. For markers like CD163, consider short, cold staining protocols.
Visualizing the Experimental Workflow
Diagram 1: Tissue processing workflow.
The Scientist's Toolkit: Essential Research Reagents
Table 2: Key Reagent Solutions for Macrophage-Focused Tissue Digestion
| Reagent / Material | Function / Rationale | Example Product / Note |
|---|---|---|
| Gentle MACS Octase | A highly purified, low-activity enzyme blend designed for minimal epitope damage. Critical for CD163 preservation. | Miltenyi Biotec, Tumor Dissociation Kit |
| Liberase TL Research Grade | A purified blend of Collagenase I/II and Thermolysin, offering a balance of efficiency and gentleness. | Roche |
| Recombinant DNase I | Degrades extracellular DNA released by dead cells, reducing clumping and improving cell yield/viability. | Worthington, Roche |
| Fc Receptor Blocking Solution | Essential pre-stain step to prevent non-specific, Fc-mediated antibody binding to macrophages and other immune cells. | Human FcR Blocking Reagent (Miltenyi), TruStain FcX (BioLegend) |
| Viability Dye (Fixable) | Distinguishes live from dead cells; dead cells cause nonspecific antibody binding. Must be used before fixation. | Zombie Aqua (BioLegend), LIVE/DEAD Fixable Vials (Thermo Fisher) |
| Cell Strainers (40µm, 70µm) | Sequential filtration removes undigested tissue clumps and yields a single-cell suspension. | Pluristrainer (pluriSelect) |
| RBC Lysis Buffer | Removes contaminating red blood cells post-digestion, clarifying the leukocyte population. | ACK Lysing Buffer |
| Complete Media with FBS | Used as a "stopping buffer"; FBS inactivates proteases and prevents cell clumping. | RPMI-1640 + 10% FBS |
Key Considerations for Experimental Design
- Time & Temperature: Minimize both. Perform digestions for the shortest effective duration. Keep cells on ice after digestion.
- Controls: Include a tissue control processed with minimal digestion for baseline marker expression. Use isotype and fluorescence-minus-one (FMO) controls for flow cytometry.
- Downstream Compatibility: For single-cell RNA-seq, ensure enzymes are compatible (e.g., Liberase is preferred over crude collagenase, which can induce stress responses).
Accurate delineation of M1-like (CD80⁺/CD86⁺) and M2-like (CD163⁺/CD206⁺) macrophage populations from solid tissues is foundational to the thesis research. By prioritizing gentle, time-limited enzymatic dissociation with purified blends and incorporating rapid quenching steps, researchers can preserve the integrity of these sensitive surface markers, thereby ensuring data reflect the true in vivo immunobiology of the tumor microenvironment.
Within the broader thesis on M1/M2 macrophage surface markers (CD80, CD86, CD163, CD206), achieving reproducible phenotyping is paramount. Inconsistent methodologies and reporting hinder data comparison and validation across studies in immunology and drug development. This guide details standardized best practices to ensure reliability in macrophage polarization research.
Core Markers and Their Biological Significance
The classical M1/M2 paradigm, while recognized as a simplification, remains a foundational framework. Standardized phenotyping relies on consistent measurement of key surface markers.
Table 1: Core Macrophage Phenotype Markers and Functions
| Marker | Associated Phenotype | Primary Function | Common Detection Method |
|---|---|---|---|
| CD80 | M1 (Pro-inflammatory) | Co-stimulatory molecule for T-cell activation. | Flow Cytometry |
| CD86 | M1 (Pro-inflammatory) | Co-stimulatory molecule; often expressed with CD80. | Flow Cytometry |
| CD163 | M2 (Anti-inflammatory) | Hemoglobin scavenger receptor; indicates alternative activation. | Flow Cytometry, IHC |
| CD206 | M2 (Anti-inflammatory) | Mannose receptor; involved in endocytosis and phagocytosis. | Flow Cytometry, IHC |
Recent studies emphasize that macrophage populations exist on a spectrum. A 2023 meta-analysis indicated that using a minimum of four markers (e.g., CD80, CD86, CD163, CD206) increases classification accuracy to >90% compared to using a single marker pair. Quantification should report both percentage of positive cells and mean fluorescence intensity (MFI).
Standardized Experimental Protocols
Protocol 1: In Vitro Human Monocyte-Derived Macrophage (MDM) Generation & Polarization
This is a critical first step; variability here cascades through all downstream analyses.
- Monocyte Isolation: Isolate CD14+ monocytes from PBMCs using positive magnetic selection or adherence. Report donor characteristics (age, sex, health status) and purity (target >95% by flow cytometry).
- Differentiation: Culture monocytes for 6-7 days in RPMI-1640 + 10% FBS (batch-recorded) + 50 ng/mL recombinant human M-CSF. Medium refresh on day 4.
- Polarization: On day 7, polarize macrophages for 24-48 hours.
- M1: 100 ng/mL LPS + 20 ng/mL IFN-γ.
- M2: 20 ng/mL IL-4 + 20 ng/mL IL-13.
- Control: M-CSF medium only.
- Harvesting: Use gentle cell scraping in PBS + 2mM EDTA. Avoid trypsin, which can cleave surface markers.
Protocol 2: Standardized Flow Cytometry for Macrophage Phenotyping
Adherence to this protocol minimizes instrument- and operator-induced variance.
- Staining: Harvest polarized macrophages. Use Fc receptor blocking (e.g., human IgG) for 10 min prior to surface staining.
- Antibody Panel: Use directly conjugated, clone-validated antibodies in a pre-titrated cocktail. Essential controls: Unstained, fluorescence minus one (FMO) for each channel, isotype controls.
- Viability Stain: Always include a viability dye (e.g., Zombie NIR) to gate on live cells.
- Fixation: Fix cells in 2% PFA for 15 min post-staining if not running immediately.
- Acquisition: Calibrate cytometer daily with beads. Acquire a minimum of 10,000 live, single-cell events per sample. Set voltage using unstained and FMO controls.
- Analysis: Apply consistent, pre-defined gating strategy: FSC-A/SSC-A > single cells (FSC-H/FSC-W) > live cells > marker positivity. Report gating thresholds based on FMO controls.
Table 2: Key Research Reagent Solutions for Macrophage Phenotyping
| Reagent Category | Specific Example | Function & Importance |
|---|---|---|
| Polarization Cytokines | Recombinant Human M-CSF, IL-4, IL-13, IFN-γ | Define macrophage polarization state. Use high-purity, carrier protein-free, and report source, catalog #, and lot #. |
| Flow Cytometry Antibodies | Anti-human CD80 (clone 2D10), CD86 (IT2.2), CD163 (GHI/61), CD206 (15-2) | Primary detection tool. Critical to validate clones for specific applications and report conjugates. |
| Viability Stain | Zombie Dyes, Propidium Iodide (PI) | Distinguish live/dead cells; dead cells exhibit non-specific antibody binding. |
| Fc Block | Human TruStain FcX, Purified Human IgG | Block non-specific antibody binding via Fc receptors, reducing background. |
| Cell Dissociation Reagent | EDTA in PBS, Enzyme-free dissociation buffers | Preserve surface marker integrity during cell harvesting. Avoid trypsin. |
| Flow Cytometry Validation Beads | Rainbow Calibration Particles, CST Cytometer Setup and Tracking Beads | Daily instrument calibration and performance tracking for longitudinal reproducibility. |
Signaling Pathways in Macrophage Polarization
Understanding the underlying pathways informs marker selection and interpretation of heterogeneous populations.
Title: Signaling Pathways Driving M1 and M2 Macrophage Phenotypes
Comprehensive Workflow for Reproducible Phenotyping
A standardized end-to-end workflow is essential.
Title: Standardized Macrophage Phenotyping Workflow with QC Steps
Minimum Reporting Standards (MRS)
For full reproducibility, the following must be documented:
- Biological Replicates: Number of donors (n) and experimental repeats.
- Cell Source: Donor demographics, isolation method, culture media (with batch numbers).
- Polarization: Cytokine/growth factor concentrations, duration, and vendor details.
- Antibodies: Clone, fluorochrome, vendor, catalog #, lot #, and dilution/µg per test.
- Instrumentation: Flow cytometer model, software version, calibration status.
- Gating Strategy: Full description, with FMO thresholds for positivity.
- Data Deposition: Public repository IDs for raw flow cytometry data (e.g., FlowRepository).
Rigorous standardization in macrophage phenotyping, centered on consistent protocols for markers like CD80, CD86, CD163, and CD206, is non-negotiable for reproducible research. By implementing the detailed workflows, controls, and reporting frameworks outlined here, researchers can generate robust, comparable data that advances our understanding of macrophage biology and therapeutic targeting.
Validating Macrophage Phenotypes: Critically Comparing Markers, Assays, and Functional Readouts
Within the broader research thesis on M1/M2 macrophage surface markers (CD80, CD86, CD163, CD206), the specificity of putative "M2" markers across species remains a critical, yet often underexamined, variable. This technical guide provides an in-depth analysis of the specificity and utility of CD163 and CD206 as markers for M2-polarized macrophages in human versus mouse experimental systems. Accurate delineation is paramount for translational research and drug development aiming to target macrophage phenotypes in disease.
Molecular Biology & Species-Specific Differences
CD163 (scavenger receptor cysteine-rich type 1 protein M130) and CD206 (macrophage mannose receptor 1, MRC1) are transmembrane receptors often associated with anti-inflammatory, pro-resolving, or tissue-remodeling functions.
Key Differences:
- CD163: In humans, it is a highly specific marker for cells of the monocyte-macrophage lineage and is robustly upregulated by IL-10 and glucocorticoids. Its soluble form (sCD163) is a clinical biomarker. The mouse Cd163 gene has high homology but exhibits more complex expression patterns, including on specific neutrophil subsets, and is alternatively spliced.
- CD206: This C-type lectin is expressed on various tissue macrophages and dendritic cells in both species. Its regulation by IL-4/IL-13 is well-conserved, but baseline expression in resident macrophages can vary significantly between tissues and species.
Table 1: Expression Profile of CD163 and CD206 in Human vs Mouse Systems
| Marker | Species | Primary Cell Type | Inducing Cytokines (M2) | Key Inhibitors/Regulators | Notes on Specificity |
|---|---|---|---|---|---|
| CD163 | Human | Monocytes/Macrophages | IL-10, Glucocorticoids | IFN-γ, TLR agonists | High specificity for macrophage lineage. Canonical M2a marker. |
| Mouse | Macrophages, Subset of Neutrophils | IL-10 (context-dependent) | IFN-γ, LPS | Less specific; expressed on some PMN. Splice variants exist. | |
| CD206 | Human | Macrophages, DCs, Endothelial cells | IL-4, IL-13 | IFN-γ, IL-17 | Broad but inducible; common M2a marker. Tissue variance high. |
| Mouse | Macrophages, DCs, Lymphatic cells | IL-4, IL-13 | IFN-γ | Reliable marker for IL-4/IL-13 activation in macrophages. |
Table 2: Common Antibody Clone Cross-Reactivity & Validation
| Marker | Species | Recommended Clone (Example) | Reactivity | Common Pitfall |
|---|---|---|---|---|
| CD163 | Human | RM3/1, 5C6-FAT | High; well-established. | sCD163 can interfere with detection. |
| Mouse | S15049I, TNKUPJ | Detects specific isoforms. | Check splice variant recognition. | |
| CD206 | Human | 15-2, 3.29B1.10 | Good for flow/IH. | Background on some endothelial cells. |
| Mouse | MR5D3, C068C2 | Standard for M2a polarization. | Also marks some DC subsets. |
Experimental Protocols for Marker Validation
Protocol 1: In Vitro Polarization and Flow Cytometry Analysis
- Cell Source: Human: CD14+ monocytes from PBMCs. Mouse: Bone marrow-derived macrophages (BMDMs).
- Polarization:
- M1 Control: Culture with 20 ng/mL IFN-γ + 100 ng/mL LPS (human); 20 ng/mL IFN-γ + 50 ng/mL LPS (mouse) for 24-48h.
- M2a: Culture with 20 ng/mL IL-4 + 20 ng/mL IL-13 for 48-72h.
- M2c: Culture with 20 ng/mL IL-10 for 48-72h.
- Staining: Harvest cells, block Fc receptors. Stain with anti-human/mouse CD163-APC, CD206-PE, and respective isotype controls. Include lineage (CD11b, F4/80) and M1 markers (CD80, CD86) for phenotype confirmation.
- Analysis: Acquire on flow cytometer. Gate on live, single cells, then macrophage lineage markers. Report MFI and percentage positive for each marker under different polarizing conditions.
Protocol 2: Immunohistochemistry/Immunofluorescence on Tissue Sections
- Tissue Fixation: Use neutral buffered formalin (human) or 4% PFA (mouse). Paraffin-embed and section.
- Antigen Retrieval: Perform heat-induced epitope retrieval in citrate buffer (pH 6.0) or EDTA buffer (pH 9.0).
- Blocking: Block with serum from secondary host and avidin/biotin block if using biotin system.
- Primary Antibody Incubation: Apply optimized concentration of anti-CD163 and anti-CD206 antibodies overnight at 4°C. Include species-matched tissue controls.
- Detection: Use appropriate HRP-polymer or fluorophore-conjugated secondary antibodies. For double staining, use sequential labeling with different host species primaries.
- Counterstaining & Mounting: Counterstain with hematoxylin (IHC) or DAPI (IF). Mount and image.
Signaling Pathway and Experimental Workflow
Pathway Title: Signaling Pathways Regulating CD163 and CD206 in Human vs Mouse Macrophages
Title: Experimental Workflow for Comparing Marker Expression Across Species
The Scientist's Toolkit: Research Reagent Solutions
Table 3: Essential Reagents for M2 Marker Research
| Reagent Category | Specific Example | Function & Application Notes |
|---|---|---|
| Polarization Cytokines | Recombinant Human/Mouse IL-4, IL-13, IL-10, IFN-γ, LPS | Induce specific macrophage phenotypes in vitro. Critical to use species-matched proteins. |
| Flow Cytometry Antibodies | Anti-human CD163-APC (clone RM3/1), Anti-mouse CD206-PE (clone MR5D3), Anti-CD11b, Anti-F4/80 | Surface staining for phenotype identification. Clone selection is crucial for specificity. |
| IHC/IF Antibodies | Rabbit anti-human CD163 (polyclonal), Rat anti-mouse CD206 (clone MR5D3) | Detection of markers in tissue context. Requires rigorous optimization and controls. |
| Cell Isolation Kits | Human CD14+ MicroBeads, Mouse Bone Marrow Macrophage Differentiation Media | Source pure primary cell populations for polarization studies. |
| Blocking Reagents | Fc Receptor Blocking Solution (Human/Mouse), Serum from Secondary Host | Reduce non-specific antibody binding in flow cytometry and IHC/IF. |
| Critical Controls | Isotype Control Antibodies, Unpolarized (M0) Macrophages, Knockdown/ KO Cells (e.g., Stat6-/- BMDMs) | Essential for validating specificity of staining and phenotype. |
CD206 serves as a reasonably conserved, cytokine-inducible marker for M2a macrophages across human and mouse systems, though baseline expression requires careful interpretation. In contrast, CD163 exhibits significant species-specific differences, functioning as a highly specific marker in humans but a more complex and less specific one in mice. Robust experimental design, incorporating multi-marker panels (including CD80/CD86 for M1) and stringent species-matched controls, is non-negotiable for accurate phenotypic characterization in translational macrophage research.
1. Introduction This whitepaper presents an in-depth technical analysis of methodologies for characterizing macrophage polarization, specifically within the context of M1 (classically activated) and M2 (alternatively activated) phenotypes. The core thesis focuses on the critical assessment of surface markers CD80/CD86 for M1 and CD163/CD206 for M2 macrophages, comparing the utility, accuracy, and biological relevance of measuring their messenger RNA (mRNA) levels versus their protein expression. This guide is intended to equip researchers with the experimental frameworks necessary for robust polarization studies in immunology and therapeutic development.
2. Marker Overview and Biological Significance Macrophage polarization is a plastic continuum, with surface markers serving as key operational identifiers.
- CD80/CD86 (M1-associated): Co-stimulatory molecules critical for T-cell activation. Their expression is induced by IFN-γ and LPS signaling, primarily through the NF-κB and JAK-STAT1 pathways.
- CD163 (M2-associated): A hemoglobin-haptoglobin scavenger receptor, strongly induced by IL-10 via the JAK-STAT3 pathway. It is a hallmark of anti-inflammatory and tissue-reparative functions.
- CD206 (MRC1; M2-associated): A mannose receptor involved in endocytosis and phagocytosis, upregulated by IL-4 and IL-13 via the JAK-STAT6 pathway.
3. Methodological Comparison: mRNA vs. Protein Analysis
Table 1: Core Method Comparison for Polarization Markers
| Aspect | mRNA Quantification (qRT-PCR) | Protein Expression (Flow Cytometry) |
|---|---|---|
| Primary Technique | Quantitative Reverse Transcription Polymerase Chain Reaction | Fluorescence-Activated Cell Sorting (FACS) |
| Measured Entity | Transcript abundance (copy number) | Surface protein abundance & cell distribution |
| Sensitivity | Very High (can detect low copy numbers) | High (dependent on antibody affinity & fluorochrome) |
| Throughput | High (96/384-well plates) | Moderate to High (multi-parametric) |
| Temporal Resolution | Early indicator (transcript changes precede protein) | Direct functional correlate (ligand-receptor interaction) |
| Key Limitation | May not correlate directly with functional protein due to post-transcriptional regulation. | Requires high-quality, specific antibodies; does not inform on translation rate. |
| Cost | Lower per target | Higher (antibodies, flow cytometer access) |
4. Experimental Protocols
4.1 Protocol for mRNA Analysis via qRT-PCR
- Cell Stimulation & Lysis: Differentiate human monocyte-derived macrophages (MDMs) with M-CSF (50 ng/mL, 7 days). Polarize with LPS (100 ng/mL) + IFN-γ (20 ng/mL) for M1 or IL-4 (20 ng/mL) for M2 (24-48h). Lyse cells in TRIzol reagent.
- RNA Extraction: Use chloroform phase separation, isopropanol precipitation, and 75% ethanol wash. Assess purity (A260/A280 ~2.0) and integrity (RIN > 8.5).
- cDNA Synthesis: Use 1 µg total RNA with a reverse transcriptase kit (e.g., High-Capacity cDNA Reverse Transcription Kit) using random hexamers.
- qPCR: Prepare reactions with SYBR Green or TaqMan Master Mix. Use validated primer/probe sets. Include housekeeping genes (e.g., HPRT1, GAPDH). Run in triplicate on a real-time PCR system.
- Data Analysis: Calculate ΔΔCt values relative to control (unpolarized M0) and housekeeper.
4.2 Protocol for Protein Analysis via Flow Cytometry
- Cell Stimulation & Harvest: Stimulate MDMs as in 4.1. Harvest using gentle cell dissociation buffer.
- Staining: Wash cells in FACS buffer (PBS + 2% FBS). Fc-block with human IgG (10 min, 4°C). Stain with fluorescently conjugated antibodies against CD80-FITC, CD86-PE, CD163-APC, CD206-PerCP-Cy5.5 (or compatible panel, 30 min, 4°C, dark). Include isotype controls.
- Fixation: Fix cells in 1-4% paraformaldehyde (PFA).
- Acquisition & Analysis: Acquire data on a flow cytometer (calibrated with compensation beads). Analyze using FlowJo. Gate on single, live cells. Report as Median Fluorescence Intensity (MFI) and/or percentage of positive cells.
5. Data Correlation and Interpretation A critical step is correlating mRNA and protein data. Discrepancies are common and informative.
Table 2: Representative Correlation Data from Recent Studies
| Marker | Typical mRNA-Protein Correlation | Notes & Common Discrepancies |
|---|---|---|
| CD80 | Moderate to High | Strong TLR/NF-κB drive aligns transcription and translation. |
| CD86 | Moderate | Constitutive expression; protein turnover can lag transcriptional changes. |
| CD163 | High | STAT3 signaling strongly couples transcription, translation, and rapid surface deployment. |
| CD206 | Low to Moderate | Highly regulated by post-translational trafficking, recycling, and shedding; protein levels may not reflect MRC1 transcript directly. |
6. Signaling Pathways in Marker Regulation
Diagram 1: Key Signaling Pathways Driving Marker Expression
7. Integrated Experimental Workflow
Diagram 2: Integrated Workflow for mRNA and Protein Analysis
8. The Scientist's Toolkit: Research Reagent Solutions
Table 3: Essential Reagents for Macrophage Polarization Studies
| Reagent / Material | Function / Specificity | Example & Notes |
|---|---|---|
| Recombinant Human M-CSF | Drives monocyte differentiation into M0 macrophages. | PeproTech #300-25; Critical for consistent baseline generation. |
| Polarizing Cytokines | Induce specific polarization states. | M1: LPS (Sigma #L4391) + IFN-γ (PeproTech #300-02). M2: IL-4 (PeproTech #200-04). |
| Anti-human CD80 Antibody | Flow cytometry detection of M1 marker. | Clone 2D10 (BioLegend #305207); Check conjugation for panel compatibility. |
| Anti-human CD86 Antibody | Flow cytometry detection of M1 marker. | Clone IT2.2 (BioLegend #305405). |
| Anti-human CD163 Antibody | Flow cytometry detection of M2 marker. | Clone GHI/61 (BioLegend #333605); High specificity for monocytes/macrophages. |
| Anti-human CD206 Antibody | Flow cytometry detection of M2 marker. | Clone 15-2 (BioLegend #321135). |
| RNA Isolation Reagent | Maintains RNA integrity during cell lysis. | TRIzol (Thermo Fisher) or equivalent phenol-guanidine isothiocyanate. |
| qPCR Assay | Gene-specific quantification of mRNA. | TaqMan Gene Expression Assays (Thermo Fisher): CD80 (Hs01045161m1), CD86 (Hs01567026m1), CD163 (Hs00174705m1), MRC1 (Hs00267207m1). |
| Flow Cytometry Buffer | Preserves cell viability and reduces non-specific binding. | PBS + 2% Fetal Bovine Serum (FBS) + 0.1% Sodium Azide. |
| Viability Dye | Distinguishes live from dead cells in flow cytometry. | Fixable Viability Dye eFluor 780 (Invitrogen); Used prior to fixation. |
1. Introduction Within the expanding field of macrophage immunology, the classification of M1 and M2 polarization states is fundamental. While surface markers like CD80/CD86 (M1-associated) and CD163/CD206 (M2-associated) provide a convenient phenotypic snapshot, their expression alone is insufficient for definitive classification. This whitepaper details a rigorous framework for benchmarking these surface marker profiles against functional gold standards: cytokine secretion profiles and quantitative functional assays. This correlative approach is critical for validating findings in basic research and for developing robust biomarkers in therapeutic contexts, such as cancer immunotherapy or fibrosis.
2. Gold Standard Correlates: Cytokine Profiles and Functional Readouts The definitive characterization of macrophage polarization requires moving beyond surface markers to measure secretory outputs and cellular functions.
2.1 Cytokine Secretion Profiles Quantification of cytokine production via ELISA or multiplex bead arrays (e.g., Luminex) remains the primary biochemical gold standard. Table 1: Canonical M1 vs. M2 Cytokine and Functional Profiles
| Polarization State | Key Surface Markers | Gold-Standard Cytokine Secretion | Characteristic In Vitro Functional Assay |
|---|---|---|---|
| Classical M1 | CD80, CD86, HLA-DR (High) | High: TNF-α, IL-1β, IL-6, IL-12, CXCL10 | Bactericidal/Killing Assay (e.g., S. aureus); Nitrite (Griess) Assay |
| Alternative M2 | CD163, CD206, CD209, CD301 | High: IL-10, TGF-β, CCL17, CCL18, CCL22 | Phagocytosis Assay (e.g., pHrodo-labeled targets); Arginase Activity Assay |
2.2 Quantitative Functional Assays
- M1 Functional Assay – Nitric Oxide Production:
- Protocol: Cells are stimulated with LPS (100 ng/mL) + IFN-γ (20 ng/mL) for 24-48h. Cell culture supernatant (50-100 µL) is mixed with an equal volume of Griess Reagent (1% sulfanilamide, 0.1% NEDD in 2.5% phosphoric acid). Absorbance is measured at 540-550 nm. Sodium nitrite standard curve required.
- M2 Functional Assay – Arginase Activity:
- Protocol: Cell lysate is incubated with 10 mM MnCl₂ and 0.5 M L-arginine (pH 9.7) at 37°C for 1-2h. Reaction is stopped with acid mixture. Urea produced is quantified by adding α-isonitrosopropiophenone and heating at 95°C for 30 min. Absorbance is read at 540-550 nm.
3. Integrated Experimental Workflow for Benchmarking A stepwise protocol ensures correlative data.
3.1 Protocol: Parallel Phenotypic and Functional Analysis
- Macrophage Differentiation & Polarization: Differentiate human monocytes with M-CSF (50 ng/mL, 5-7 days) or GM-CSF (20 ng/mL, 5-7 days). Polarize with LPS+IFN-γ or IL-4+IL-13 (20 ng/mL each) for 24-48h.
- Surface Marker Analysis: Harvest cells. Stain with fluorochrome-conjugated antibodies against CD80, CD86, CD163, CD206, and appropriate isotype controls. Analyze via flow cytometry. Report Median Fluorescence Intensity (MFI) and percent positive population.
- Supernatant Collection: Collect culture supernatant from parallel wells, centrifuge to remove debris, and store at -80°C.
- Cytokine Profiling: Analyze supernatant using multiplex cytokine array or individual ELISAs for TNF-α/IL-12 (M1) and IL-10/CCL18 (M2).
- Functional Assay Execution: Perform Griess assay (M1) or arginase/phagocytosis assay (M2) on separate parallel cultures or lysates.
3.2 Data Correlation Analysis
- Perform linear regression or Spearman correlation analysis between surface marker MFI (e.g., CD206) and functional readout values (e.g., IL-10 pg/mL or arginase activity U/mg protein).
- Strong positive correlations (e.g., r > 0.8, p < 0.001) validate the surface marker as a reliable proxy for the functional state.
4. The Scientist's Toolkit: Essential Research Reagents Table 2: Key Reagent Solutions for Macrophage Benchmarking Studies
| Reagent/Category | Example Product/Assay | Primary Function in Benchmarking |
|---|---|---|
| Polarization Cytokines | Recombinant human GM-CSF, M-CSF, IFN-γ, IL-4, IL-13 | Induce and direct macrophage polarization states. |
| Flow Cytometry Antibodies | Anti-human CD80-FITC, CD86-PE, CD163-APC, CD206-PerCP-Cy5.5 | Quantify surface marker expression phenotypically. |
| Multiplex Cytokine Array | Luminex Human Cytokine 30-Plex Panel | Simultaneously quantify a broad panel of secreted proteins from limited sample volume. |
| Functional Assay Kits | Griess Reagent Kit; Quantitative Arginase Assay Kit; pHrodo BioParticles Phagocytosis Kit | Provide standardized, quantitative measures of M1 (NO) or M2 (arginase, phagocytosis) function. |
| Cell Isolation Kits | CD14+ MicroBeads (human) | Isolate primary monocytes from PBMCs for consistent differentiation. |
5. Signaling Pathways Underlying Correlations The correlation between surface markers and function is rooted in shared signaling pathways.
Diagram Title: Signaling Pathways Linking Stimuli to M1/M2 Markers and Function
Diagram Title: Integrated Benchmarking Workflow from Cells to Data
6. Conclusion Rigorous benchmarking of CD80, CD86, CD163, and CD206 expression against cytokine profiles and functional assays is non-negotiable for accurate macrophage characterization. The integrated protocols and correlation analyses outlined here provide a robust technical framework. This approach ensures that surface marker data, often central to high-throughput screening or diagnostic applications, is biologically meaningful and functionally validated, thereby strengthening conclusions drawn in both basic macrophage biology and translational drug development.
The classification of macrophages into canonical M1 (classically activated) and M2 (alternatively activated) phenotypes has long relied on a set of traditional surface protein markers. Chief among these are CD80 and CD86 for M1, and CD163 and CD206 (MRC1) for M2 macrophages. This framework, while foundational, is increasingly challenged by the high-resolution heterogeneity revealed by single-cell RNA sequencing (scRNA-seq). This whitepaper explores the congruence and discordance between these established protein markers and transcriptomically-defined cell states, focusing on the implications for research and drug development in immunology and oncology.
The Traditional Marker Paradigm: M1 vs. M2
The traditional model posits a dichotomous activation state, driven by specific cytokine milieus and defined by surface marker expression and functional output.
Table 1: Core Traditional Macrophage Phenotype Markers
| Phenotype | Inducing Signals | Key Surface Markers | Proposed Function |
|---|---|---|---|
| M1 | IFN-γ, LPS, GM-CSF | CD80 (B7-1), CD86 (B7-2), HLA-DR, CD64 | Pro-inflammatory, microbicidal, anti-tumoral, antigen presentation. |
| M2 | IL-4, IL-13, IL-10, Glucocorticoids | CD163, CD206 (MRC1), CD209, ARG1 | Anti-inflammatory, tissue repair, pro-angiogenic, immunoregulatory. |
This model has been instrumental but is recognized as an oversimplification of a spectrum of activation states.
The scRNA-Seq Revolution: Revealing a Spectrum of States
scRNA-seq enables unbiased clustering of cells based on whole-transcriptome profiles, revealing numerous distinct and often overlapping macrophage subsets within tissues that do not cleanly align with M1/M2 binaries. Recent studies (2023-2024) in tumor microenvironments (TME), atherosclerosis, and fibrosis consistently identify 5-10 distinct macrophage subsets.
Table 2: Example Macrophage Subsets Identified by scRNA-seq in Human Tumors (2023-24 Meta-Analysis)
| Cluster Name | Hallmark Gene Signatures | Partial Overlap with Traditional | Key Functional Annotations |
|---|---|---|---|
| SPP1+ TAM | SPP1, APOE, MMP9, FABP5 | M2-like (CD163+) | Lipid metabolism, extracellular matrix remodeling, immunosuppression. |
| IRF7+ TAM | ISG15, IRF7, IFIT3 | Mixed (Low CD80/86) | Type I IFN response, antigen processing, potentially pro-inflammatory. |
| C1Q+ TAM | C1QA, C1QB, C1QC, FOLR2 | M2-like (CD206+) | Complement activity, tissue surveillance, homeostasis. |
| MARCKS+ TAM | MARCKS, IL1B, CXCL8 | M1-like (Variable CD86) | Pro-inflammatory, neutrophil recruitment. |
| Proliferating | MKI67, TOP2A, PCNA | None | Cell cycle activity. |
Quantitative analysis shows that traditional marker genes are expressed in a combinatorial, gradient manner across these subsets. For instance, CD163 expression is high in SPP1+ and C1Q+ clusters but absent in others, while CD86 can be detected at low levels across multiple clusters, not exclusively in those with inflammatory signatures.
Concordance and Discordance: Integrating Protein and RNA Data
Multimodal single-cell technologies (CITE-seq, REAP-seq) that measure surface protein and RNA simultaneously provide the most direct comparison.
Key Findings from Recent Integrated Studies:
- Strong Correlation for Some Markers: CD163 mRNA and protein show high concordance, robustly identifying a broad "M2-like" compartment.
- Moderate-to-Poor Correlation for Others: CD206 (MRC1) protein can be present even when mRNA is low, suggesting post-transcriptional regulation or protein stability.
- Binary vs. Gradient: Traditional markers often appear as a "present/absent" signal in flow cytometry. scRNA-seq reveals a continuous expression spectrum, where intermediate levels have biological significance.
- Context-Dependent Expression: CD80 and CD86 expression is not exclusive to "M1" macrophages; it can be upregulated on specific subsets within tumors upon checkpoint inhibitor therapy, associating with antigen presentation capacity rather than a pure inflammatory state.
Table 3: Correlation of Traditional Marker RNA vs. Protein Expression in Tumor-Associated Macrophages (CITE-seq Data)
| Marker | RNA-Protein Correlation (Pearson r)* | Specificity for Classic Phenotype | Notes |
|---|---|---|---|
| CD163 | 0.85 - 0.92 | High for M2 | Reliable transcriptomic proxy for protein. Defines a core resident-like population. |
| CD206 (MRC1) | 0.45 - 0.60 | Moderate for M2 | Protein expression is broader than mRNA. Key for endocytic function. |
| CD86 | 0.70 - 0.78 | Low for M1 | Expressed across clusters. Better correlate of activation state than polarization. |
| CD80 | 0.65 - 0.72 | Very Low for M1 | Often co-expressed with CD86 but at lower levels. More regulated post-translationally. |
*Representative range from recent published datasets.
Experimental Protocols for Validation
Protocol 1: Multimodal Validation of Markers via CITE-seq
- Objective: To simultaneously profile transcriptomic and surface protein expression in macrophage populations.
- Workflow:
- Sample Preparation: Generate human monocyte-derived macrophages (hMDMs) with M1 (IFN-γ+LPS) or M2 (IL-4) stimuli, or dissociate fresh tissue (e.g., tumor).
- Antibody Staining: Stain live single-cell suspension with a panel of TotalSeq-C antibodies (e.g., anti-human CD80, CD86, CD163, CD206, HLA-DR, CD45).
- Cell Hashing: Pool samples using TotalSeq-H antibodies for multiplexing.
- Library Preparation: Process cells using 10x Genomics Chromium Next GEM Single Cell 5' v2 with Feature Barcoding technology. Generate separate cDNA and Antibody-Derived Tag (ADT) libraries.
- Sequencing & Analysis: Sequence on an Illumina platform. Align RNA reads to a reference genome and ADT reads to the antibody barcode reference. Use Seurat or Scanpy to analyze RNA and protein modalities jointly, performing clustering and correlation analysis.
Protocol 2: Functional Validation of a scRNA-seq-Defined Subset
- Objective: To isolate and functionally characterize a novel macrophage subset (e.g., SPP1+ TAMs) identified by scRNA-seq.
- Workflow:
- Identification: From scRNA-seq data, define a unique surface signature for the target subset (e.g., high CD163, high CD9, low MHC-II).
- FACS Isolation: Design a flow cytometry panel based on the signature. Sort the target population from a fresh single-cell suspension.
- Functional Assays:
- Phagocytosis: Incubate with pHrodo-labeled beads or tumor cells and measure uptake by flow cytometry.
- T-cell Suppression: Co-culture sorted macrophages with autologous CFSE-labeled T-cells stimulated with anti-CD3/CD28. Measure T-cell proliferation via CFSE dilution.
- Secretome Analysis: Culture sorted cells for 24h and analyze supernatant via Luminex cytokine array.
- Transcriptomic Confirmation: Perform bulk RNA-seq on sorted populations to confirm the original scRNA-seq signature.
Visualizing the Integration Framework
Title: Integration of Traditional Markers with scRNA-seq Classification
Title: CITE-seq Experimental Workflow for Multimodal Validation
The Scientist's Toolkit: Essential Research Reagents
Table 4: Key Research Reagent Solutions for Integrated Macrophage Studies
| Reagent Category | Specific Example | Function in Research | Key Vendor(s) |
|---|---|---|---|
| Multimodal scRNA-seq Antibodies | TotalSeq-C, BioLegend; CITE-seq Antibodies, Bio-Rad | Oligo-tagged antibodies for simultaneous surface protein detection and scRNA-seq. | BioLegend, Bio-Rad, 10x Genomics |
| Cell Hashing Antibodies | TotalSeq-H, BioLegend | Allows sample multiplexing by labeling cells from different conditions with unique barcodes. | BioLegend |
| Single-Cell Library Prep Kits | Chromium Next GEM Single Cell 5' v2 with Feature Barcoding, 10x Genomics | Integrated workflow for generating RNA and antibody-derived tag (ADT) libraries. | 10x Genomics |
| Cytokines for Polarization | Recombinant Human IFN-γ, IL-4, IL-13, M-CSF | Generation of traditional M1 and M2 macrophage phenotypes in vitro for comparative studies. | PeproTech, R&D Systems |
| Validated Flow Cytometry Antibodies | Anti-human CD80, CD86, CD163, CD206 (multiple clones) | Validation and sorting of populations identified by scRNA-seq signatures. | BD Biosciences, BioLegend, Thermo Fisher |
| Spatial Transcriptomics Platforms | Visium CytAssist, 10x Genomics; CosMx SMI, NanoString | Contextualizes scRNA-seq clusters within tissue architecture and validates marker localization. | 10x Genomics, NanoString |
| Functional Assay Kits | pHrodo BioParticles Phagocytosis Kit; T-cell Proliferation CFSE Kit | Measures functional outputs of sorted or engineered macrophage subsets. | Thermo Fisher, Abcam |
Traditional markers like CD80, CD86, CD163, and CD206 remain valuable as components of a larger signature, not as definitive classifiers. They are best used in conjunction with scRNA-seq-derived gene signatures to define macrophage subsets with specific functional capacities and tissue localizations. The future of macrophage research lies in multi-omic integration (transcriptome, proteome, epigenome, spatial context) to move beyond static phenotypes towards dynamic, functional states. This refined understanding is critical for developing next-generation therapeutics, such as those targeting specific TAM subsets in cancer or disease-associated microglia in neurodegeneration.
Within macrophage immunobiology research, the polarization states of macrophages (classically activated pro-inflammatory M1 and alternatively activated anti-inflammatory/pro-resolving M2) are central to understanding disease mechanisms in cancer, fibrosis, and autoimmune disorders. The surface markers CD80/CD86 (associated with M1) and CD163/CD206 (associated with M2) are critical phenotypic identifiers. However, significant inter-laboratory variability in assay protocols, reagent selection, and data analysis undermines the reproducibility of findings and the validity of cross-study comparisons. This whitepaper establishes a framework for inter-laboratory validation using standardized reference standards and controls, which is essential for advancing robust biomarker discovery and therapeutic development targeting macrophage polarization.
The Imperative for Standardization in Macrophage Marker Research
Quantitative flow cytometry, the primary technique for surface marker quantification, is highly susceptible to technical variance. Key sources of variability include:
- Antibody Clone and Conjugate: Different clones recognizing distinct epitopes on CD80, CD86, CD163, or CD206 yield varying signal intensities.
- Instrument Calibration: Flow cytometer laser power, detector sensitivity, and fluorescence compensation settings differ between instruments and over time.
- Cell Source and Culture: Primary human monocyte-derived macrophages (MDMs) vs. murine bone marrow-derived macrophages (BMDMs) vs. cell lines (e.g., THP-1) have inherent biological variability. Polarization protocols (e.g., IFN-γ/LPS for M1, IL-4/IL-13 for M2) are not uniform.
- Gating Strategies: Subjective manual gating versus automated analysis introduces bias.
Without standardized references, declaring a population as "M1" or "M2" based on marker expression is unreliable for meta-analysis or translational work.
Core Components of a Validation Framework
Reference Standards
Reference standards are stable, well-characterized materials used to calibrate measurement systems.
- Stabilized Cell Lines: Genetically engineered cell lines expressing fixed, known levels of a target marker (e.g., CHO cells expressing CD206). These provide a stable signal for instrument calibration and inter-assay comparison.
- Reconstituted Protein Standards: Lyophilized recombinant proteins (e.g., soluble CD163) for validating ELISA or Western blot quantitation across labs.
Biological Controls
Controls are test samples with expected outcomes, processed identically to experimental samples.
- Polarization Control Cells: Aliquots of a standardized macrophage population (e.g., cryopreserved, cytokine-polarized MDMs) shipped to all participating laboratories. Expression levels of CD80/CD86 and CD163/CD206 are pre-defined by a central reference lab using a validated assay.
- Isotype and Negative Controls: Critical for defining positive gates in flow cytometry. Must be standardized alongside specific antibodies.
Quantitative Data on Marker Variability
The following table summarizes reported expression ranges for key markers under different polarization conditions, illustrating the inherent biological variability that standardization must address.
Table 1: Reported Expression Ranges of Macrophage Surface Markers
| Marker | Associated Phenotype | Common Stimulus | Cell Source | Reported Mean Fluorescence Intensity (MFI) or % Positive Range | Key Source of Variability |
|---|---|---|---|---|---|
| CD80 | M1 | IFN-γ + LPS | Human MDM | MFI: 1,500 - 15,000 | Antibody clone, LPS concentration, donor variability |
| CD86 | M1 (also constitutive) | IFN-γ | Murine BMDM | % Positive: 60% - 95% | Culture time post-stimulation, gating strategy |
| CD163 | M2 (Hemoglobin Scavenger) | IL-10 | Human MDM | MFI: 5,000 - 50,000 | Soluble shedding, donor health status |
| CD206 | M2 (MMR) | IL-4 | THP-1 / Murine BMDM | % Positive: 20% - 80% | IL-4 exposure duration, cell differentiation protocol |
Experimental Protocol for an Inter-Laboratory Comparison Study
This protocol outlines a systematic approach for validating marker analysis across multiple sites.
Title: Inter-Laboratory Validation of M1/M2 Macrophage Markers via Flow Cytometry. Objective: To assess the reproducibility of quantifying CD80, CD86, CD163, and CD206 expression across different laboratories using shared reference materials. Materials: See "The Scientist's Toolkit" below. Procedure:
- Central Preparation & Distribution: A central coordinating laboratory generates and characterizes the following:
- Calibration Beads: Aliquots of premixed fluorescence quantification beads.
- Reference Cell Standard: A large batch of stabilized cells with fixed marker expression (low, medium, high for each marker). Fixed, aliquoted, and cryopreserved.
- Polarized Biological Controls: Cryopreserved vials of human MDMs polarized toward M1 (IFN-γ/LPS) and M2 (IL-4/IL-13) states.
- Master Antibody Panel: Pre-titrated, aliquoted antibody cocktails for human markers: CD80-FITC, CD86-PE, CD163-APC, CD206-PE/Cy7, CD14-PerCP (lineage), and viability dye.
- Participant Lab Processing (Day 1):
- Thaw reference cell standard and biological controls using a standardized protocol.
- Resuspend in pre-defined culture medium, rest for 4 hours at 37°C.
- Staining and Acquisition (Day 1):
- Count cells. Distribute 1e5 cells per stain tube (including isotype controls).
- Follow centralized staining protocol: Wash, Fc block, stain with 100µL of master antibody cocktail for 30 min at 4°C in the dark.
- Wash twice, fix with 1% PFA.
- Instrument Calibration: Prior to sample acquisition, run calibration beads. Adjust PMT voltages to achieve target MFI values for each channel as specified by the central lab.
- Data Acquisition & Analysis (Day 1-2):
- Acquire all samples on flow cytometer, ensuring ≥10,000 live, single-cell events are recorded for the biological controls.
- Centralized Gating Template: Apply a standardized gating strategy file (.gsm for FlowJo or .wsp for FACS Diva) provided by the central lab. The template defines sequential gates for single cells > live cells > CD14+ > marker analysis.
- Export MFI and % positive values for each marker from the gated populations.
- Data Submission & Statistical Analysis (Central Lab):
- Participating labs submit raw FCS files and derived data.
- Key Metrics: Calculate inter-laboratory coefficient of variation (%CV) for the MFI of each marker on the reference standard and biological controls.
- Acceptance Criterion: A successful validation achieves an inter-lab %CV of <20% for the reference standard MFI and correct classification (M1 vs. M2) of biological controls by all participants.
Visualizing the Validation Workflow and Biology
Title: Inter-Lab Validation Workflow
Title: Macrophage Polarization and Key Surface Markers
The Scientist's Toolkit: Essential Research Reagents
Table 2: Key Reagent Solutions for Standardized Macrophage Marker Analysis
| Reagent / Material | Function & Importance in Standardization |
|---|---|
| Fluorescent Calibration Beads | Contains multiple populations with defined fluorescence intensities. Used to standardize instrument settings (PMT voltages) across labs and time, enabling MFI comparison. |
| Stabilized Reference Cell Standard | Engineered cells with consistent, known antigen density. Serves as an internal calibrator to correct for day-to-day and inter-instrument variance in antibody staining intensity. |
| Master Antibody Cocktail | A pre-mixed, pre-titrated panel of fluorochrome-conjugated antibodies sourced from single lots. Eliminates variability from clone differences, titration, and lot-to-lot reagent changes. |
| Cryopreserved Polarized Macrophages | Biological process controls. Provides a standardized sample to test the entire workflow from thaw to analysis, ensuring labs can correctly identify expected phenotypes. |
| Standardized Gating Template | A pre-configured software file (e.g., FlowJo .gsm) that enforces consistent gating hierarchies for live cells, singlets, lineage, and marker positivity. Reduces analytical subjectivity. |
| Viability Dye (Fixable) | Distinguishes live from dead cells. Dead cells cause non-specific antibody binding; excluding them is critical for accurate marker quantification. Must be used consistently. |
Conclusion
The precise identification of macrophage subsets via surface markers CD80, CD86, CD163, and CD206 remains a cornerstone of immunology research, yet it requires a nuanced and critical approach. This synthesis underscores that these markers serve as powerful, though not infallible, indicators of functional polarization states within a dynamic spectrum. Researchers must integrate methodological rigor—through optimized panel design, stringent controls, and validation against functional outputs—with an awareness of biological context and plasticity. Future directions point toward multidimensional profiling that combines these canonical surface proteins with transcriptional, metabolic, and spatial data to define macrophage roles more accurately in health and disease. For drug development, this refined understanding is pivotal for designing therapies that can precisely modulate macrophage function in cancer immunotherapy, fibrotic diseases, and chronic inflammation, moving beyond simple M1/M2 dichotomies to target specific pathogenic states.