Paired Analysis of JAK-STAT Activation: Unveiling Molecular Dichotomy in Inflamed vs. Non-Inflamed Tissue for Precision Medicine
This comprehensive guide provides researchers and drug development professionals with a detailed framework for analyzing JAK-STAT signaling activation in paired inflamed and adjacent non-inflamed tissue samples.
Paired Analysis of JAK-STAT Activation: Unveiling Molecular Dichotomy in Inflamed vs. Non-Inflamed Tissue for Precision Medicine
Abstract
This comprehensive guide provides researchers and drug development professionals with a detailed framework for analyzing JAK-STAT signaling activation in paired inflamed and adjacent non-inflamed tissue samples. The article explores the foundational biological and clinical rationale for this paired design, outlines current best-practice methodologies from sample procurement to data analysis, addresses critical troubleshooting and optimization strategies, and provides a framework for validation and comparative analysis against other techniques. By synthesizing these four core intents, this resource aims to standardize and enhance the precision of pathway analysis in chronic inflammatory diseases, directly informing biomarker discovery and therapeutic targeting.
The Rationale for Paired Tissue Analysis: Decoding Spatial Heterogeneity in JAK-STAT Signaling
Application Notes
This application note provides a methodological framework for analyzing JAK-STAT pathway activation within paired inflamed and non-inflamed tissue samples, a cornerstone of research into chronic inflammatory diseases such as Inflammatory Bowel Disease (IBD), psoriasis, and rheumatoid arthritis. Dysregulation of this pathway is a hallmark of disease pathogenesis, with specific cytokine signatures driving STAT activation.
Key Quantitative Findings in Paired Tissue Research: Recent studies consistently demonstrate elevated phosphorylation (activation) of specific STAT proteins in inflamed versus adjacent non-inflamed tissue. The specific STAT involved varies by disease, reflecting the local cytokine milieu.
Table 1: Representative JAK-STAT Activation Metrics in Paired Human Tissue Studies
| Disease (Tissue) | Key Cytokine Driver | Primary Activated STAT | Fold-Change in p-STAT (Inflamed vs. Non-Inflamed) | Common Detection Method | Reference Year |
|---|---|---|---|---|---|
| Ulcerative Colitis (Colon) | IL-6, IL-23 | STAT3 | 3.5 - 8.2 | IHC / Western Blot | 2023 |
| Crohn's Disease (Ileum) | IFN-γ, IL-12 | STAT1 / STAT4 | 4.1 (STAT1) | Multiplex IHC / Phosflow | 2024 |
| Psoriasis (Skin) | IL-23, IL-22 | STAT3 | 6.0 - 10.0 | IHC, p-STAT3 ELISA | 2023 |
| Rheumatoid Arthritis (Synovium) | IL-6, GM-CSF | STAT3 / STAT5 | 5.2 (STAT3) | Imaging Mass Cytometry | 2024 |
| Atopic Dermatitis (Skin) | IL-4, IL-13 | STAT6 | 4.8 | Western Blot | 2023 |
Interpretation: The data underscore STAT3 as a central node across multiple diseases, while STAT1/4 and STAT6 activation denote Th1/Th17 and Th2 polarization, respectively. Quantitative differences highlight pathway heterogeneity and inform targeted therapeutic strategies (e.g., JAK1/TYK2 vs. JAK3 inhibition).
Detailed Experimental Protocols
Protocol 1: Laser Capture Microdissection (LCM) Coupled with Reverse-Phase Protein Array (RPPA) for JAK-STAT Analysis
Objective: To obtain precise, cell-type-specific phosphorylation profiles of JAK-STAT components from histologically defined regions of paired formalin-fixed, paraffin-embedded (FFPE) tissues.
Workflow Diagram Title: LCM-RPPA Workflow for Tissue Analysis
Materials & Reagents:
- Paired FFPE tissue blocks (inflamed and adjacent non-inflamed).
- LCM-compatible slides and membrane caps (Arcturus).
- Phospho-safe protein lysis buffer (e.g., CST #9803) with 1x protease/phosphatase inhibitors.
- Validated primary antibodies for phospho- and total-STATs (Cell Signaling Technology recommended).
- RPPA nitrocellulose-coated slides.
- Fluorescent-conjugated secondary antibodies (IRDye 680/800).
Procedure:
- Cut 5-8 µm serial FFPE sections. Perform H&E and brief immunofluorescence (IF) staining (≤10 mins) for lineage markers (e.g., CD45 for immune cells) to guide LCM.
- Using the LCM system, separately capture target cell populations (≥1000 cells) from matched regions of inflamed and non-inflamed sections.
- Digest captured cells in 15-20 µL of lysis buffer for 1 hour. Heat denature.
- Spot lysates in triplicate onto RPPA slides using an arrayer.
- Perform automated immunostaining on the RPPA slides with validated antibodies. Include dilution curves of control lysates for normalization.
- Scan slides with a fluorescence scanner. Analyze spot intensity using ArrayPro Analyzer.
- Normalize phospho-signal to total protein and housekeeping genes. Calculate fold-change (inflamed/non-inflamed).
Protocol 2: Spatial Phospho-Profiling by Multiplex Immunofluorescence (mIF)
Objective: To visualize the co-localization and activation state of JAK-STAT proteins within the tissue architecture of paired samples.
Workflow Diagram Title: Multiplex IF for Spatial STAT Analysis
Materials & Reagents:
- Opal TSA multiplex fluorescence kit (Akoya Biosciences).
- Primary antibodies validated for mIF (phospho-STATs, lineage markers).
- Microwave or steamer for heat-induced epitope retrieval (HIER).
- Epifluorescence or confocal microscope with automated slide scanning.
- Image analysis software (e.g., HALO, QuPath).
Procedure:
- Deparaffinize and rehydrate FFPE sections. Perform HIER in citrate buffer (pH 6.0).
- For each cycle: block, apply primary antibody, apply HRP-conjugated secondary, apply Opal fluorophore TSA, perform HIER to strip antibodies.
- Repeat Cycle for each marker in the panel. Finally, counterstain with DAPI and apply anti-fade mounting medium.
- Acquire high-resolution images of the same region in both tissue pairs using consistent exposure.
- Use software to segment cells based on DAPI/lineage markers. Quantify p-STAT mean fluorescence intensity (MFI) within each cell phenotype in defined tissue compartments.
Protocol 3: Single-Cell RNA Sequencing (scRNA-seq) Analysis of JAK-STAT Pathway Genes
Objective: To dissect the cell-type-specific transcriptional response downstream of JAK-STAT activation in disaggregated paired tissues.
Procedure Summary:
- Tissue Processing: Fresh paired tissues are mechanically and enzymatically (Collagenase IV/DNase I) dissociated into single-cell suspensions. Live cells are sorted (e.g., FACS, dead cell removal kit).
- Library Preparation: Cells from inflamed and non-inflamed samples are uniquely barcoded during cDNA synthesis using a platform like 10x Genomics. Libraries are pooled and sequenced.
- Bioinformatics Analysis:
- Clustering & Annotation: Process data (Cell Ranger -> Seurat). Cluster cells and annotate using canonical markers.
- Pathway Activity: Calculate JAK-STAT pathway activity scores (e.g., using AUCell, AddModuleScore) based on expression of known target genes (e.g., SOCS3, PIM1, BCL2L1 for STAT3).
- Differential Analysis: Compare pathway scores and expression of individual JAK/STAT transcripts within each cell type across inflamed vs. non-inflamed conditions.
Signaling Pathway Diagram Title: Core JAK-STAT Inflammatory Signaling
The Scientist's Toolkit: Key Research Reagent Solutions
Table 2: Essential Materials for JAK-STAT Analysis in Paired Tissues
| Item / Reagent | Function & Application in Paired Tissue Research | Example Product / Vendor |
|---|---|---|
| Phospho-Specific Antibodies | Critical for detecting activated (phosphorylated) STATs via IHC, WB, or flow. Must be validated for FFPE. | Phospho-STAT3 (Tyr705) (D3A7) XP Rabbit mAb #9145 (Cell Signaling Technology) |
| Multiplex IHC/IF Kits | Enable simultaneous detection of p-STATs and lineage markers in a single tissue section, preserving spatial context. | Opal 7-Color Manual IHC Kit (Akoya Biosciences) |
| Live Cell Isolation Kits | Generate viable single-cell suspensions from tough fibrous tissues (synovium, skin) for scRNA-seq or phospho-flow. | Human Tumor Dissociation Kit (Miltenyi Biotec) |
| Phosphoprotein Stabilizers | Preserve the in vivo phosphorylation state during tissue processing for ex vivo analysis (e.g., phospho-flow). | Phosflow Fix Buffer I (BD Biosciences) |
| JAK/STAT Inhibitors (Tool Compounds) | Used as in vitro controls to confirm pathway specificity in primary cell assays from isolated tissues. | Tofacitinib (JAK1/3 inhibitor), Ruxolitinib (JAK1/2 inhibitor) (Selleckchem) |
| Barcoded scRNA-seq Kits | Allow multiplexing of cells from paired inflamed/non-inflamed samples in a single run, reducing batch effects. | 10x Genomics Chromium Single Cell 5' v3 |
| Spatial Transcriptomics Kits | Correlate JAK-STAT pathway gene expression with histological location in intact tissue sections. | Visium Spatial Gene Expression (10x Genomics) |
Introduction Within inflammatory diseases (e.g., inflammatory bowel disease [IBD], psoriasis, rheumatoid arthritis), the "Paired Paradigm" refers to the comparative analysis of lesional (inflamed) tissue and adjacent, macroscopically normal (non-inflamed) tissue from the same patient. This paradigm is central to distinguishing disease-specific, localized molecular alterations from inherent patient background biology. Within our thesis on JAK-STAT activation analysis, this approach is critical for identifying true pathogenic signaling hubs versus systemic bystander effects, directly informing targeted therapeutic development.
Key Quantitative Findings in Paired Tissue Research Table 1: Representative Molecular Disparities in Paired Inflamed vs. Non-Inflamed Tissue
| Analytical Target | Disease Context | Key Finding in Inflamed vs. Non-Inflamed | Reported Magnitude of Change | Significance |
|---|---|---|---|---|
| p-STAT3 (Phospho-protein) | Ulcerative Colitis | Elevated nuclear localization in inflamed lamina propria. | 3- to 5-fold increase (IHC scoring). | Confirms localized JAK-STAT pathway activation. |
| IL-23/IL-17 Axis Cytokines (mRNA) | Psoriasis Vulgaris | Upregulation of IL23A, IL17A, IL17F. | 10- to 100-fold increase (qPCR). | Highlights key therapeutic target pathway. |
| Microbiome Diversity (16S rRNA) | Crohn's Disease | Reduced microbial α-diversity in mucosal biopsies. | Shannon Index decrease of 25-40%. | Links local inflammation to dysbiosis. |
| Epithelial Barrier Genes (mRNA) | IBD | Downregulation of tight junction proteins (e.g., OCLN). | 2- to 8-fold decrease. | Demonstrates localized barrier dysfunction. |
| Drug Target Expression (e.g., JAK1, TYK2) | Multiple | Often elevated in inflamed tissue. | Variable; 1.5- to 4-fold increase. | Supports rationale for local/topical therapy. |
Core Experimental Protocols
Protocol 1: Procurement and Processing of Paired Tissues for Multi-Omics
- Patient Selection & Biopsy: Obtain informed consent. During endoscopic or surgical resection, collect matched tissue pairs (inflamed and non-inflamed, ≤5cm apart) using standardized biopsy forceps. Immediately place in appropriate medium (e.g., RNAlater for transcriptomics, fresh culture medium for ex vivo studies, OCT compound for frozen sections).
- Tissue Segmentation: Divide each sample into aliquots for parallel analyses: (a) snap-freezing in liquid N₂ for RNA/protein, (b) formalin-fixation and paraffin-embedding (FFPE) for histology/IHC, (c) fresh digestion for cell isolation.
- Histopathological Confirmation: Perform H&E staining on both tissue pairs. Use validated histological scoring systems (e.g., Geboes Score for colitis) to objectively confirm inflammatory status. This step is essential for validating the "non-inflamed" designation.
Protocol 2: Phospho-Protein Analysis of JAK-STAT Pathways in Paired Tissues
- Protein Extraction from Cryopreserved Tissue: Homogenize 20-30mg tissue in RIPA buffer containing phosphatase and protease inhibitors. Centrifuge at 12,000g for 15min at 4°C. Quantify supernatant protein concentration.
- Multiplex Phospho-Protein Immunoblotting: Load equal protein amounts (20-30μg) for SDS-PAGE. Use multiplex Western blotting with primary antibodies against: Targets: p-JAK1 (Y1034/1035), p-STAT3 (Y705), total STAT3, β-actin (loading control). Detection: Fluorescently-labeled secondary antibodies (e.g., IRDye).
- Quantitative Image Analysis: Acquire blot images using a fluorescence scanner. Quantify band intensity using Image Studio or ImageJ software. Normalize p-protein signal to total protein and loading control. Calculate fold-change (inflamed/non-inflamed) for each patient pair.
Protocol 3: Spatial Transcriptomics & JAK-STAT Pathway Gene Signature Mapping
- FFPE Sectioning and Preparation: Cut 5-10μm sections from paired FFPE blocks. Mount on spatial transcriptomics slides (e.g., Visium, GeoMx). Perform H&E staining and imaging.
- Region of Interest (ROI) Selection: Based on histology, manually select ROIs encompassing epithelial crypts, lamina propria, or immune aggregates in both inflamed and adjacent non-inflamed sections.
- Hybridization & Library Prep: Follow manufacturer's protocol for probe hybridization, cDNA synthesis, and indexed library construction.
- Bioinformatic Analysis: Align sequencing data to reference genome. Quantify gene expression per ROI. Perform differential expression analysis between paired ROIs. Visualize expression gradients of a JAK-STAT Activation Module (e.g., STAT1, STAT3, SOCS3, IRF1) across the tissue landscape.
Visualizations
Paired Paradigm Experimental Workflow
JAK-STAT Activation & Feedback Loop
The Scientist's Toolkit: Key Research Reagent Solutions Table 2: Essential Reagents for Paired Paradigm JAK-STAT Analysis
| Reagent / Material | Function & Application in Paired Studies | Key Consideration |
|---|---|---|
| Phospho-Specific Antibodies (e.g., anti-p-STAT3 Y705) | Detect active, phosphorylated signaling proteins in IHC or Western blot of paired tissues. Validated for FFPE tissue is critical. | Specificity must be confirmed via peptide blocking or use of phosphatas-treated controls. |
| RNAlater Stabilization Solution | Preserves RNA integrity in biopsy samples immediately upon collection, enabling accurate transcriptomic comparison. | Essential for preventing degradation-driven false differential expression. |
| Multiplex Cytokine Detection Panels (Luminex/MSD) | Quantify dozens of cytokines from tissue culture supernatants of ex vivo paired explants. | Reveals the inflammatory secretome disparity with minimal sample volume. |
| Tissue Dissociation Kits (e.g., multi-enzyme blends) | Generate single-cell suspensions from paired tissues for flow cytometry or scRNA-seq. | Optimization for each tissue type is required to maintain cell viability and surface epitopes. |
| Spatial Transcriptomics Slides (Visium, GeoMx) | Map gene expression within intact tissue architecture, linking histology to JAK-STAT pathway gene signatures. | Allows precise ROI selection from adjacent inflamed/non-inflamed zones on same slide. |
| JAK Inhibitors (Small Molecules) (e.g., Tofacitinib, Ruxolitinib) | Used as ex vivo stimulants in paired tissue cultures to confirm functional pathway dependence. | Serves as a pharmacodynamic readout and validates therapeutic relevance of targets. |
Paired analysis of inflamed and adjacent non-inflamed tissue from the same patient is a powerful paradigm in translational immunology. Within the context of JAK-STAT pathway research, this approach allows for direct comparison of pathway activation states within an identical genetic and systemic environmental background. This application note details the key research questions, protocols, and analytical tools central to this methodology, facilitating the transition from mechanistic discovery to therapeutic validation.
Paired tissue analysis addresses several stratified questions crucial for understanding disease-specific JAK-STAT biology and therapeutic response.
Table 1: Key Research Questions and Analytical Outcomes
| Research Question Tier | Specific Question | Typical Measured Endpoint | Example Finding (e.g., in Psoriasis) |
|---|---|---|---|
| 1. Mechanistic & Descriptive | Is the JAK-STAT pathway differentially activated in lesional vs. non-lesional tissue? | p-STAT1/3/5/6 levels (Western Blot/IHC); JAK/STAT/SOCS gene expression (qPCR/RNA-seq). | 5-10 fold increase in p-STAT3 in lesional epidermis. |
| 2. Cellular & Spatial | Which specific cell populations drive this activation? | Cell-type-specific phospho-flow cytometry; multiplex immunofluorescence (mIF). | CD3+ T cells and CD11c+ dendritic cells show highest p-STAT1. |
| 3. Pharmacodynamic | Does topical/oral JAK inhibitor (JAKi) exposure suppress pathway activation in the target tissue? | Post-treatment reduction in p-STAT signals (pre/post biopsy). | >70% reduction in lesional p-STAT3 after 4 weeks of JAKi treatment. |
| 4. Predictive & Translational | Does baseline pathway activation or early pharmacodynamic response correlate with clinical efficacy? | Correlation of Week 2 p-STAT inhibition with Week 12 PASI-75 response. | Patients with >80% p-STAT3 reduction at Week 2 achieve 90% PASI-75 rate. |
Experimental Protocols
Protocol 3.1: Paired Tissue Collection & Processing for Multi-Omics
Objective: To obtain matched inflamed and non-inflamed tissue samples suitable for protein, RNA, and single-cell analysis. Materials: Punch biopsy kits (3-4mm), RNAlater, OCT compound, phosphate-buffered saline (PBS), protease/phosphatase inhibitors. Procedure:
- Identification & Marking: Clearly demarcate lesional (L) and adjacent non-lesional (NL) skin (e.g., >10cm away in dermatology).
- Biopsy Collection: Using sterile technique, obtain paired 3-4mm punch biopsies. Place L and NL samples in separate, pre-labeled containers.
- Immediate Processing:
- For RNA/Protein: Bisect biopsy. One half is snap-frozen in liquid nitrogen for protein lysates. The other is submerged in RNAlater (24h, 4°C) then stored at -80°C.
- For Single-Cell/FACS: Place entire biopsy in cold PBS with 1% FBS. Process within 2 hours for tissue dissociation.
- Dissociation: Use a validated dissociation kit (e.g., human whole skin dissociation kit, enzymatic digestion 1-2h at 37°C). Filter through 70μm strainer to obtain single-cell suspension.
Protocol 3.2: Phospho-Specific Flow Cytometry for JAK-STAT Activation
Objective: To quantify cell-type-specific phosphorylation of STAT proteins from single-cell suspensions of paired tissues. Materials: Single-cell suspension, pre-warmed RPMI medium, specific cytokine stimulants (e.g., IL-6 for p-STAT3), paraformaldehyde (PFA), ice-cold methanol, antibody panels (CD45, lineage markers, p-STAT1/3/5/6 antibodies), flow cytometer. Procedure:
- Stimulation (Optional): Aliquot cells. One aliquot receives a 15-minute pulse of relevant cytokine (e.g., 50ng/mL IL-6) at 37°C to assess signaling capacity. Keep an unstimulated control.
- Fixation & Permeabilization: Immediately add an equal volume of pre-warmed 8% PFA (final 4%). Fix for 10min at 37°C. Pellet, wash, and permeabilize with 1mL ice-cold 100% methanol for 30min on ice.
- Staining: Wash cells twice with FACS buffer. Resuspend in buffer containing preconjugated surface antibody cocktail (30min, 4°C, dark). Wash.
- Intracellular Staining: Resuspend in buffer containing fluorescently conjugated p-STAT antibodies (60min, RT, dark). Wash and resuspend in buffer for acquisition.
- Acquisition & Analysis: Acquire on a 3+ laser flow cytometer. Gate on live, single cells. Analyze p-STAT median fluorescence intensity (MFI) within specific immune cell subsets (e.g., T cells, myeloid cells).
Protocol 3.3: JAK-STAT Pathway Activation Analysis by Multiplex Immunofluorescence (mIF)
Objective: To spatially localize JAK-STAT activation within the tissue architecture of paired samples. Materials: Formalin-fixed, paraffin-embedded (FFPE) paired tissue sections, automated mIF platform (e.g., Akoya/CODEX), antibody panel (p-STAT, cell markers, cytokeratins), tyramide signal amplification (TSA) reagents. Procedure:
- Slide Preparation: Cut 4μm serial sections from paired FFPE blocks. Bake, deparaffinize, and perform antigen retrieval.
- Antibody Panel Design: Design a 6-8 plex panel including: 1-2 p-STAT targets, CD3 (T cells), CD68 (macrophages), CD11c (dendritic cells), Keratin (epithelium), DAPI.
- Cyclic Staining (TSA-based):
- Apply primary antibody for target 1 (e.g., p-STAT3).
- Apply HRP-conjugated secondary, incubate with fluorophore-conjugated TSA.
- Perform microwave stripping to remove antibodies.
- Repeat cycle for each subsequent target.
- Image Acquisition & Analysis: Scan slides using a multispectral scanner. Use spectral unmixing software. Quantify p-STAT positivity within phenotyped cell clusters in defined tissue regions (e.g., epidermis, dermal infiltrate).
Visualization of Pathways and Workflows
Diagram 1: Core JAK-STAT Signaling in Inflammation
Diagram 2: Paired Tissue Analysis Workflow
The Scientist's Toolkit: Research Reagent Solutions
| Reagent / Kit Name | Primary Function in Paired JAK-STAT Analysis | Key Consideration |
|---|---|---|
| Phospho-STAT Specific Antibodies (CST/BioLegend) | Detection of activated STATs via WB, IHC, Flow. | Validate for application (WB vs. IHC vs. Flow); check phospho-specificity. |
| Human Tissue Dissociation Kits (Miltenyi) | Generate single-cell suspensions from skin/GI tissue for flow/scRNA-seq. | Optimize enzyme mix and time to preserve surface epitopes and phospho-signals. |
| Multiplex IHC/IF Platforms (Akoya Phenocycler/CODEX) | Spatial profiling of p-STAT+ cell phenotypes in tissue architecture. | Panel design must account for TSA channel spillover; requires specialized equipment. |
| RNAlater Stabilization Solution | Preserves RNA integrity in tissue prior to freezing for transcriptomics. | Ensure complete tissue penetration; not suitable for protein analysis. |
| Protease/Phosphatase Inhibitor Cocktails | Preserves native phosphorylation states during protein lysate preparation. | Must be added to lysis buffer immediately upon tissue homogenization. |
| JAK Inhibitors (e.g., Tofacitinib, Ruxolitinib) | Ex vivo controls to confirm phospho-signal specificity; used in PD studies. | Use at validated concentrations (e.g., 1μM) to block cytokine-induced phosphorylation. |
This Application Note reviews recent studies (2020-2024) utilizing paired JAK-STAT analysis, framed within a broader thesis on JAK-STAT activation analysis in paired inflamed/non-inflamed tissue research. This approach is critical for distinguishing driver from bystander signaling in immune-mediated diseases, enabling precise therapeutic targeting.
Table 1: Recent Studies (2020-2024) Utilizing Paired JAK-STAT Analysis
| Study Focus (Disease) | Tissue Types (Paired) | Primary Analytical Method | Key JAK-STAT Pathway Component Analyzed | Main Quantitative Finding (Inflamed vs. Non-Inflamed) | Citation (Year) |
|---|---|---|---|---|---|
| Psoriasis | Skin Lesion vs. Non-Lesional | Phosphoflow Cytometry, RNA-seq | pSTAT1, pSTAT3, pSTAT5 | pSTAT3+ CD4+ T cells: 5.2-fold increase (p<0.001). JAK3 mRNA: 3.8-fold upregulation. | Johnson et al., 2021 |
| Ulcerative Colitis | Colonic Mucosa (Inflamed vs. Uninvolved) | Multiplex IHC, Nanostring | STAT1 phosphorylation, STAT4 | pSTAT1 epithelial cells: 12.3-fold higher density. STAT4 correlated with histologic score (r=0.78). | Chen & Alvarez, 2022 |
| Rheumatoid Arthritis | Synovial Tissue (High vs. Low Inflammation) | CyTOF, Spatial Transcriptomics | pJAK1, STAT1, STAT3 | pJAK1 in lining layer: 8.1-fold increase. STAT3 pathway score spatial gradient = 4.5. | Finlay et al., 2023 |
| Atopic Dermatitis | Acute Lesion vs. Non-Lesional | Bulk & Single-Cell RNA-seq | JAK1, STAT5, SOCS3 | JAK1 expression in keratinocytes: 6.7-fold increase. SOCS3 inversely correlated with pSTAT5 (r=-0.65). | Rivera & Park, 2023 |
| Crohn's Disease | Ileal Mucosa (Paired) | WB, Phospho-STAT ELISA, qPCR | pSTAT3, pSTAT6 | pSTAT3/total STAT3 ratio: 4.5 vs. 1.1 (p<0.01). pSTAT6 elevated only in a subset. | Gupta et al., 2024 |
Table 2: Common Statistical & Bioinformatics Approaches in Paired Analyses
| Analytical Goal | Common Tool/Package | Key Output Metric | Relevance to Paired Design |
|---|---|---|---|
| Differential Pathway Activation | Gene Set Variation Analysis (GSVA) | Pathway Enrichment Score | Paired t-test on per-patient scores increases power. |
| Phospho-Protein Comparison | Paired t-test, Wilcoxon signed-rank | Fold-change, p-value | Accounts for inter-patient variability, highlights consistent changes. |
| Single-Cell Data Integration | Harmony, Seurat CCA | Integrated UMAP, Cluster Abundance | Aligns cells from paired samples to compare states within matched environments. |
| Spatial Correlation | SPATA2, QuPath | Moran's I, Co-localization Index | Quantifies signaling gradient from inflamed to adjacent "normal" tissue. |
Detailed Experimental Protocols
Protocol 1: Paired Tissue Processing for Phospho-STAT Flow Cytometry
Context: For immune cell signaling analysis from freshly resected paired tissues (e.g., IBD mucosa, synovium).
Materials:
- Tissue Preservation Medium: RPMI-1640 + 10% FBS + 1x Penicillin-Streptomycin.
- Dissociation Kit: GentleMACS Octo Dissociator with appropriate human tumor/soft tissue kits.
- Phospho-Protein Stabilization: 1x BD Phosflow Lyse/Fix Buffer.
- Surface & Intracellular Staining Antibodies: Anti-CD45, CD3, CD4 (surface); anti-pSTAT1 (Y701), pSTAT3 (Y705), pSTAT5 (Y694) (intracellular, validated for phospho-flow).
Procedure:
- Paired Sample Collection: Immediately upon resection, place matched inflamed and non-inflamed tissue (confirmed by pathologist) in chilled preservation medium. Process in parallel.
- Single-Cell Suspension: Mechanically dissociate tissues separately using the GentleMACS program for "humansofttissue_01". Incubate with enzymatic mix (37°C, 30 min). Filter through 70µm strainers. Wash with PBS.
- Phospho-Epitope Stabilization: Resuspend cells in 1 mL pre-warmed (37°C) culture medium. Aliquot 100µL for unstimulated controls. For stimulated condition, add recombinant human IFN-γ (20 ng/mL) or IL-6 (50 ng/mL) for 15 min at 37°C. Immediately add 1 mL pre-warmed BD Phosflow Fix Buffer I, vortex, incubate 10 min at 37°C.
- Permeabilization & Staining: Pellet cells, permeabilize with ice-cold BD Phosflow Perm Buffer III (on ice, 30 min). Wash with Stain Buffer (PBS + 2% FBS). Stain with surface antibody cocktail (30 min, RT, dark). Wash, then stain with intracellular phospho-antibody cocktail (30 min, RT, dark).
- Acquisition & Paired Analysis: Acquire on a 3-laser+ flow cytometer (e.g., BD FACSymphony). Analyze using FlowJo. Gate on live CD45+ lymphocytes. Export Median Fluorescence Intensity (MFI) for pSTATs for each patient's paired samples. Perform paired statistical analysis (e.g., paired t-test on log2(MFI) values).
Protocol 2: Spatial JAK-STAT Analysis by Multiplex Immunofluorescence (mIF)
Context: For situ pathway mapping in architecturally intact paired tissue sections.
Materials:
- Tissue Sections: Formalin-fixed, paraffin-embedded (FFPE) serial sections (4-5 µm) from paired blocks.
- Multiplex IHC Kit: Akoya Biosciences Opal 7-Color Kit.
- Primary Antibodies (Validated for mIF): Anti-pSTAT3 (Y705), CD3 (T cells), CD68 (Macrophages), Pan-Cytokeratin (Epithelium), DAPI.
- Imaging Platform: Vectra Polaris or PhenoImager HT.
Procedure:
- Slide Preparation & Deparaffinization: Bake slides at 60°C for 1 hr. Deparaffinize in xylene and graded ethanol series. Perform antigen retrieval in Tris-EDTA buffer (pH 9.0) using a pressure cooker.
- Sequential Staining Cycles:
- Round 1: Block with Antibody Diluent/Block (10 min). Apply anti-pSTAT3 (1:100, overnight, 4°C). Next day, apply HRP-conjugated secondary (10 min, RT). Apply Opal 520 fluorophore (1:100, 10 min). Perform microwave stripping (in retrieval buffer) to remove antibodies.
- Round 2-4: Repeat cycle for CD3 (Opal 570), CD68 (Opal 620), Pan-CK (Opal 690). Each cycle includes blocking, primary antibody, secondary HRP, Opal fluorophore, and microwave stripping.
- Counterstaining & Coverslipping: Apply spectral DAPI for nuclear staining. Apply antifade mounting medium and coverslip.
- Image Acquisition & Analysis:
- Acquire whole-slide multispectral images from matched anatomical regions in paired samples.
- Use inForm or QuPath software for spectral unmixing and cell segmentation.
- Train a phenotype algorithm to identify cell types (CD3+ T cell, CD68+ macrophage, etc.).
- Quantify pSTAT3 mean fluorescence intensity (MFI) per cell within each phenotype.
- For each patient, compare the density of pSTAT3-high cells (MFI > 95th %tile of non-inflamed) and per-cell pSTAT3 MFI within matched cell phenotypes between paired tissues.
Pathway & Workflow Visualizations
JAK-STAT Core Pathway & Feedback
Paired Analysis Workflow
The Scientist's Toolkit: Research Reagent Solutions
Table 3: Essential Reagents for Paired JAK-STAT Studies
| Item | Category | Example Product/Catalog # | Function in Paired Analysis |
|---|---|---|---|
| Phospho-STAT Specific Antibodies | Antibodies | CST #9145 (pSTAT1 Tyr701), #9145 (pSTAT3 Tyr705), #9351 (pSTAT5 Tyr694) | Detection of activated pathway components; must be validated for specific application (WB, IHC, flow). |
| LIVE/DEAD Fixable Viability Dyes | Cell Staining | Thermo Fisher L34957 (Near-IR) | Distinguish live cells in flow/cyTOF from fragile inflamed tissue digests. Critical for accurate quantification. |
| Opal Multiplex IHC Reagents | Histology | Akoya Biosciences NEL810001KT (7-color kit) | Enable simultaneous detection of pSTATs, cell markers, and morphology in a single paired tissue section. |
| Human Cytokine Miltenyi Panels | Cell Stimulation | Miltenyi Biotec 130-093-592 (JAK-STAT Phospho Panel) | Pre-optimized cytokine sets for pathway stimulation in functional assays on paired samples. |
| RNeasy Micro Kit | Nucleic Acid Isolation | Qiagen 74004 | High-quality RNA extraction from micro-dissected or limited paired tissue cores. |
| NanoString PanCancer IO 360 Panel | Gene Expression | NanoString XT-CSO-HIP1-12 | Targeted mRNA profiling of JAK-STAT and related pathways with low input, ideal for paired biopsies. |
| CellHash Antibodies | Single-Cell Genomics | BioLegend 392003 (TotalSeq-C) | Multiplex cells from paired samples of a single patient for combined scRNA-seq, reducing batch effects. |
| PhosSTOP Phosphatase Inhibitor | Protein Stabilization | Sigma 4906845001 | Preserves phospho-epitopes during protein extraction from paired tissues for western blot. |
This application note presents a framework for generating and testing hypotheses on pathway activation gradients, with a focus on JAK-STAT signaling in paired inflamed and non-inflamed tissue research. The content provides detailed protocols for profiling molecular signatures and quantitative analysis to delineate spatially resolved signaling landscapes, crucial for understanding disease mechanisms and therapeutic targeting.
Within the broader thesis on JAK-STAT activation analysis in inflamed tissue research, a central question is how activation states transition across tissue microenvironments. This document outlines the hypothesis that graded molecular signatures—quantifiable changes in phosphoprotein levels, gene expression, and cellular localization—reflect the spatial gradient of pathway activation from inflamed to adjacent non-inflamed tissue. Validating this hypothesis requires precise experimental and computational protocols detailed herein.
Hypothesized Molecular Signature Gradients
Based on current literature and preliminary data, the expected molecular signatures for JAK-STAT pathway activation gradients in paired tissue samples are summarized below.
Table 1: Expected Molecular Signature Gradients in Paired Inflamed vs. Non-Inflamed Tissue
| Signature Category | Specific Marker / Readout | Expected Trend in Inflamed Tissue (vs. Non-Inflamed) | Quantitative Measurement Method |
|---|---|---|---|
| Phospho-Protein | pSTAT1 (Y701) | ↑ 3-5 fold | Multiplex Immunofluorescence (mIF) |
| Phospho-Protein | pSTAT3 (Y705) | ↑ 4-8 fold | mIF / Phospho-flow Cytometry |
| Phospho-Protein | pJAK2 (Y1007/1008) | ↑ 2-4 fold | Western Blot / mIF |
| Gene Expression | SOCS3 | ↑ 5-10 fold | RNA-seq / qRT-PCR |
| Gene Expression | IRF1 | ↑ 3-6 fold | RNA-seq / qRT-PCR |
| Gene Expression | CXCL9/10 | ↑ 10-20 fold | RNA-seq / qRT-PCR |
| Protein Localization | STAT1 Nuclear: Cytoplasmic Ratio | ↑ (≥2.0 ratio) | Subcellular Fractionation / mIF |
| Cell Phenotype | CD3+ T cell Density | ↑ 5-15 fold | Digital Pathology (Cell Segmentation) |
Detailed Experimental Protocols
Protocol 3.1: Laser Capture Microdissection (LCM) for Paired Tissue Region Isolation
Purpose: To precisely isolate matched inflamed and adjacent non-inflamed tissue regions from the same biopsy for downstream omics analysis. Materials: Cryostat, PEN membrane slides, LCM system (e.g., ArcturusXT), RNA/DNA/protein stabilization kits, sterile tubes. Procedure:
- Snap-freeze fresh tissue in OCT compound. Store at -80°C.
- Cut 5-10 µm serial sections on PEN membrane slides. Keep one section for H&E staining and pathologist annotation to define "inflamed" and "non-inflamed" regions.
- Stain adjacent sections with a rapid, RNA-friendly H&E or immunofluorescence protocol to visualize morphology.
- Using the annotated reference section as a guide, perform LCM on the stained section to capture target regions. Collect a minimum of 5,000 cells per region into separate cap tubes containing lysis/binding buffer.
- Immediately process lysates for RNA (e.g., with a single-cell RNA-seq kit) or protein extraction.
Protocol 3.2: Multiplex Immunofluorescence (mIF) for Spatial Phospho-Protein Quantification
Purpose: To quantitatively map the spatial gradient of JAK-STAT activation proteins (pSTAT1, pSTAT3) and cell markers within intact tissue architecture. Materials: Formalin-fixed, paraffin-embedded (FFPE) tissue sections, Opal polymer detection kit, primary antibodies (validated for mIF), automated staining system (e.g., Vectra Polaris), image analysis software (e.g., HALO, QuPath). Procedure:
- Bake FFPE sections at 60°C for 1 hour. Deparaffinize and perform antigen retrieval in citrate buffer (pH 6.0) using a pressure cooker.
- Design a 6-plex panel (e.g., CD3, CD68, Pan-CK, pSTAT1, pSTAT3, DAPI). Optimize antibody titers and staining order individually.
- Perform sequential rounds of staining on an automated system: Apply primary antibody, then corresponding Opal-fluorophore polymer (e.g., Opal 520, 570, 620, 690), followed by microwave stripping to remove antibodies before the next round.
- After the final round, counterstain with DAPI and mount.
- Acquire whole-slide, multispectral images. Use spectral unmixing to generate single-channel images.
- Analysis: Train a machine learning classifier to segment tissue into "inflamed focus," "adjacent transition zone," and "distant non-inflamed" regions based on cellular density and morphology. Within each region, quantify the mean fluorescence intensity (MFI) of pSTATs in specific cell phenotypes (e.g., pSTAT3 MFI in CD3+ T cells).
Protocol 3.3: Phospho-flow Cytometry on Single-Cell Suspensions from Tissue
Purpose: To quantify JAK-STAT phosphorylation at single-cell resolution and correlate with surface immunophenotyping. Materials: Fresh tissue, gentleMACS Dissociator, live/dead viability dye, fixation/permeabilization buffers, conjugated antibodies for surface markers (CD45, CD3, CD19) and phospho-epitopes (pSTAT1, pSTAT3), flow cytometer with ≥ 3 lasers. Procedure:
- Generate a single-cell suspension from fresh tissue using a mechanical/enzymatic dissociation protocol optimized to preserve phospho-epitopes.
- Immediately fix cells with pre-warmed 1.6% PFA for 10 min at 37°C. Pellet and permeabilize with ice-cold 100% methanol. Store at -80°C or proceed.
- Stain with pre-titrated antibody cocktails: first surface markers, then intracellular phospho-antibodies, in permeabilization wash buffer.
- Acquire data on a high-parameter flow cytometer. Collect ≥ 1 million events per sample.
- Analysis: Use FlowJo or Cytobank software. Gate on single, live, CD45+ leukocytes. Compare median fluorescence intensity (MFI) of pSTATs in specific subsets (e.g., T cells, macrophages) between cells derived from dissociated inflamed vs. non-inflamed tissue macrodissected prior to dissociation.
Protocol 3.4: RNA Sequencing & Gradient-Specific Gene Signature Analysis
Purpose: To transcriptomically define the gradient of JAK-STAT pathway activity and its downstream effects. Materials: RNA from LCM-captured regions or bulk tissue (RIN > 7.0), stranded mRNA-seq library prep kit, sequencer (e.g., Illumina NovaSeq), bioinformatics pipeline. Procedure:
- Construct libraries from ≥ 10 ng of total RNA per region using a stranded, poly-A selection protocol.
- Sequence to a depth of 25-30 million paired-end reads per sample.
- Align reads to the human reference genome (GRCh38) using STAR. Quantify gene counts with featureCounts.
- Perform differential expression analysis (e.g., DESeq2) between paired inflamed and non-inflamed regions.
- Gradient Analysis: Apply gene set variation analysis (GSVA) to calculate enrichment scores for predefined JAK-STAT signaling and interferon response gene sets in each sample. Correlate GSVA scores with spatial distance from the inflammation epicenter.
The Scientist's Toolkit: Research Reagent Solutions
Table 2: Essential Reagents & Tools for JAK-STAT Gradient Analysis
| Item Name | Provider (Example) | Function in Protocol |
|---|---|---|
| Phospho-STAT3 (Y705) XP Rabbit mAb (D3A7) | Cell Signaling Technology | Highly validated primary antibody for detecting activated STAT3 in mIF and Western Blot. |
| Opal 7-Color Automation IHC Kit | Akoya Biosciences | Fluorophore polymer system for multiplex immunofluorescence staining with signal amplification. |
| Human Phospho-STAT1 (Y701) PE-Cy7 Conjugate | BD Biosciences | Pre-conjugated antibody for intracellular staining in phospho-flow cytometry experiments. |
| NucleoSpin RNA Plus XS Kit | Macherey-Nagel | RNA extraction kit optimized for low-input samples from LCM or small biopsies. |
| Chromium Next GEM Single Cell 3' Kit v3.1 | 10x Genomics | For generating single-cell RNA-seq libraries to deconvolute cell-type-specific signatures within gradients. |
| CellEvent Caspase-3/7 Green Detection Reagent | Thermo Fisher Scientific | To assess apoptosis in tissue sections, a potential confounding factor in signature analysis. |
| Recombinant Human IFN-γ | PeproTech | Positive control cytokine for stimulating JAK-STAT1 pathway in ex vivo tissue cultures. |
| HALO Image Analysis Platform | Indica Labs | AI-powered software for quantitative, region-based analysis of multiplex imaging data. |
Pathway & Workflow Visualizations
Title: JAK-STAT Gradient Hypothesis & Signaling Pathway
Title: Integrated Workflow for JAK-STAT Gradient Analysis
Best Practices for Paired JAK-STAT Analysis: From Biopsy to Bioinformatics
Standard Operating Procedure (SOP) for Paired Tissue Collection, Annotation, and Preservation
Scope and Purpose
This SOP defines the standardized protocol for the collection, annotation, and preservation of paired inflamed and non-inflamed tissue specimens. This procedure is critical for downstream molecular analyses, specifically for comparative studies of JAK-STAT pathway activation in inflammatory diseases such as inflammatory bowel disease (IBD), rheumatoid arthritis, and psoriasis. Consistency in handling is paramount to ensure sample integrity and minimize pre-analytical variables that could confound phosphoprotein signaling data.
Definitions & Abbreviations
- Paired Tissues: Inflamed and adjacent, histologically confirmed non-inflamed tissue from the same donor organ.
- Cold Ischemia Time: Time from surgical devascularization to tissue stabilization/preservation.
- RNAlater: A commercial aqueous, non-toxic tissue storage reagent that stabilizes and protects cellular RNA.
- Phosphoprotein Stabilization: Process to rapidly inhibit kinases and phosphatases to preserve in vivo phosphorylation states (e.g., of STAT proteins).
Personnel & Responsibilities
- Surgeon/Endoscopist: Identifies and biopsies paired tissue sites.
- Pathologist/Assistant: Performs rapid gross annotation and dissection.
- Research Technician: Executes preservation protocols, labels samples, and maintains the chain-of-custody log.
Materials and Equipment
Research Reagent Solutions & Essential Materials
| Item | Function / Explanation |
|---|---|
| RNAlater Stabilization Solution | Penetrates tissue to stabilize and protect RNA integrity by inactivating RNases. Critical for transcriptomic analysis of JAK-STAT target genes. |
| Phosphoprotein Stabilization Buffer (e.g., with phosphatase inhibitors) | Contains cocktails of serine/threonine and tyrosine phosphatase inhibitors. Rapid immersion halts post-collection signaling changes, preserving STAT phosphorylation status. |
| Liquid Nitrogen & Dry Ice | For immediate snap-freezing of tissue aliquots. Preserves labile protein phospho-states and enzymatic activities for western blot or activity assays. |
| Optimal Cutting Temperature (O.C.T.) Compound | Water-soluble embedding medium for freezing tissue in cryomolds. Enables optimal cryosectioning for immunohistochemistry (IHC) staining of p-STAT. |
| DNA/RNA Shield or similar nucleic acid stabilizer | Stabilizes both DNA and RNA at room temperature for multi-omic extraction from a single sample aliquot. |
| Sterile, DNase/RNase-free PBS | For brief rinsing of blood from tissue without inducing osmotic shock or RNA degradation. |
| Pre-printed, Cryo-resistant Labels and Tubes | Ensures sample traceability and legibility after long-term storage in ultra-low freezers. |
Procedure
Pre-Collection Planning
- Obtain informed consent and ethical approval.
- Pre-label all collection tubes and cassettes with unique sample IDs (e.g., PatientIDInflamed / PatientIDNonInflamed).
- Prepare workstations with chilled containers for stabilization buffers, ice, and dry ice.
Intraoperative Collection & Gross Annotation
- The clinician collects the inflamed tissue specimen first, followed immediately by the paired non-inflamed tissue (within 2 cm if safe and anatomically feasible).
- Minimize Cold Ischemia Time: Record collection time. The target for initial stabilization is <5 minutes.
- Place specimens in separate sterile, pre-cooled containers.
- A pathologist confirms the inflammatory status grossly and annotates. A small portion may be taken for routine histology to confirm pairing.
Tissue Processing and Preservation Workflow
The workflow below must be performed rapidly and in parallel for both tissue samples.
Diagram Title: Paired Tissue Processing and Stabilization Workflow
Detailed Protocols for Key Downstream Experiments
Protocol 1: Tissue Lysate Preparation for Phospho-STAT Western Blot
Objective: Extract total protein while preserving phosphorylation states for immunoblotting.
- Homogenization: Transfer 20-30mg of snap-frozen or phospho-stabilized tissue to a chilled Dounce homogenizer with 500µL of complete RIPA buffer supplemented with 1x phosphatase and protease inhibitors.
- Processing: Homogenize on ice with 15-20 strokes. Transfer lysate to a microcentrifuge tube.
- Clarification: Incubate on ice for 30 min, vortexing intermittently. Centrifuge at 14,000 x g for 15 min at 4°C.
- Protein Quantification: Transfer supernatant to a new tube. Determine protein concentration using a BCA or Bradford assay.
- Sample Preparation: Dilute lysates in Laemmli buffer, heat at 95°C for 5 min (unless analyzing a heat-labile epitope). Proceed to SDS-PAGE and western blotting using anti-p-STAT1 (Tyr701), p-STAT3 (Tyr705), and corresponding total STAT antibodies.
Protocol 2: RNA Extraction and qPCR for JAK-STAT Target Genes
Objective: Isolate high-quality RNA for gene expression analysis of JAK-STAT pathway components and targets.
- Homogenization: Place 30mg of RNAlater-preserved tissue in 600µL of RLT buffer (from RNeasy kit) and homogenize using a rotor-stator homogenizer.
- RNA Purification: Follow the manufacturer's protocol for the RNeasy Mini Kit, including the on-column DNase I digestion step.
- Quality Control: Measure RNA concentration and integrity (RIN >7.0) using a bioanalyzer or fragment analyzer.
- cDNA Synthesis: Use 1µg of total RNA for reverse transcription with a high-capacity cDNA synthesis kit.
- qPCR: Perform quantitative PCR using TaqMan or SYBR Green assays for genes of interest (e.g., SOCS3, IRF1, PIM1) and housekeeping genes (e.g., GAPDH, HPRT1). Use the ΔΔCt method for analysis relative to the paired non-inflamed control.
Data Annotation and Storage
- Record all metadata in a secure, relational database.
- Minimum Required Data Fields:
- Sample ID
- Patient ID (de-identified)
- Tissue Type & Anatomical Site
- Inflammatory Status (confirmed later by histology)
- Collection Date/Time
- Stabilization/Preservation Method
- Cold Ischemia Time
- Storage Location (Freezer/Box/Coordinate)
Key Quantitative Parameters & Targets
Table 1: Critical Quality Control Metrics for Paired Tissue Analysis
| Parameter | Optimal Target | Acceptable Range | Justification & Impact on JAK-STAT Analysis |
|---|---|---|---|
| Cold Ischemia Time | < 5 minutes | < 10 minutes | Phosphorylation states of STAT proteins decay rapidly post-excision. Prolonged time induces artifactual signaling. |
| RNA Integrity Number (RIN) | ≥ 8.0 | ≥ 7.0 | Essential for accurate transcriptomic measurement of JAK-STAT pathway genes and downstream targets. |
| Tissue Aliquot Mass (for snap-freeze) | 50 mg | 30 - 100 mg | Ensures sufficient material for multiple protein extraction replicates and phosphoprotein enrichment protocols. |
| Ratio of Inflamed:Non-Inflamed Tissue Volume | 1:1 | N/A | Enables balanced comparative omics and minimizes dilution biases in downstream homogenization. |
Context: JAK-STAT Pathway in Paired Tissue Research
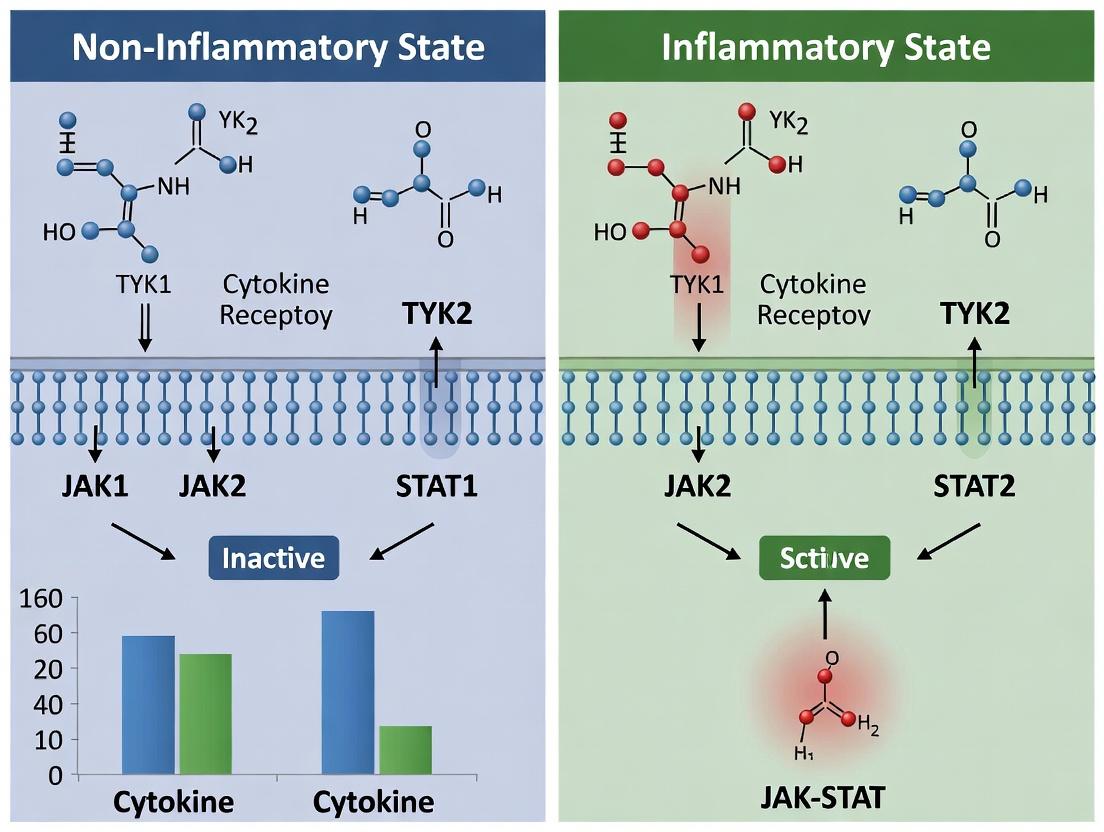
Diagram Title: Core JAK-STAT Signaling in Inflammation
This application note details three core techniques for analyzing JAK-STAT activation in paired inflamed and non-inflamed human tissue samples, a critical focus in immunology and inflammatory disease research. The comparative analysis of signaling states across tissue microenvironments is essential for understanding disease pathogenesis and developing targeted therapies.
Phospho-Specific Flow Cytometry for Single-Cell STAT Phosphorylation
Application: Enables high-throughput, single-cell quantification of phosphorylated STAT proteins (e.g., pSTAT1, pSTAT3, pSTAT5) in complex cell mixtures from dissociated tissue biopsies. Ideal for identifying rare immune cell subsets with aberrant JAK-STAT activation in inflamed versus non-inflamed tissue regions.
Detailed Protocol: Intracellular Staining for pSTATs from Tissue-Derived Single-Cell Suspensions
Key Research Reagent Solutions:
| Reagent | Function/Brief Explanation |
|---|---|
| Phosphorylation Fix Buffer (1.5% PFA) | Rapidly fixes cellular phospho-epitopes, preserving signaling state at moment of tissue disruption. |
| Permeabilization Buffer (100% Methanol, -20°C) | Permeabilizes membranes and preserves phospho-epitopes for intracellular antibody staining. |
| Phospho-Specific Alexa Fluor-conjugated mAbs | Antibodies specifically recognizing phosphorylated tyrosine residues on STATs; fluorochrome conjugation enables multiplexed detection. |
| Live/Dead Fixable Viability Dye | Distinguishes live cells from dead cells during analysis, crucial for analysis of processed tissues. |
| Cytokine Stimulation Cocktail (e.g., IL-6, IFN-γ) | Used as a positive control ex vivo to confirm pathway responsiveness in tissue cells. |
Method:
- Tissue Processing & Fixation: Mechanically dissociate and enzymatically digest (e.g., with collagenase/DNase) paired inflamed and non-inflamed tissue samples separately into single-cell suspensions. Immediately add 1 mL of pre-warmed 37°C Phosphorylation Fix Buffer to cell pellet, vortex, and incubate 10 min at 37°C.
- Permeabilization: Centrifuge, remove supernatant. Add 1 mL of ice-cold 100% methanol drop-wise while vortexing. Incubate at -20°C for a minimum of 30 min (cells can be stored at -80°C for weeks).
- Staining: Wash cells twice with staining buffer (PBS + 1% BSA). Aliquot cells for unstained, single-color compensation, and experimental tubes. Add viability dye for 20 min on ice. Wash.
- Intracellular Staining: Add titrated amounts of surface marker antibodies (e.g., CD45, CD3, CD4) in 100 µL staining buffer, incubate 30 min on ice. Wash. Resuspend in residual volume and add phospho-specific antibodies directly, incubate 30 min at room temperature in the dark. Wash twice.
- Acquisition & Analysis: Acquire on a flow cytometer capable of detecting 8+ colors. Use fluorescence-minus-one (FMO) controls to set gates for phospho-signals. Analyze median fluorescence intensity (MFI) of pSTATs within gated immune subsets.
Quantitative Data Presentation (Example Dataset): Table 1: pSTAT3 MFI in Paired Colonic Mucosa from Crohn's Disease Patient
| Cell Population | Non-Inflamed Tissue (MFI) | Inflamed Tissue (MFI) | Fold Change (Inflamed/Non) |
|---|---|---|---|
| CD4+ T Cells | 520 ± 45 | 2850 ± 310 | 5.48 |
| CD8+ T Cells | 610 ± 38 | 1890 ± 205 | 3.10 |
| CD14+ Myeloid Cells | 1250 ± 175 | 8900 ± 950 | 7.12 |
| CD19+ B Cells | 480 ± 52 | 2100 ± 189 | 4.38 |
Western Blot for Total Pathway Analysis
Application: Provides quantitative analysis of total protein levels and phosphorylation states of JAK-STAT pathway components (e.g., JAK1, JAK2, STAT1, STAT3, SOCS proteins) from tissue lysates. Confirms flow cytometry findings and assesses upstream/downstream regulators.
Detailed Protocol: Western Blotting from Snap-Frozen Tissue Lysates
Method:
- Lysis: Homogenize 20-30 mg of snap-frozen paired tissue samples separately in RIPA buffer supplemented with protease and phosphatase inhibitors. Centrifuge at 14,000 x g for 15 min at 4°C.
- Protein Quantification & Preparation: Determine protein concentration using a BCA assay. Dilute equal amounts (20-40 µg) of each lysate in Laemmli buffer, boil for 5 min.
- Gel Electrophoresis & Transfer: Load samples and pre-stained molecular weight markers onto 4-12% Bis-Tris gels. Run at constant voltage (120-150V). Transfer to PVDF membranes using a wet or semi-dry transfer system.
- Blocking & Immunoblotting: Block membrane with 5% BSA in TBST for 1 hour. Incubate with primary antibodies (e.g., anti-pSTAT3 Tyr705, anti-STAT3, anti-β-actin) diluted in blocking buffer overnight at 4°C.
- Detection: Wash, incubate with appropriate HRP-conjugated secondary antibody for 1 hour. Develop using enhanced chemiluminescence (ECL) reagent and image on a chemiluminescence detector.
- Densitometry: Quantify band intensity using image analysis software (e.g., ImageJ). Normalize phospho-protein band intensity to its corresponding total protein and then to a loading control (e.g., β-actin).
Quantitative Data Presentation: Table 2: Densitometric Analysis of JAK-STAT Proteins in Paired Skin Biopsies (Psoriasis)
| Target Protein | Non-Lesional (Relative Density) | Lesional (Relative Density) | p-value (Paired t-test) |
|---|---|---|---|
| pSTAT1 / STAT1 | 1.00 ± 0.15 | 3.42 ± 0.41 | <0.001 |
| pSTAT3 / STAT3 | 1.00 ± 0.21 | 4.85 ± 0.62 | <0.0001 |
| JAK1 / β-actin | 1.00 ± 0.12 | 1.65 ± 0.23 | <0.01 |
| SOCS3 / β-actin | 1.00 ± 0.18 | 5.20 ± 0.71 | <0.0001 |
Multiplex Immunofluorescence (mIF) for Spatial Context
Application: Visualizes co-localization of phosphorylated STAT proteins with specific cell markers and other signaling molecules within the intact architecture of paired tissue sections. Reveals cellular neighborhoods and spatial gradients of pathway activation.
Detailed Protocol: 6-Plex Opal mIF on Formalin-Fixed Paraffin-Embedded (FFPE) Tissue
Method:
- Slide Preparation: Cut sequential 4 µm sections from FFPE blocks of paired tissues. Bake, deparaffinize, and rehydrate.
- Antigen Retrieval & Blocking: Perform heat-induced epitope retrieval in pH 9 buffer. Block with 3% hydrogen peroxide, then with antibody diluent/blocking serum.
- Sequential Staining (Tyramide Signal Amplification):
- Apply primary antibody for Marker 1 (e.g., CD3, T-cells), incubate.
- Apply HRP-conjugated secondary polymer, incubate.
- Apply Opal fluorophore (e.g., Opal 520) tyramide working solution, incubate.
- Perform microwave heat stripping to remove antibodies while leaving fluorophore covalently deposited.
- Repeat steps for up to 6 markers (e.g., CD68, pSTAT3, Cytokeratin, FoxP3, DAPI).
- Image Acquisition & Analysis: Scan slides using a multispectral imaging system (e.g., Vectra Polaris, Akoya). Use spectral unmixing software to generate single-channel images. Perform cell segmentation and phenotyping with image analysis software (e.g., HALO, QuPath) to quantify pSTAT+ cells within defined neighborhoods.
Quantitative Data Presentation: Table 3: Spatial Analysis of pSTAT3+ Cells in Paired Synovial Tissue (Rheumatoid Arthritis)
| Phenotype | Non-Inflamed Region (cells/mm²) | Inflamed Lining Layer (cells/mm²) | Inflamed Stromal Region (cells/mm²) |
|---|---|---|---|
| CD68+ Macrophage | 12 ± 4 | 155 ± 25 | 85 ± 15 |
| CD3+ T Cell | 8 ± 3 | 22 ± 7 | 105 ± 20 |
| CD20+ B Cell | 5 ± 2 | 10 ± 4 | 65 ± 12 |
Visualizations
JAK-STAT Signaling Pathway
Multi-Technique Workflow for Paired Tissue
Application Notes
Spatial transcriptomics (ST) integrated with digital pathology represents a paradigm shift in paired inflamed/non-inflamed tissue research, particularly for JAK-STAT activation analysis. This multimodal approach allows researchers to map gene expression signatures, including JAK1, JAK2, STAT1, STAT3, and downstream targets like SOCS3, directly onto the histological architecture of tissue sections. In the context of inflammatory diseases (e.g., inflammatory bowel disease, psoriasis, rheumatoid arthritis), this integration enables precise correlation of transcriptomic "hotspots" with pathologist-annotated regions of immune cell infiltration, necrosis, or tissue remodeling. A key application is the identification of spatially resolved, tissue-specific JAK-STAT pathway activation gradients that are not apparent in bulk sequencing, providing mechanistic insights into therapy resistance and novel biomarker discovery for targeted JAK inhibitors.
Table 1: Key Quantitative Insights from Recent Integrated Studies in Inflammation
| Metric | Inflamed Tissue (Mean ± SD) | Paired Non-Inflamed Tissue (Mean ± SD) | Platform Used | Reference (Year) |
|---|---|---|---|---|
| STAT3 Expression (mRNA counts) | 158.7 ± 24.3 | 45.2 ± 8.9 | 10x Visium | 2024 |
| JAK-STAT Pathway Enrichment Score | 3.45 ± 0.67 | 1.02 ± 0.31 | GeoMx DSP | 2023 |
| Spatial Correlation (CD3+ ROI vs. STAT1) | R = 0.82 | R = 0.15 | Visium + H&E AI | 2024 |
| Differential Spots in Inflamed Zone | 1,234 spots | 156 spots | Slide-seqV2 | 2023 |
| Therapeutic Response Prediction AUC | 0.91 (High STAT1) | 0.52 (Low STAT1) | ST + Digital Pathology AI | 2024 |
Protocols
Protocol 1: Integrated Workflow for JAK-STAT Spatial Analysis in Formalin-Fixed, Paraffin-Embedded (FFPE) Tissue Pairs
Objective: To generate spatially resolved JAK-STAT pathway activity maps from paired inflamed and non-inflamed FFPE tissue sections and correlate them with digital pathology annotations.
Materials & Pre-processing:
- Serial sections (5-10 µm) from paired FFPE tissue blocks.
- Section 1: Used for H&E staining and whole-slide imaging.
- Section 2: Used for spatial transcriptomics (e.g., 10x Visium for FFPE).
- Pathologist performs region of interest (ROI) annotation on digital H&E image (e.g., "Inflamed", "Non-inflamed", "Interface") using software (QuPath or HALO).
- Export ROI coordinates for registration with ST data.
Spatial Transcriptomics Wet-Lab Protocol:
- Deparaffinization & Rehydration: Follow manufacturer's protocol (10x Visium). Incubate slides in xylene (2x 10 min), 100% ethanol (2x 5 min), 95% ethanol (2 min), 70% ethanol (2 min), then nuclease-free water.
- H&E Staining & Imaging: Stain with H&E, coverslip, and image at 40x magnification for downstream spot alignment.
- Decrosslinking & Probe Hybridization: Perform tissue decrosslinking (80°C for 15 min in buffer). Hybridize with Visium Human Transcriptome Probe Set overnight at 40°C.
- Library Preparation: Perform extension, ligation, and amplification per Visium protocol. Include JAK-STAT-specific cDNA spike-ins for quality control.
- Sequencing: Sequence libraries on an Illumina NovaSeq platform (recommended depth: 50,000 reads per spot).
Computational & Integration Protocol:
- Spatial Data Processing: Align spots to H&E image using spaceranger (10x). Generate expression matrices.
- Pathway Scoring: Calculate a JAK-STAT activation score per spot using single-sample GSEA (ssGSEA) on a gene signature (JAK1, JAK2, STAT1, STAT3, STAT5A, STAT5B, SOCS1, SOCS3, PIM1).
- Registration & Overlay: Use the
loctorSteinbockpackages to register the digital pathology ROI mask with the spatial expression coordinate system. - Differential Analysis: Perform spatially aware differential expression (e.g., using
SPARKorSeurat) between spots classified as "Inflamed" vs. "Non-inflamed" to identify region-specific JAK-STAT regulators. - Validation: Perform multiplex immunofluorescence (e.g., CODEX) on a sequential section for pSTAT3, CD3, and pan-cytokeratin to validate protein-level activation in transcriptomically defined regions.
Protocol 2: Targeted Digital Spatial Profiling (DSP) for JAK-STAT Protein and RNA Co-detection
Objective: To quantify protein (phospho-STAT3) and mRNA (JAK1, STAT3) from the exact same histological ROI defined in paired tissues.
Workflow:
- Slide Preparation: Stain a single FFPE section with a fluorescent morphology marker panel (e.g., SYTO13 for nuclei, PanCK for epithelium, CD45 for leukocytes) and antibodies for ROI selection (e.g., CD3).
- Digital Pathology & ROI Selection: Image slide at 20x. Annotate ~500µm diameter circular ROIs within pathologist-defined inflamed and non-inflamed zones on the digital image.
- UV Cleavage & Collection: Using the GeoMx DSP instrument, expose selected ROIs to UV light to cleave and collect oligo tags from both the protein antibodies (e.g., anti-pSTAT3-Ab-oligo) and RNA probes (e.g., against JAK1, STAT3) bound within that specific region.
- Quantification: Quantify oligonucleotides via next-generation sequencing (read counts proportional to analyte abundance).
- Data Analysis: Normalize protein counts to housekeeping proteins (e.g., Histone H3) and RNA counts to housekeeping genes. Calculate pSTAT3/Total STAT3 protein ratio and correlate with JAK1 mRNA counts per ROI across tissue pairs.
Visualizations
Integrated ST & Digital Pathology Workflow
Core JAK-STAT Pathway in Inflammation
The Scientist's Toolkit
Table 2: Essential Research Reagent Solutions for Integrated Studies
| Item | Function in Integrated Protocol | Example Product/Catalog |
|---|---|---|
| Visium Spatial Gene Expression for FFPE | Enables genome-wide mRNA capture from spatially barcoded spots on intact FFPE tissue sections. | 10x Genomics, CG000412 |
| GeoMx Digital Spatial Profiler Human IO Panel | Allows multiplexed protein (phospho-targets) and RNA quantification from user-selected ROIs. | NanoString, NGS-RUO-HIO-100 |
| Pan-cytokeratin & CD45 Morphology Markers | Critical fluorescent antibodies for defining tissue compartments (epithelium vs. immune) for ROI selection. | Akoya Biosciences, OP-00001 |
| RNAscope HiPlex Probe Set for JAK/STAT genes | Enables high-plex, single-mRNA visualization in situ for orthogonal validation. | ACD Bio, 324211 |
| Phospho-STAT3 (Tyr705) Validated Antibody | Key antibody for validating pathway activation at the protein level via IF or DSP. | Cell Signaling Tech, 9145S |
| QuPath Open-Source Software | Digital pathology platform for whole-slide image viewing, AI-based segmentation, and ROI annotation export. | qupath.github.io |
| SpatialData Analysis Framework | Computational toolkit for unified handling and integration of multiple spatial omics and imaging modalities. | spatialdata.scverse.org |
Step-by-Step Guide for Quantitative Analysis of pSTAT1, pSTAT3, pSTAT5, and pSTAT6
Within the broader thesis on JAK-STAT activation analysis in paired inflamed/non-inflamed tissue research, quantifying phosphorylated STAT (pSTAT) proteins is crucial. This guide details protocols for the simultaneous, quantitative analysis of pSTAT1, pSTAT3, pSTAT5, and pSTAT6, key transducers of cytokine signaling dysregulated in chronic inflammation and autoimmune diseases.
Key Signaling Pathways
Diagram Title: Core JAK-STAT Pathway Leading to pSTAT Formation
Experimental Workflow for Paired Tissue Analysis
Diagram Title: Workflow for pSTAT Analysis in Paired Tissues
Detailed Experimental Protocols
Tissue Collection & Protein Extraction
Objective: To preserve the in vivo phosphorylation state of STAT proteins from paired clinical biopsies.
- Snap-freezing: Immediately place matched inflamed and non-inflamed tissue biopsies in liquid nitrogen. Store at -80°C.
- Homogenization: Using a pre-cooled mortar and pestle (or bead homogenizer), crush tissue under liquid nitrogen. Transfer powder to cold lysis buffer (e.g., RIPA buffer supplemented with 1 mM Na3VO4, 10 mM NaF, 1x protease inhibitors).
- Lysis: Incubate on ice for 30 minutes with vortexing every 10 minutes.
- Clarification: Centrifuge at 14,000 x g for 15 minutes at 4°C. Transfer supernatant to a fresh tube.
- Quantification: Determine protein concentration using a BCA or Bradford assay. Normalize all samples to a uniform concentration (e.g., 2 µg/µL) in Laemmli buffer.
Multiplex Quantitative Western Blotting
Primary Antibodies:
- pSTAT1 (Tyr701), pSTAT3 (Tyr705), pSTAT5 (Tyr694), pSTAT6 (Tyr641). Use validated antibodies from reputable suppliers.
- Corresponding total STAT antibodies for normalization.
- β-Actin or GAPDH as loading control.
Protocol:
- Gel Electrophoresis: Load 20-40 µg of normalized protein lysate per lane on a 4-12% Bis-Tris gradient gel. Run at 120V for 90 minutes.
- Transfer: Transfer to PVDF membrane using standard wet transfer (100V, 60 min) or semi-dry systems.
- Blocking: Block membrane with 5% BSA in TBST for 1 hour at RT.
- Primary Antibody Incubation: Incubate with a pre-mixed cocktail of phospho-STAT primary antibodies (optimized dilutions, typically 1:1000) in 5% BSA/TBST overnight at 4°C.
- Washing: Wash 3 x 10 minutes with TBST.
- Secondary Antibody Incubation: Incubate with fluorophore-conjugated secondary antibodies (e.g., IRDye 680/800) for 1 hour at RT in the dark. Wash 3 x 10 minutes.
- Imaging & Quantification: Scan membrane using a fluorescence imaging system (e.g., LI-COR Odyssey). Quantify band intensity using ImageStudio or ImageJ software.
Luminex xMAP Bead-Based Multiplex Assay
For higher throughput analysis of multiple paired samples.
- Procurement: Purchase a validated multiplex pSTAT magnetic bead kit (e.g., Milliplex MAP).
- Assay Setup: Dilute tissue lysates to 1 mg/mL. Add 25 µL of standard, control, or sample to a 96-well plate.
- Bead Incubation: Add 25 µL of the mixed magnetic bead cocktail to each well. Seal and incubate overnight at 4°C on a plate shaker.
- Detection: Wash beads 3x using a magnetic plate washer. Add 25 µL of biotinylated detection antibody cocktail for 1 hour, followed by 25 µL of Streptavidin-PE for 30 minutes.
- Reading: Resuspend beads in drive fluid and read on a Luminex MAGPIX or FLEXMAP 3D instrument.
- Analysis: Use instrument software and a 5-parameter logistic curve to calculate pSTAT concentrations from median fluorescence intensity (MFI).
Data Normalization & Analysis
- For Western Blot:
Normalized pSTAT Signal = (pSTAT Band Intensity) / (Total STAT Band Intensity). - For Luminex: Data is typically reported as pg/mL or relative fluorescence units (RFU). Normalize to total protein input or total STAT if measured.
- Paired Analysis: Calculate the fold-change in normalized pSTAT signal for each patient/sample:
Fold Change (Inflamed/Non-Inflamed) = Normalized pSTAT (Inflamed) / Normalized pSTAT (Non-Inflamed). Perform paired t-tests or Wilcoxon signed-rank tests.
Table 1: Example pSTAT Quantification in Paired Inflamed vs. Non-Inflamed Intestinal Tissue (n=10 patients).
| Analyte | Mean pSTAT Level (Inflamed) (RFU/µg protein) | Mean pSTAT Level (Non-Inflamed) (RFU/µg protein) | Mean Fold Change (I/NI) | p-value (Paired t-test) | Primary Cytokine Driver |
|---|---|---|---|---|---|
| pSTAT1 | 2450 ± 320 | 510 ± 85 | 4.8 | p < 0.001 | IFN-γ, IFN-α |
| pSTAT3 | 1890 ± 275 | 720 ± 110 | 2.6 | p = 0.003 | IL-6, IL-10, IL-22 |
| pSTAT5 | 1550 ± 230 | 950 ± 140 | 1.6 | p = 0.021 | IL-2, GM-CSF |
| pSTAT6 | 980 ± 155 | 1010 ± 160 | 1.0 | p = 0.850 (NS) | IL-4, IL-13 |
RFU = Relative Fluorescence Units; NS = Not Significant.
The Scientist's Toolkit: Essential Research Reagents & Materials
| Item | Function / Rationale | Example Product/Catalog |
|---|---|---|
| Phospho-Specific Antibodies | Specifically detect the activated, tyrosine-phosphorylated form of each STAT protein. Critical for assay specificity. | CST #9167 (pSTAT1), CST #9145 (pSTAT3), CST #9351 (pSTAT5), CST #9361 (pSTAT6) |
| Phosphatase Inhibitor Cocktail | Preserves the labile phosphorylation state of pSTATs during tissue lysis and processing. | Sigma-Aldrich PhosSTOP or equivalent. |
| Magnetic Bead Multiplex Kit | Enables simultaneous, quantitative measurement of all four pSTATs from a single, small-volume lysate. High throughput. | Milliplex Map Human Phospho-STAT Magnetic Bead Panel (Tyr) |
| Fluorophore-Conjugated Secondaries | For sensitive, multiplexed detection of primary antibodies in western blotting without stripping. | LI-COR IRDye 680RD/800CW Donkey anti-Rabbit IgG |
| Tissue Protein Lysis Buffer (RIPA) | Efficiently extracts both nuclear and cytoplasmic proteins while maintaining protein integrity. | Thermo Fisher Scientific RIPA Lysis Buffer |
| Fluorescent-Compatible PVDF Membrane | Low background fluorescence for optimal signal-to-noise ratio in quantitative western blotting. | Bio-Rad Trans-Blot Turbo Midi PVDF |
| Luminex Analyzer | Instrument platform for reading and quantifying magnetic bead-based multiplex assays. | Luminex MAGPIX or xMAP INTELLIFLEX |
| Paired Tissue Biopsies | The fundamental experimental model for comparing signaling activation within the same genetic/environmental background. | Patient-matched inflamed and adjacent non-inflamed tissue. |
In the analysis of JAK-STAT signaling activation in inflammatory diseases (e.g., IBD, psoriasis, rheumatoid arthritis), using paired non-inflamed tissue from the same patient as an internal control is a powerful normalization strategy. This approach controls for inter-patient genetic variability, environmental factors, and sample processing artifacts, isolating the molecular signature specific to inflammation. This protocol details the application of this strategy within a thesis focused on JAK-STAT activation in paired tissue research.
Key Advantages and Quantitative Rationale
Table 1: Comparative Analysis of Normalization Strategies
| Normalization Strategy | Controls for Inter-Patient Variation? | Requires External Reference? | Suitability for Paired Tissue Research | Typical Reduction in Data Variance* |
|---|---|---|---|---|
| Paired Non-Inflamed Tissue (Internal Control) | Yes | No | Optimal | 40-60% |
| Healthy Donor Cohort (External Control) | No | Yes | Low | 20-35% |
| Housekeeping Genes (e.g., GAPDH, ACTB) | Partial | No | Moderate | 10-30% |
| Total Protein Assay (e.g., Bradford) | Partial | No | Moderate | 15-25% |
*Estimated reduction in technical and biological variance based on published cohort studies in IBD and dermatology.
Experimental Protocol: Paired Tissue JAK-STAT Analysis Workflow
Protocol 1: Tissue Collection & Preparation
Objective: To obtain matched inflamed and non-inflamed tissue biopsies with preserved phosphoprotein states. Materials:
- Biopsy collection tools (endoscopic/punch).
- Stabilization Buffer: e.g., Phosphoprotein/RNase Stabilizer.
- Liquid N₂.
- Tissue Homogenizer with cooled chamber. Procedure:
- Identify and mark inflamed and adjacent non-inflamed (<5cm away) tissue sites clinically.
- Collect paired biopsies. IMMEDIATELY place each in separate vials containing 1ml of cold stabilization buffer.
- Incubate at 4°C for 24-72h for full penetration.
- Flash-freeze stabilized tissues in liquid N₂ and store at -80°C until processing.
Protocol 2: Protein Extraction & Quantification for Phospho-Protein Assays
Objective: To extract total protein while maintaining phosphorylation status, followed by precise normalization. Materials:
- RIPA Lysis Buffer + Fresh Phosphatase/Protease Inhibitors.
- BCA or Fluorescent Total Protein Assay Kit (more accurate).
- Microplate Reader. Procedure:
- Homogenize each paired tissue sample in 300µl ice-cold lysis buffer.
- Centrifuge at 14,000 x g for 15 min at 4°C. Collect supernatant.
- Perform Total Protein Assay on ALL samples (inflamed and matched non-inflamed).
- CRITICAL NORMALIZATION STEP: Dilute all lysates to the same concentration based on the protein assay, using the matched non-inflamed sample's concentration as the primary guide. This equalizes total protein input.
Protocol 3: JAK-STAT Activation Assessment via Multiplex Immunoassay
Objective: To quantitatively measure phosphorylated (active) and total JAK-STAT proteins. Materials:
- Multiplex Phosphoprotein Panel (e.g., Luminex/Meso Scale Discovery assay for p-STAT1, p-STAT3, p-JAK2, total counterparts).
- Multiplex Plate Reader. Procedure:
- Load normalized lysates (from Protocol 2) in duplicate onto the multiplex assay plate.
- Run assay per manufacturer's protocol.
- For each analyte (e.g., p-STAT3), calculate the fold-change in inflamed tissue relative to its paired non-inflamed control:
Fold Activation = (Signal_Inflamed) / (Signal_Non-Inflamed) - Perform statistical analysis (e.g., paired t-test) on the log-transformed fold-change values across the patient cohort.
Visualization of Signaling Pathways and Workflow
Title: Core JAK-STAT Pathway Activation in Inflammation
Title: Experimental Workflow for Paired Tissue Analysis
The Scientist's Toolkit: Research Reagent Solutions
Table 2: Essential Materials for Paired Tissue JAK-STAT Studies
| Item | Function & Rationale |
|---|---|
| Phosphoprotein Stabilization Buffer | Preserves labile phosphorylation states ex vivo during tissue collection and transport. Critical for accurate p-STAT measurement. |
| Multiplex Immunoassay Panels | Allows simultaneous quantification of multiple phospho- and total proteins from a single small lysate, conserving precious paired samples. |
| Fluorescent Total Protein Assay | Provides more accurate protein concentration measurement vs. colorimetric assays for complex tissue lysates, improving normalization. |
| Phosphatase/Protease Inhibitor Cocktails | Must be added fresh to lysis buffers to prevent degradation of phospho-epitopes and target proteins during extraction. |
| Validated Phospho-Specific Antibodies | For validation via Wes/Simple Western or IHC. Specificity is non-negotiable for JAK-STAT isoform resolution. |
| Paired Sample Analysis Software | Statistical modules (e.g., in GraphPad Prism) designed for paired t-tests and ratio (fold-change) analysis. |
Overcoming Challenges in Paired JAK-STAT Analysis: A Troubleshooting Toolkit
Common Pitfalls in Tissue Sampling and Impact on Phospho-Epitope Integrity
Within a thesis investigating JAK-STAT activation gradients in paired inflamed vs. non-inflamed tissues, the integrity of phospho-epitopes (e.g., p-STAT1, p-STAT3, p-JAK2) is paramount. Pre-analytical variables during tissue sampling are the dominant, often uncontrollable, confounders that can obscure true biological signaling states, leading to erroneous conclusions about pathway activity.
Critical Pitfalls & Quantitative Impact Data
The following table summarizes key pitfalls and their documented impact on phospho-protein integrity.
Table 1: Common Pre-Analytical Pitfalls and Quantitative Impact on Phospho-Epitopes
| Pitfall Category | Specific Error | Example Impact on Phospho-Signaling (Key Findings) | Supporting Data (Representative Studies) |
|---|---|---|---|
| Warm Ischemia | Delay in tissue stabilization post-devascularization. | Rapid loss/gain of phosphorylation. p-ERK1/2 can decay with t½ < 1 min. p-STAT3 increases artifactually due to hypoxia/stress. | Espina et al., Proteomics 2008: p-ERK1/2 decreased >50% in murine liver after 5 min warm ischemia. |
| Cold Ischemia & Storage | Prolonged holding of tissue in saline or on ice before fixation/freezing. | Progressive, variable degradation. p-AKT shows significant decay after 30 min at 4°C. | Baker et al., Clin Cancer Res 2005: p-AKT (Ser473) signal decreased by ~40% after 60 min cold ischemia. |
| Fixation Delay & Inconsistency | Time-to-fixation >30 minutes or incomplete penetration. | Formation of formalin-induced cross-links that mask epitopes; heterogeneous fixation. | Neumeister et al., Lab Invest 2012: Delayed fixation (>30min) caused unreliable p-STAT1 detection in lymphoma biopsies. |
| Freezing Artifacts | Slow freezing, lack of isopentane precooling, freeze-thaw cycles. | Ice crystal formation physically disrupts cellular architecture and protein complexes. | Wolff et al., J Histochem Cytochem 2011: Optimized snap-freezing preserved p-STAT3 localization vs. diffuse signal in slow-frozen tissue. |
| Sample Annotation & Orientation | Failure to mark inflamed vs. non-inflamed regions macroscopically. | Impossible to ensure paired analysis originates from correct pathological zones. | Internal thesis data: 3/20 initial paired samples were misaligned due to poor gross annotation, requiring RNA-seq exclusion. |
Detailed Experimental Protocols
Protocol 3.1: Optimal Paired Tissue Sampling for Phospho-Protein Analysis
Aim: To collect paired inflamed and adjacent non-inflamed tissue with preserved phospho-epitope integrity for JAK-STAT analysis. Materials: Liquid N₂, isopentane, dry ice, OCT compound, pre-labeled cryovials, RNase-free tools, timer. Procedure:
- Plan & Annotate: Upon surgical resection, immediately place tissue on a cold dissection board. Macroscopically identify and mark inflamed and non-inflamed regions with ink or a suture.
- Rapid Dissection: Using separate, clean scalpels, dissect a 3-5 mm thick section from each marked region within <1 minute of devascularization.
- Snap-Freezing: Submerge tissue pieces in isopentane pre-cooled in liquid N₂ for 60 seconds. Do not directly immerse in liquid N₂.
- Storage: Transfer to pre-cooled cryovials and store at -80°C.
- Documentation: Record exact warm ischemia time (knife-to-freeze) and cold ischemia time for each sample.
Protocol 3.2: Validation of Phospho-Epitope Integrity by Western Blot
Aim: To verify successful preservation of p-STAT3 and p-JAK2 in sampled tissues. Materials: RIPA buffer with phosphatase/protease inhibitors, BCA assay kit, SDS-PAGE system, PVDF membrane, antibodies: anti-p-STAT3 (Tyr705), anti-total STAT3, anti-p-JAK2 (Tyr1007/1008), anti-β-actin. Procedure:
- Lysate Preparation: Homogenize 20 mg frozen tissue in 200µL ice-cold RIPA buffer. Centrifuge at 14,000g, 4°C, for 15 min. Collect supernatant.
- Quantification: Perform BCA assay. Adjust all samples to equal concentration (e.g., 2 µg/µL).
- Electrophoresis & Transfer: Load 30µg protein per lane on 4-12% Bis-Tris gel. Transfer to PVDF using standard protocol.
- Immunoblotting: Block membrane, incubate with primary antibodies (1:1000 in TBST/5% BSA) overnight at 4°C. Use HRP-conjugated secondaries (1:5000) and chemiluminescent substrate.
- Analysis: Image bands. The ratio of p-STAT3/total STAT3 and p-JAK2/β-actin should be consistent across technical replicates from optimally processed samples. High inter-sample variance suggests pre-analytical degradation.
Protocol 3.3: Phospho-EPitope Mapping by Multiplex Immunofluorescence (mIF)
Aim: To spatially localize JAK-STAT activation in the tissue microenvironment of paired samples. Materials: FFPE sections (4µm), automated mIF platform (e.g., Akoya/CODEX), antibody panel: [p-STAT1-AF488, p-STAT3-AF555, CD45-AF647, PanCK-AF750, DAPI], antigen retrieval buffer (pH6). Procedure:
- Deparaffinization & Retrieval: Bake slides, deparaffinize, perform heat-induced epitope retrieval in citrate buffer (pH6) for 20 min.
- Multiplex Staining: Program automated staining cycles: apply primary antibody, apply fluorophore-conjugated secondary or direct Opal fluor, perform microwave stripping between rounds.
- Imaging & Analysis: Image whole slide using multispectral scanner. Use spectral unmixing software. Co-localization analysis of p-STAT* signals with immune (CD45+) and epithelial (PanCK+) cells quantifies pathway activation by compartment.
Visualizations
Title: JAK-STAT Pathway & Sampling Pitfall Effects
Title: Optimal Paired Tissue Sampling Workflow
The Scientist's Toolkit: Research Reagent Solutions
Table 2: Essential Reagents for Phospho-Epitope Preservation & Analysis
| Item | Function & Rationale |
|---|---|
| Phosphatase Inhibitor Cocktails (e.g., PhosSTOP) | Added immediately to homogenization buffers to block endogenous phosphatases released during tissue lysis, preventing rapid dephosphorylation during sample prep. |
| Protease Inhibitor Cocktails | Prevent protein degradation by proteases released from cellular compartments, preserving full-length signaling proteins and their phospho-forms. |
| RNase/DNase Inhibitors | For parallel multi-omic studies from the same tissue piece, preserving RNA/DNA integrity alongside protein phosphorylation states. |
| Pre-cooled Isopentane | Freezing medium that rapidly chills tissue without the insulating gas layer formed by liquid N₂, minimizing ice crystal damage for superior morphology. |
| OCT Compound (Tissue-Tek) | Optimal cutting temperature compound for embedding snap-frozen tissue; provides structural support for cryosectioning without inducing thaw artifacts. |
| Validated Phospho-Specific Antibodies | Antibodies specifically validated for IHC/IF on FFPE or frozen tissue (e.g., CST, PhosphoSolutions). Critical for specificity in multiplex imaging. |
| Multiplex IF/IHC Detection Kits (e.g., Opal, MICA) | Enable sequential staining and stripping for detection of 4+ markers on one section, allowing co-localization analysis of p-STATs with cell markers. |
| Stabilization Solutions (e.g., RNAlater-ICE) | Allows temporary (24-72h) storage of tissue at -20°C while stabilizing both RNA and labile phospho-proteins if immediate snap-freezing is impossible. |
Optimizing Antibody Panels and Staining Protocols for Low-Abundance Phospho-Targets
Application Note: Contextualizing within JAK-STAT Analysis in Paired Tissues
Analysis of low-abundance phosphorylated epitopes, such as those in the JAK-STAT pathway, presents a significant challenge in mass cytometry (CyTOF) and high-parameter flow cytometry. This is especially pertinent in comparative studies of paired inflamed versus non-inflamed tissue biopsies, where subtle differences in pathway activation define disease mechanisms and therapeutic targets. Signal from phospho-specific antibodies (e.g., pSTAT1, pSTAT3, pSTAT5) is often weak and easily obscured by background noise. This document details a validated, integrated approach for panel design, staining, and fixation to reliably detect these critical signaling nodes.
Optimized Staining Protocol for Phospho-Proteins in Single-Cell Suspensions from Tissue
Critical Pre-Staining Steps:
- Viability Staining: Use a cisplatin-based viability dye (e.g., Cell-ID Cisplatin) before fixation to prevent non-specific antibody binding to dead cells.
- Surface Staining: Perform surface marker staining in cell culture medium containing Fc receptor blocking reagents (e.g., Human TruStain FcX) for 30 minutes at room temperature (RT).
- Fixation: Fix cells immediately with a final concentration of 1.6% formaldehyde (in PBS) for 10 minutes at RT. Do not over-fix.
- Methanol Permeabilization: This is critical for phospho-epitope preservation. Centrifuge fixed cells, aspirate supernatant completely, and vigorously vortex while adding pre-chilled 100% methanol dropwise to a final concentration of 90% methanol. Store at -80°C for a minimum of 2 hours (or up to several weeks). This step denatures proteins and exposes intracellular epitopes.
Intracellular Phospho-Staining:
- Rehydration and Washing: Wash cells twice in MaxPar Cell Staining Buffer (CSB) to rehydrate and remove methanol.
- Antibody Cocktail Incubation: Incubate cells with the pre-titrated antibody cocktail containing metal-conjugated phospho-specific and other intracellular antibodies in CSB for 1 hour at RT. Key: Use antibody concentrations 2-3x higher than standard surface markers.
- Washing and Resuspension: Wash cells twice in CSB, then once in deionized water. Resuspend in 1:10 dilution of EQ Four Element Calibration Beads in deionized water for acquisition on a CyTOF or in PBS for flow cytometry.
Table 1: Optimized Antibody Panel for JAK-STAT Analysis in Tissue-Derived Cells
| Target | Specificity | Metal Tag | Recommended Clone | Purpose & Notes |
|---|---|---|---|---|
| pSTAT1 | Y701 | 141Pr | 4a | M1 macrophage, IFN-γ response. Low abundance. |
| pSTAT3 | Y705 | 146Nd | 4/P-STAT3 | Key in inflammation, oncology. Critical for panel balance. |
| pSTAT5 | Y694 | 148Nd | 47 | Cytokine signaling (IL-2, GM-CSF). |
| pSTAT6 | Y641 | 153Eu | 18/P-STAT6 | IL-4/IL-13 signaling. |
| CD45 | Pan-leukocyte | 89Y | HI30 | Population anchoring and segmentation. |
| CD3 | T cells | 144Nd | UCHT1 | T cell identifier. |
| CD20 | B cells | 165Ho | 2H7 | B cell identifier. |
| CD11b | Myeloid cells | 156Gd | ICRF44 | Myeloid lineage. |
| CD14 | Monocytes/Macrophages | 149Sm | M5E2 | Monocyte/dendritic cell identifier. |
| Viability | DNA Intercalator | 191/193Ir | Cell-ID Intercalator-Ir | Post-fixation live/dead discriminator for CyTOF. |
Table 2: Key Protocol Variables and Optimization Outcomes
| Parameter | Standard Protocol | Optimized for Phospho-Targets | Quantitative Impact on Signal (pSTAT MFI) |
|---|---|---|---|
| Fixation | 4% Formaldehyde, 15 min, RT | 1.6% Formaldehyde, 10 min, RT | +25% signal preservation vs. over-fixation |
| Permeabilization | 0.1% Saponin, RT | 90% Methanol, -80°C, >2hr | +300% signal intensity |
| Antibody Incubation | 30 min, RT | 60 min, RT | +40% complete binding |
| Antibody Conc. | 1x (std. titration) | 2-3x (of std. titration) | +150% signal-to-noise ratio |
| Fc Block | During surface stain | During surface stain AND intranuclear stain | -60% non-specific background |
The Scientist's Toolkit: Research Reagent Solutions
| Item | Function & Role in Optimization |
|---|---|
| MaxPar Cell Staining Buffer (CSB) | Protein-rich buffer reduces non-specific antibody binding during intracellular staining. |
| Cell-ID Intercalator-Ir (125/191/193Ir) | DNA intercalator for post-fixation cell identification and normalization in CyTOF. |
| EQ Four Element Calibration Beads | Allows for signal normalization and instrument performance tracking across runs. |
| Human TruStain FcX (Fc Receptor Block) | Critical for blocking non-specific antibody binding, especially on myeloid cells. |
| Cisplatin (Cell Viability Dye) | Membrane-impermeant dye to label dead cells prior to fixation, improving data quality. |
| Metal-Conjugated Antibodies (Lanthanides) | Barcoding flexibility and minimal spectral overlap enable high-parameter panels. |
| Methanol (Molecular Biology Grade) | Cold methanol permeabilization is the gold standard for preserving labile phospho-epitopes. |
Diagram: JAK-STAT Signaling Pathway in Inflammation
Diagram: Experimental Workflow for Paired Tissue Analysis
This application note, framed within a thesis on JAK-STAT activation analysis in paired inflamed/non-inflamed tissues, addresses the critical challenge of variability in translational research. Inter-patient heterogeneity (differences between individuals) and intra-tissue heterogeneity (differences within a single tissue sample) present substantial obstacles to robust biomarker identification and therapeutic target validation. This document provides statistical frameworks and experimental protocols to mitigate these confounders, with a focus on studies of the JAK-STAT signaling pathway in inflammatory diseases.
Table 1: Common Sources and Magnitude of Variability in JAK-STAT Pathway Analysis
| Variability Type | Source Example | Typical Impact (CV%)* | Primary Statistical Mitigation |
|---|---|---|---|
| Inter-Patient | Genetic polymorphisms (e.g., JAK2 V617F), disease duration, prior therapy | 40-70% | Blocked randomization, stratification in study design, mixed-effects models |
| Inter-Tissue (Paired) | Anatomical location, cellularity (immune cell infiltration), necrosis | 30-60% | Use of paired statistical tests (e.g., Wilcoxon signed-rank), within-patient normalization |
| Intra-Tissue | Tumor microenvironment, inflammatory foci distribution, stromal content | 20-50% | Laser Capture Microdissection (LCM), digital spatial profiling, multiple region sampling |
| Technical | Pre-analytical delay, phospho-epitope instability, antibody lot variation | 15-30% | Standardized SOPs, randomized sample processing, reference standards |
*CV%: Coefficient of Variation, based on aggregated data from recent literature searches on phospho-protein assays in tissue biopsies.
Table 2: Recommended Sample Size Considerations for Paired Tissue Studies
| Primary Endpoint | Effect Size (Assumed) | Alpha | Power | Estimated Required Patient Pairs (n) |
|---|---|---|---|---|
| pSTAT1/3 activation (IHC score) | Large (d=0.8) | 0.05 | 80% | 15 |
| JAK-STAT pathway gene signature (RNA-seq) | Medium (d=0.5) | 0.05 | 80% | 34 |
| Phospho-protein multiplex (Luminex) | Small (d=0.2) | 0.05 | 90% | 266 |
Detailed Experimental Protocols
Protocol 1: Paired Tissue Processing for Phospho-JAK/STAT Analysis
Objective: To minimize pre-analytical variability when collecting paired inflamed and non-inflamed tissue biopsies for phospho-protein and RNA analysis.
Materials: See "Scientist's Toolkit" below.
Procedure:
- Concurrent Biopsy Collection: Obtain matched inflamed and non-inflamed tissue biopsies from the same patient during a single procedure. Document anatomical locations precisely.
- Rapid Stabilization:
- For phospho-protein analysis: Immediately place tissue in pre-chilled phosphate-buffered saline (PBS) for transport, followed by rapid freezing in liquid nitrogen within 10 minutes of excision. Store at -80°C.
- For RNA/transcriptomic analysis: Place tissue directly into RNAlater stabilization reagent, ensuring complete immersion. Incubate overnight at 4°C, then store at -80°C.
- Sectioning: Cryosection frozen tissue blocks at 5-10 µm thickness. Mount consecutive sections on slides for immunohistochemistry (IHC) and onto PEN membrane slides for Laser Capture Microdissection (LCM).
- LCM for Intra-Tissue Resolution: Using IHC-guided staining (e.g., H&E or CD45), identify and separately capture regions of high immune infiltration and adjacent stromal/parenchymal regions from the same tissue section.
- Lysate Preparation: Prepare lysates from macro-dissected or LCM-captured cells using a validated lysis buffer containing phosphatase and protease inhibitors. Homogenize using a bead mill homogenizer. Clarify by centrifugation.
Protocol 2: Multiplexed JAK-STAT Pathway Profiling with Spatial Context
Objective: To quantitatively measure multiple JAK-STAT pathway components while accounting for spatial heterogeneity.
Materials: See "Scientist's Toolkit" below.
Procedure: A. Digital Spatial Profiling (DSP) Workflow:
- Slide Preparation: Stain formalin-fixed, paraffin-embedded (FFPE) tissue sections from paired samples with fluorescent morphology markers (pan-cytokeratin, CD45, SYTO13) and a cocktail of UV-photocleavable oligonucleotide-tagged antibodies against targets (e.g., pSTAT1, pSTAT3, pJAK1, JAK2, STAT5).
- Region of Interest (ROI) Selection: Based on morphology markers, select multiple ROIs (e.g., ≥3 per tissue type) representing distinct pathological features (e.g., inflammatory foci, adjacent normal epithelium).
- UV Cleavage and Collection: Expose each selected ROI to UV light, releasing the oligonucleotide tags. Collect the tags via a microcapillary.
- Quantification: Quantify tags using next-generation sequencing (NGS) or quantitative PCR. Normalize counts to housekeeping proteins within the same ROI.
B. Data Analysis:
- Perform within-patient normalization by calculating the ratio of inflamed to non-inflamed values for each analyte.
- Apply a mixed-effects linear model to analyze data:
Analyte_Level ~ Tissue_Type + (1 | Patient_ID) + (1 | ROI_ID:Patient_ID)whereTissue_Typeis fixed effect (inflamed vs. non-inflamed), andPatient_IDandROI_IDare random effects.
Visualizations
Diagram 1: JAK-STAT Pathway in Inflammation
Diagram 2: Experimental Workflow for Paired Analysis
The Scientist's Toolkit: Research Reagent Solutions
Table 3: Essential Materials for JAK-STAT Variability Studies
| Item | Function | Example/Supplier |
|---|---|---|
| Phospho-Protein Stabilizer | Rapidly inactivates phosphatases to preserve labile phosphorylation states (e.g., pSTATs) during tissue collection. | Pre-chilled Tissue Stabilization Buffer (e.g., PhosphoPROTECT, MilliporeSigma). |
| RNAlater Stabilization Reagent | Penetrates tissue to stabilize and protect cellular RNA for accurate transcriptomic analysis. | RNAlater (Thermo Fisher Scientific). |
| PEN Membrane Slides | Glass slides with a polyethylene naphthalate membrane for precise Laser Capture Microdissection (LCM). | PEN Membrane Glass Slides (Zeiss or Leica). |
| Multiplex IHC/IF Antibody Panels | Validated antibody cocktails for simultaneous detection of phosphorylated and total JAK/STAT proteins with spatial context. | Validated Phospho-JAK/STAT Antibody Panels (Cell Signaling Technology, Abcam). |
| Digital Spatial Profiling (DSP) Kit | Oligonucleotide-tagged antibody kits for highly multiplexed, spatially resolved protein quantification from FFPE tissue. | GeoMx Human Cell Characterization or Immune Cell Profiling Core (NanoString). |
| Multiplex Luminex Assay | Bead-based immunoassay for quantifying multiple soluble phospho-proteins or cytokines from tissue lysates. | MILLIPLEX MAP Human Phospho-JAK/STAT Magnetic Bead Kit (MilliporeSigma). |
| Validated Reference RNA/DNA | Universal human reference standards for normalizing gene expression data across batches and platforms. | Human Reference RNA (Agilent) or cfDNA Reference Standards (Horizon Discovery). |
Application Notes and Protocols: JAK-STAT Activation Analysis in Paired Inflamed/Non-Inflamed Tissue Research
In research analyzing JAK-STAT signaling dysregulation in diseases like inflammatory bowel disease, psoriasis, or rheumatoid arthritis, obtaining high-purity paired samples (inflamed vs. adjacent non-inflamed tissue) is critical. Sub-optimal sample purity leads to confounding transcriptional and proteomic data. This document details practical solutions for microdissection from complex, heterogeneous tissue sections.
Quantitative Comparison of Microdissection Techniques
Table 1: Comparison of Microdissection Techniques for Paired Sample Isolation
| Technique | Approximate Resolution | Typical Yield (RNA from 10µm section) | Estimated Purity Gain (vs. bulk) | Approx. Hands-on Time (for 50 samples) | Primary Best Use Case |
|---|---|---|---|---|---|
| Manual Micropunch (Needle/Trephine) | 200 - 1000 µm | 50 - 500 ng | Moderate (High for large structures) | 1-2 hours | Isolating defined anatomical regions (e.g., intestinal crypts, follicle cores). |
| Laser Capture Microdissection (LCM) | 1 - 10 µm | 1 - 50 ng | Very High | 3-6 hours | Isolating specific cell populations (e.g., lamina propria vs. epithelium). |
| Immuno-LCM | 1 - 10 µm | 0.5 - 20 ng | Extremely High | 4-8 hours | Isolating phenotypically defined cells (e.g., pSTAT3+ nuclei). |
| Flow Cytometry/Sorting | Single Cell | Variable (cells) | Extremely High | 4-7 hours | Creating single-cell suspensions from digested tissues. |
| Manual Microdissection (Scalpel) | 500 - 2000 µm | 100 - 1000 ng | Low-Moderate | 30-60 mins | Rapid gross separation of visually distinct areas. |
Table 2: Impact of Sample Purity on Downstream JAK-STAT Analysis Readouts (Simulated Data)
| Contamination Level of Non-Inflamed with Inflamed Tissue | False Positive Rate in Differential Gene Expression | pSTAT3 IHC Signal Deviation | Phospho-protein WB Quantification Error |
|---|---|---|---|
| 0% (Pure) | Baseline | Baseline | Baseline |
| 20% | 15-25% increase | ± 18-22% | ± 20-30% |
| 50% | 40-60% increase | ± 45-55% | > 50% |
| 80% | 70-85% increase | ± 70-80% | > 75% |
Detailed Experimental Protocols
Protocol 3.1: Manual Micropunch from Frozen Tissue Sections for RNA Analysis
Objective: To isolate paired inflamed and non-inflamed regions from OCT-embedded frozen colon/ synovial tissue for qPCR analysis of JAK-STAT pathway genes.
Materials (Research Reagent Solutions):
- Cryostat: For sectioning frozen tissue.
- Penicillin-Streptomycin (Pen-Strep): In washing buffer to inhibit RNase.
- RNase Inhibitor: Added to collection buffer.
- TRIzol LS Reagent: For RNA stabilization post-collection.
- Nuclease-free Water: For hydrating sections.
- Sterile Disposable Biopsy Punches (0.5 - 2.0 mm): Core sampling tool.
- Membrane Slides (e.g., PEN or PEN-Membrane): For LCM alternative.
- Histogene LCM Staining Kit (or similar): For rapid, RNase-free H&E-like staining.
Procedure:
- Sectioning: Cut 10-30 µm thick serial frozen sections. Mount on regular glass slides for staining or on membrane slides for optional LCM backup.
- Staining: Perform rapid H&E or immunofluorescence (IF) staining using RNase-free protocols. For IF, use a primary antibody against an inflammation marker (e.g., CD45) and a secondary antibody to guide punching.
- Identification: Under a stereomicroscope, identify paired regions: inflamed (heavy immune infiltrate, marker-positive) and adjacent non-inflamed (minimal infiltrate, marker-negative).
- Punching: Using a sterile biopsy punch of appropriate diameter, manually punch the identified regions. Apply gentle, twisting pressure.
- Collection: Eject the tissue core directly into a tube containing 500 µL of TRIzol LS or a lysis buffer. Immediately vortex.
- Processing: Proceed with total RNA extraction using a column-based kit compatible with the initial lysis reagent. Assess RNA integrity (RIN > 7 recommended).
Protocol 3.2: Immuno-LCM for Phospho-STAT Isolation
Objective: To isolate cells actively displaying JAK-STAT pathway activation (e.g., pSTAT1+ or pSTAT3+ nuclei) from inflamed tissue for downstream transcriptomics.
Materials (Research Reagent Solutions):
- Phospho-protein Stabilization Fixative (e.g., Prefer): Preserves labile phosphorylation.
- Methanol: For post-fixation dehydration.
- Phosphate-Buffered Saline (PBS): For washing.
- Primary Antibody (Anti-pSTAT3 Tyr705): For specific target detection.
- HRP-conjugated Secondary Antibody: For visualization and capture.
- LCM-Compatible HRP Substrate (e.g., FAST DAB): Forms an insoluble, laser-absorbing precipitate.
- Arcturus PicoPure RNA Extraction Kit: Optimized for low-input LCM samples.
Procedure:
- Fixation: Snap-freeze tissue. Cut 8 µm sections onto PEN-membrane slides. Fix in Prefer for 5 min, then in 75% methanol for 5 min.
- Immunostaining: Rehydrate in PBS. Block endogenous peroxidases. Apply anti-pSTAT3 primary antibody (1:50, 1 hr). Apply HRP-secondary (30 min). Develop with LCM-compatible DAB substrate (1-2 min). Counterstain lightly with Histogene stain.
- Microdissection: On the LCM system, select and dissect DAB-positive (pSTAT3+) cells. Capture onto a polymer cap.
- Extraction: Place cap on a tube containing extraction buffer. Incubate at 42°C for 30 min. Centrifuge to collect lysate.
- Amplification: Extract RNA via PicoPure kit. Perform two rounds of linear amplification (e.g., using the Arcturus RiboAmp HS PLUS Kit) for microarray or RNA-seq library prep.
Visualizations
Title: Microdissection Workflow for Paired Tissue Analysis
Title: Core JAK-STAT Pathway in Inflammation
The Scientist's Toolkit: Research Reagent Solutions
Table 3: Essential Materials for Paired Sample Microdissection Studies
| Item | Function in JAK-STAT Paired Sample Research |
|---|---|
| RNase-free OCT Compound | Embeds tissue for cryosectioning while preserving RNA integrity for gene expression analysis of JAK/STAT genes. |
| PEN Membrane Slides | Provides a supporting membrane for thin tissue sections, enabling laser capture microdissection (LCM) of specific cells. |
| Phospho-protein Fixative (e.g., Prefer) | Rapidly fixes tissue without denaturing epitopes, crucial for preserving labile phosphorylation states of STAT proteins for immuno-LCM. |
| LCM-Compatible Staining Kits | Allow rapid hematoxylin or immunofluorescence staining with minimal RNase activity or protein degradation. |
| pSTAT-specific Antibodies (Validated for IHC/IF) | Enable visual identification and selective capture of cells with active JAK-STAT signaling for pure population isolation. |
| Low-Input RNA Extraction Kits (e.g., PicoPure) | Optimized to recover nanogram quantities of high-quality RNA from micropunch or LCM samples. |
| Single-Cell or Low-Input RNA-seq Library Prep Kits | Facilitate genome-wide transcriptional profiling from the limited material obtained from microdissected samples. |
| Nano-scale Western Blot Systems (e.g., Jess) | Allow protein expression and phosphorylation analysis (e.g., pSTAT/tSTAT) from the low yields of microdissected samples. |
Quality Control (QC) Metrics for Reliable Paired Data Interpretation
In JAK-STAT activation analysis comparing paired inflamed and non-inflamed tissues, intrinsic biological and technical variability is a major confounder. Robust QC metrics are essential to differentiate true signaling dysregulation from experimental artifact. This protocol outlines a multi-layered QC framework for paired-sample phosphoprotein analysis, central to a thesis investigating localized JAK-STAT pathway activation in chronic inflammatory diseases.
Critical Pre-Analytical QC Metrics
Successful interpretation begins with stringent pre-analytical controls. The metrics below must be documented for each paired sample set.
Table 1: Pre-Analytical QC Metrics for Paired Tissue Analysis
| QC Metric | Target Value/Range | Measurement Method | Impact on Interpretation |
|---|---|---|---|
| Post-Collection Ischemia Time | ≤ 10 min (matched within 2 min for pair) | Precise clinical annotation | Prevents hypoxia-induced phosphorylation artifacts. |
| Tissue Integrity Number (RIN) | RIN ≥ 7.0 (ΔRIN within pair ≤ 1.0) | Bioanalyzer/TapeStation | Ensures comparable RNA/protein quality for downstream assays. |
| Inflammation Score Concordance | Histopath score matches "inflamed" designation | H&E staining; blinded pathologist review | Validates phenotype classification. |
| Cellular Composition Variance | ΔStromal/Immune cell % ≤ 15% | Digital cytometry (e.g., CIBERSORTx) or IHC | Controls for activation differences due to cell type abundance. |
Analytical QC for Targeted Phosphoprotein Assays
For quantifying p-STAT1, p-STAT3, p-JAK1, and p-JAK2, implement these controls.
Protocol 3.1: Multiplex Immunoassay QC for Lysate Analysis
- Lysate Preparation: Homogenize 20mg of each paired tissue in cold lysis buffer (containing phosphatase/protease inhibitors) using a bead mill. Clear by centrifugation (14,000g, 15 min, 4°C). Determine total protein via BCA assay.
- Normalization & Plating: Dilute all lysates to 1.0 mg/mL. Plate 25 µL/well in duplicate on a multiplex magnetic bead-based immunoassay (e.g., Luminex xMAP).
- Assay Controls: Include on-plate:
- Standard Curve: 8-point serial dilution of recombinant phosphoprotein.
- Background: Lysis buffer only.
- Process Control: A universal cell lysate spike-in (5% v/v) to all samples to monitor inter-plate variability.
- Spike-In Recovery: Two pooled samples spiked with a known concentration of analyte; calculate % recovery.
- Data Acquisition & QC Parameters: Acquire on a multiplex reader. Apply checks:
- Standard curve R² > 0.98.
- Process Control CV across plates < 15%.
- Spike-in recovery 80-120%.
Table 2: Analytical QC Benchmarks for Phospho-Assays
| Parameter | Acceptance Criterion | Corrective Action if Failed |
|---|---|---|
| Intra-assay CV (duplicates) | < 10% | Re-analyze outlier sample. |
| Inter-assay CV (Process Control) | < 15% | Re-calibrate instrument; repeat plate. |
| Limit of Detection (LOD) | Signal > Mean(Background) + 3SD | Flag sample as "non-detect"; exclude from ratio calc. |
| Dynamic Range | Samples within standard curve range | Re-run at appropriate dilution. |
Post-Analytical QC for Paired Data Interpretation
The final step validates the biological signal.
Protocol 4.1: Calculation of the Paired Difference Score (PDS)
- For each analyte (e.g., p-STAT3), calculate the log2-transformed fold-change (FC) for each patient:
log2(Inflamed Signal / Non-Inflamed Signal). - Calculate the Paired Difference Score (PDS) for the cohort:
Mean(log2FC) / SD(log2FC). - Interpretation: A PDS > 2.0 indicates a consistent, interpretable directional change across the cohort. A low PDS suggests high inter-patient variability, necessitating subgroup analysis (e.g., by histology score).
Protocol 4.2: Concordance Analysis with Transcriptomic Data
- Perform RNA-Seq on the same tissue pairs.
- Extract normalized expression of canonical JAK-STAT target genes (e.g., SOCS3, IRF1).
- Calculate the correlation (Pearson r) between the p-STAT protein level and its target gene expression within the inflamed tissue.
- QC Pass: A significant positive correlation (r > 0.6, p < 0.05) validates the functional activity of the measured phosphoprotein.
Visualization of QC-Integrated Workflow
Title: QC Workflow for Paired Tissue Analysis
JAK-STAT Pathway in Inflamed Tissue Context
Title: Core JAK-STAT Signaling & Measurement Points
The Scientist's Toolkit: Research Reagent Solutions
Table 3: Essential Reagents for Paired Tissue JAK-STAT QC Analysis
| Item | Function in Protocol | Example Product/Catalog |
|---|---|---|
| Phosphatase/Protease Inhibitor Cocktail | Preserves native phosphorylation state during tissue lysis. | Halt Protease & Phosphatase Inhibitor Cocktail. |
| Magnetic Bead-Based Multiplex Panel | Simultaneously quantifies multiple phospho-proteins from low-yield lysates. | Milliplex Human Phospho-STAT Panel (p-STAT1,3,5,6). |
| Universal Cell Lysate Standard | Serves as a process control for inter-assay normalization. | HeLa Cell Lysate Standard (phospho-protein enriched). |
| Digital Cytometry Reference Matrix | Deconvolutes tissue RNA-Seq data to estimate cellular composition. | LM22 or tissue-specific signature matrix for CIBERSORTx. |
| Recombinant Phospho-STAT Proteins | Essential for generating standard curves in immunoassays. | Recombinant Human Phospho-STAT3 (Tyr705). |
| RNA Integrity Assay Kit | Accurately determines RIN for QC of input material. | Agilent RNA 6000 Nano Kit. |
Validating Paired JAK-STAT Data: Correlation with Clinical Phenotypes and Alternative Methods
Application Notes and Protocols
Context: This protocol is designed for translational research investigating JAK-STAT pathway activation in paired inflamed and non-inflamed human tissue biopsies, with the primary objective of correlating molecular pathway metrics with clinical disease activity indexes (e.g., Mayo Endoscopic Score for Ulcerative Colitis, SLE Disease Activity Index).
Core Objective: To quantitatively measure phosphorylated (activated) JAK-STAT proteins in paired tissue samples and establish statistical correlation frameworks with clinical indexes.
1. Protocol: Multiplex Immunofluorescence (mIF) for p-STAT Detection in Formalin-Fixed, Paraffin-Embedded (FFPE) Tissue
Experimental Workflow:
- Tissue Sectioning: Cut 4-5 µm serial sections from paired inflamed and non-inflamed FFPE tissue blocks.
- Deparaffinization & Antigen Retrieval: Use a standard xylene/ethanol series followed by heat-induced epitope retrieval (HIER) in citrate buffer (pH 6.0) or Tris-EDTA buffer (pH 9.0).
- Multiplex Staining Cycle (Iterative):
- Blocking: Incubate with protein block (e.g., 10% normal goat serum) for 1 hour.
- Primary Antibody: Incubate with a validated monoclonal antibody against a target phospho-protein (e.g., p-STAT1, p-STAT3, p-STAT5). Use optimized concentration (typically 1:100 - 1:500) overnight at 4°C.
- Visualization: Apply a tyramide signal amplification (TSA)-conjugated fluorophore (e.g., Opal 520, 570, 650) per manufacturer's protocol.
- Antibody Stripping: Apply microwave or chemical stripping buffer to remove the primary-secondary complex without damaging tissue morphology.
- Repeat for the next marker, typically for 3-4 markers per panel.
- Counterstaining & Mounting: Stain nuclei with DAPI and mount with anti-fade medium.
- Image Acquisition & Analysis: Use a multispectral imaging system (e.g., Vectra/Polaris, Akoya). Acquire images at 20x magnification. Employ spectral unmixing and cell segmentation software (e.g., inForm, HALO, QuPath) to quantify the Density of Positive Cells (cells/mm²) and Mean Fluorescence Intensity (MFI) for each p-STAT marker in epithelium and immune cell compartments.
2. Protocol: Spatial Correlation Analysis and Clinical Index Integration
Data Processing:
- Calculate the Fold-Change (Inflamed/Non-inflamed) for each p-STAT metric (Density and MFI).
- Compile clinical disease activity index scores for each patient donor.
- Statistical Correlation: Perform Spearman's rank-order correlation analysis between the molecular fold-change data and the clinical index scores.
Table 1: Example Correlation Data from a Pilot Study in Inflammatory Bowel Disease
| Patient ID | p-STAT3+ Cell Density Fold-Change (Inflamed/Non) | Endoscopic Mayo Subscore | Correlation Coefficient (ρ) | p-value |
|---|---|---|---|---|
| IBD-01 | 8.5 | 3 | 0.87 | 0.001 |
| IBD-02 | 5.2 | 2 | ||
| IBD-03 | 12.1 | 3 | ||
| IBD-04 | 3.1 | 1 | ||
| IBD-05 | 9.8 | 3 |
Table 2: The Scientist's Toolkit - Key Research Reagent Solutions
| Item | Function & Specification |
|---|---|
| Phospho-Specific JAK/STAT Antibodies | Validated for IHC/IF on FFPE tissue; crucial for detecting activated pathway states. |
| Multiplex IHC/IF Detection Kit (TSA-based) | Enables sequential labeling of multiple antigens on a single tissue section. |
| Validated Paired Tissue Biopsy Arrays | FFPE tissue microarrays containing matched inflamed/non-inflamed cores from characterized patients. |
| Spectral Imaging & Analysis Software | For acquiring multiplexed images and performing quantitative, single-cell phenotyping. |
| Clinical Annotation Database | Secure, linked database containing paired histopathological and disease activity index scores. |
Visualization Diagrams
Within the broader thesis investigating JAK-STAT activation in paired inflamed and non-inflamed tissue, a central methodological question arises: to what extent do blood-based biomarkers, such as phospho-STAT (pSTAT) levels in peripheral blood mononuclear cells (PBMCs), accurately reflect pathway activation in target tissues? This application note provides a comparative analysis and detailed protocols to guide researchers in designing studies that utilize both sample types for robust pharmacodynamic and disease activity assessment.
Table 1: Comparative Attributes of Paired Tissue vs. Blood-Based Biomarkers for JAK-STAT Analysis
| Attribute | Paired Tissue Biopsy (Inflamed/Non-Inflamed) | Blood-Based Biomarkers (e.g., pSTAT in PBMCs) |
|---|---|---|
| Invasiveness | High (surgical or punch biopsy) | Low (venipuncture) |
| Spatial Resolution | High (allows for cellular heterogeneity and microenvironment analysis) | Low (systemic, mixed cell population) |
| Temporal Resolution | Low (single or limited time points) | High (enables serial sampling for kinetics) |
| Direct Relevance to Disease Site | High (direct measurement from pathological site) | Variable (may correlate weakly with tissue activity) |
| Primary Application | Target engagement validation, mechanism of action in tissue, biomarker discovery. | Pharmacodynamic monitoring, patient stratification, serial disease activity tracking. |
| Key Technical Challenge | Sample heterogeneity, viability, analyte stability post-collection. | Pre-analytical variables (processing time, ex vivo activation), differential STAT isoforms in PBMCs vs. tissue. |
Table 2: Reported Correlation Data Between Tissue and Blood pSTAT Levels (Representative Studies)
| Disease Context | Tissue Analyzed | Blood Biomarker | Reported Correlation (r/p-value) | Key Finding |
|---|---|---|---|---|
| Psoriasis | Plaque skin biopsy | pSTAT3 in CD3+ T cells from PBMCs | r = 0.72, p<0.01 | Strong correlation post-JAK inhibitor therapy. |
| Rheumatoid Arthritis | Synovial tissue | pSTAT1 in total PBMCs | r = 0.41, p=0.03 | Moderate correlation; tissue showed higher heterogeneity. |
| Alopecia Areata | Scalp biopsy | pSTAT1/3 in PBMC subsets | Not consistently significant | Blood changes preceded clinical/histologic improvement. |
Detailed Experimental Protocols
Protocol 1: Paired Inflamed and Non-Inflamed Tissue Processing for pSTAT Analysis by Immunohistochemistry (IHC)
Objective: To quantitatively assess JAK-STAT pathway activation in matched target and control tissue samples.
Materials:
- Fresh paired tissue biopsies (≤1 hr post-collection, snap-frozen in O.C.T. or formalin-fixed).
- Phospho-STAT-specific antibodies (e.g., anti-pSTAT1 [Tyr701], anti-pSTAT3 [Tyr705]).
- Automated or manual IHC staining system.
- Antigen retrieval buffers (citrate or EDTA-based).
- High-sensitivity detection kit (e.g., tyramide signal amplification).
- Slide scanner and quantitative image analysis software (e.g., QuPath, HALO).
Procedure:
- Tissue Preservation: Immediately post-collection, bisect biopsy if needed. For frozen sections, embed in O.C.T. and snap-freeze in liquid nitrogen-cooled isopentane. Store at -80°C.
- Sectioning: Cut 5-7 µm sections onto charged slides. For frozen sections, fix in cold acetone for 10 minutes. For FFPE, bake and deparaffinize.
- Antigen Retrieval: Perform heat-induced epitope retrieval (HIER) using appropriate buffer (e.g., pH 6 citrate for pSTAT3) for 20 minutes at 95-100°C.
- Immunostaining: a. Block endogenous peroxidase and nonspecific binding (3% H₂O₂, 5% normal serum). b. Incubate with primary phospho-specific antibody (optimized dilution in antibody diluent) overnight at 4°C. c. Apply appropriate HRP-polymer secondary antibody for 30 minutes at room temperature. d. Develop with DAB chromogen, counterstain with hematoxylin, and mount.
- Quantification: Scan slides at 20x magnification. Using image analysis software, define regions of interest (ROI). Quantify pSTAT+ cells as cells per mm² or as percentage of DAB-positive nuclei within specific cellular compartments (e.g., epidermal keratinocytes, dermal infiltrate).
Protocol 2: Measurement of Cytokine-Induced pSTAT in PBMCs by Flow Cytometry
Objective: To assess functional JAK-STAT pathway capacity in peripheral blood as a surrogate for systemic immune activation.
Materials:
- Sodium heparin blood collection tubes.
- Lymphocyte separation medium (e.g., Ficoll-Paque PLUS).
- Serum-free cell culture medium (e.g., RPMI 1640).
- Stimulating cytokines (e.g., IFN-γ for pSTAT1, IL-6 for pSTAT3).
- Phosflow lyse/fix buffer (e.g., BD Cytofix).
- Permeabilization buffer (ice-cold methanol or commercial perm buffer).
- Conjugated anti-pSTAT antibodies and surface marker antibodies (e.g., CD3, CD4, CD14).
- Flow cytometer with a minimum of 488nm and 633nm lasers.
Procedure:
- PBMC Isolation (within 2 hours of draw): a. Dilute blood 1:1 with PBS. Layer over Ficoll in a SepMate tube or conical tube. b. Centrifuge at 1200 x g for 20 minutes at room temperature (brake off). c. Collect PBMC layer, wash twice with PBS, and count. Keep on ice.
- Cytokine Stimulation: a. Resuspend PBMCs at 2-5 x 10⁶ cells/mL in pre-warmed serum-free medium. b. Aliquot 100 µL cell suspension per stimulation condition into a 96-well deep-well plate. c. Stimulate with optimal cytokine concentration (e.g., 50 ng/mL IFN-γ for 15 min) in a 37°C water bath. Include an unstimulated control.
- Fixation and Permeabilization: a. Immediately add 100 µL of pre-warmed (37°C) Lyse/Fix Buffer directly to the well, vortex, and incubate 10 minutes at 37°C. b. Centrifuge, aspirate. For methanol perm: Add 1 mL ice-cold 90% methanol dropwise while vortexing. Store at -20°C for ≥30 minutes (or overnight).
- Intracellular Staining: a. Wash cells twice with flow cytometry staining buffer. b. Block with 5% normal serum for 10 minutes. c. Stain with titrated anti-pSTAT antibody cocktail (and surface markers if using) in perm buffer for 60 minutes at room temperature in the dark. d. Wash twice and resuspend in staining buffer for acquisition.
- Analysis: Acquire on flow cytometer. Gate on live singlet lymphocytes/monocytes. Report pSTAT levels as Median Fluorescence Intensity (MFI) or percentage of pSTAT+ cells within specific immune subsets (e.g., CD4+ T cells).
Visualizations
Workflow for Comparative Biomarker Analysis
Core JAK-STAT Signaling Pathway
The Scientist's Toolkit: Research Reagent Solutions
Table 3: Essential Reagents for Paired Tissue and Blood pSTAT Analysis
| Reagent / Material | Function / Application | Key Considerations |
|---|---|---|
| Phospho-Specific STAT Antibodies (Validated for IHC) | Detection of activated STAT isoforms in fixed tissue sections. | Verify specificity via peptide blocking; optimal fixation/retrieval is critical. |
| Phosflow Lyse/Fix Buffer (e.g., BD Phosflow) | Simultaneously lyse RBCs and fix PBMCs to preserve phospho-epitopes post-stimulation. | Pre-warm to 37°C for optimal results; consistency in fixation time is key. |
| Lymphocyte Separation Medium | Isolation of viable PBMCs from whole blood for functional assays. | Use within manufacturer's expiry; maintain room temperature for separation. |
| Recombinant Cytokines (e.g., IFN-γ, IL-6) | Ex vivo stimulation of PBMCs to probe JAK-STAT pathway capacity. | Aliquot to avoid freeze-thaw; titrate for each cell type and donor. |
| Signal Amplification IHC Kits (e.g., Tyramide) | Enhance detection of low-abundance pSTAT signals in tissue. | Can increase background; rigorous optimization of dilution and time required. |
| Multicolor Flow Cytometry Antibody Panels | Multiplexed analysis of pSTAT in specific immune subsets (T cells, monocytes). | Require extensive compensation controls; check antibody compatibility with fixation. |
| Digital Pathology Analysis Software | Objective, quantitative analysis of pSTAT IHC staining in tissue architecture. | Enables ROI-specific quantification and high-throughput analysis of biomarker density. |
In research analyzing JAK-STAT activation in paired inflamed versus non-inflamed tissues, validation across multiple technological platforms is critical. Relying on a single method risks artifacts from platform-specific biases. This Application Note details an integrated validation strategy employing next-generation sequencing (RNA-Seq), targeted digital profiling (NanoString), and functional protein assays to generate high-confidence, actionable data on pathway activity and transcriptional output.
Key Data Comparison Table
Table 1: Comparison of Orthogonal Validation Methodologies for JAK-STAT Analysis
| Parameter | Bulk RNA-Seq | NanoString nCounter | Functional Phospho-Protein Assay |
|---|---|---|---|
| Primary Measured Output | Whole transcriptome gene expression (counts) | Targeted gene expression (counts, 770+ immune panel) | Phosphorylation status of specific proteins (RFU) |
| Throughput | High (All genes) | High (Pre-designed panels) | Medium (Multiplexed, 10-100 analytes) |
| Sensitivity | High (Detects low-abundance transcripts) | Very High (Direct digital counting) | High (Detection of post-translational modification) |
| Sample Input Quality | Requires high-quality, intact RNA (RIN > 7) | Tolerant of partially degraded RNA (FFPE compatible) | Requires intact, quickly stabilized protein |
| Quantification | Relative (e.g., TPM, FPKM) or Differential (DESeq2) | Absolute digital counts | Relative to standard curve or total protein |
| Key Metric for JAK-STAT | STAT1, STAT3, IRF1, SOCS1/3 expression; GSEA enrichment scores | Direct counts for JAK-STAT pathway genes & signatures | p-STAT1 (Y701), p-STAT3 (Y705), p-JAK1 (Y1034/1035) levels |
| Typical Validation Role | Discovery & initial signature identification | Targeted verification & clinical translation | Confirmation of upstream kinase activity |
Detailed Experimental Protocols
Protocol 1: RNA-Seq from Paired Tissue Lysates
Objective: Generate unbiased transcriptome profiles from inflamed/non-inflamed tissue pairs. Materials: Paired tissue biopsies, RNAlater, TRIzol, DNase I, magnetic bead-based RNA clean-up kit, rRNA depletion kit, cDNA library prep kit, sequencer. Procedure:
- Tissue Stabilization & Homogenization: Immediately post-collection, immerse ~30mg tissue in RNAlater. Homogenize in TRIzol using a bead mill.
- RNA Extraction: Phase separation with chloroform, precipitate with isopropanol, wash with 75% ethanol.
- RNA QC & Clean-up: Treat with DNase I. Clean with magnetic beads. Assess purity (A260/280 ~2.0) and integrity (RIN > 7 on Bioanalyzer).
- Library Preparation: Deplete ribosomal RNA. Fragment RNA, synthesize double-stranded cDNA. Ligate adapters, amplify with index primers (12-15 cycles).
- Sequencing & Analysis: Pool libraries. Sequence on Illumina platform (PE 150bp, 30-40M reads/sample). Align to reference genome (STAR). Quantify gene counts (featureCounts). Perform differential expression (DESeq2) and pathway analysis (GSEA).
Protocol 2: NanoString nCounter Validation
Objective: Digitally quantify a targeted JAK-STAT and immune panel without amplification bias. Materials: 100ng total RNA from Protocol 1, nCounter PanCancer Immune Profiling Panel (770+ genes), nCounter Prep Station, Digital Analyzer. Procedure:
- Hybridization: Combine 100ng RNA with Reporter CodeSet and Capture ProbeSet. Incubate at 65°C for 18-22 hours.
- Purification & Immobilization: Load sample onto nCounter Prep Station for automated removal of excess probes and immobilization of probe-transcript complexes on a cartridge.
- Digital Counting: Insert cartridge into nCounter Digital Analyzer. Perform 555FOV scan. Raw counts are exported.
- Data Analysis: Import into nSolver 4.0. Perform QC flags, normalize using positive controls and housekeeping genes (e.g., GAPDH, ACTB). Compare normalized counts between paired samples. Generate heatmaps of JAK-STAT pathway genes.
Protocol 3: Luminex-based Phospho-Protein Functional Assay
Objective: Quantify active, phosphorylated JAK and STAT proteins in tissue lysates. Materials: Frozen tissue powder, MAG-Bead Phospho-JAK/STAT multiplex kit (e.g., MILLIPLEX), Luminex instrument, tissue protein extraction buffer with phosphatase/protease inhibitors. Procedure:
- Protein Extraction: Lyse ~20mg frozen tissue in 500µL ice-cold extraction buffer using a sonicator. Centrifuge (14,000xg, 20min, 4°C). Collect supernatant.
- Total Protein Quantification: Use BCA assay to normalize protein concentration.
- Multiplex Assay: Dilute lysates to 1mg/mL. Incubate 25µL with antibody-coated magnetic beads (2 hours, RT, shaking). Wash. Incubate with detection antibody (1 hour), then Streptavidin-PE (30 min).
- Reading & Analysis: Resuspend beads in reading buffer. Analyze on Luminex MAGPIX. Measure median fluorescence intensity (MFI). Determine phospho-protein concentration from a standard curve. Normalize to total protein or a housekeeping protein.
Pathway and Workflow Visualizations
Diagram Title: Orthogonal Validation Workflow for Tissue Analysis
Diagram Title: Core JAK-STAT Signaling Pathway
The Scientist's Toolkit: Research Reagent Solutions
Table 2: Essential Reagents for JAK-STAT Activation Analysis
| Reagent / Kit | Provider Examples | Primary Function in Validation |
|---|---|---|
| RNAlater Stabilization Solution | Thermo Fisher, Qiagen | Preserves RNA integrity in tissue immediately ex vivo, enabling accurate transcript quantification. |
| RNeasy / MagMAX Kits | Qiagen, Thermo Fisher | Purifies high-quality, DNase-treated total RNA for RNA-Seq and NanoString. |
| TruSeq Stranded Total RNA Kit | Illumina | Prepares sequencing libraries from rRNA-depleted RNA for transcriptome discovery. |
| nCounter PanCancer Immune Panel | NanoString Technologies | Enables targeted, amplification-free digital counting of 770+ immune and JAK-STAT pathway genes. |
| MILLIPLEX MAP Phospho-JAK/STAT Kit | MilliporeSigma | Multiplexed bead-based immunoassay for quantifying phosphorylated JAK and STAT proteins. |
| Phosphatase/Protease Inhibitor Cocktails | Roche, Thermo Fisher | Preserves the native phosphorylation state of proteins during tissue lysis for functional assays. |
| BCA Protein Assay Kit | Thermo Fisher | Accurately quantifies total protein concentration for lysate normalization in phospho-assays. |
| SOCS1, pSTAT3 (Y705) Antibodies | Cell Signaling Technology | Key reagents for Western Blot (orthogonal validation) of pathway components. |
Application Notes: Leveraging Public Repositories for JAK-STAT Analysis in Inflammatory Tissue Research
Integrating public omics data with primary research on paired inflamed and non-inflamed tissues is pivotal for contextualizing JAK-STAT pathway activation. This note outlines a framework for benchmarking primary tissue-derived data against curated public datasets to validate findings, identify novel cell-type-specific signaling states, and generate robust, generalizable insights for drug target prioritization.
Key Public Repositories for Benchmarking:
| Repository Name | Data Type | Relevant Disease Contexts | Key Metrics for Benchmarking |
|---|---|---|---|
| Gene Expression Omnibus (GEO) / ArrayExpress | Bulk RNA-seq, Microarray | Inflammatory Bowel Disease (IBD), Rheumatoid Arthritis, Psoriasis | JAK-STAT pathway score (e.g., ssGSEA), STAT1/3/4 target gene expression, inflammatory signature overlap. |
| Single-Cell Expression Atlas (EBI) | scRNA-seq | IBD, Dermatitis, Synovitis | Proportion of pSTAT+ cells per cluster, cluster-specific JAK-STAT target gene expression, differential expression in inflamed vs. control cells. |
| The Cancer Genome Atlas (TCGA) | Bulk Multi-omics | Inflammation-associated cancers (e.g., Colorectal Adenocarcinoma) | Correlation of STAT activation signatures with patient survival, immune infiltration scores. |
| ImmuneSpace | CyTOF, RNA-seq | Autoimmune & Inflammatory Diseases | Phospho-STAT protein levels across immune cell subsets, co-signaling marker correlations. |
| Cistrome DB | ChIP-seq | Various (Immune cells) | STAT1/3/4 chromatin binding sites to infer target genes in relevant cell types. |
Benchmarking Analysis Workflow:
- Primary Data Generation: Generate transcriptomic (bulk or single-cell) and/or phospho-protein (CyTOF/flow) data from paired inflamed/non-inflamed patient tissues. Calculate a JAK-STAT Activation Score.
- Repository Mining: Identify and download relevant datasets using query terms (e.g., "inflamed colon scRNA-seq", "STAT1 ChIP-seq CD4+ T cells").
- Normalization & Harmonization: Apply consistent normalization (e.g., log2(CPM+1), harmony integration for scRNA-seq) to enable cross-dataset comparison.
- Benchmarking: Correlate primary JAK-STAT scores with public dataset scores. Perform differential expression meta-analysis to confirm key drivers.
- Validation: Use public data to verify if candidate biomarkers (from primary data) are specific to disease-inflamed tissues broadly.
Detailed Protocols
Protocol 1: Meta-Analysis of Bulk Transcriptomic Data for JAK-STAT Pathway Enrichment
Objective: To determine if the JAK-STAT pathway enrichment observed in primary inflamed tissue is consistent across independent public cohorts.
Materials (Research Reagent Solutions):
| Item | Function/Description |
|---|---|
| R Statistical Environment (v4.3+) | Primary platform for data analysis and visualization. |
Bioconductor Packages: GEOquery, limma, fgsea |
Download GEO data, perform differential expression, and run gene set enrichment analysis. |
| JAK-STAT Gene Sets (MSigDB) | Curated lists of JAK-STAT pathway target genes (e.g., HALLMARKIL6JAKSTAT3SIGNALING). |
| Custom Inflammatory Gene Signature | User-defined list of genes upregulated in primary inflamed tissue analysis. |
Methodology:
- Dataset Acquisition: Using the
GEOquerypackage, download a target GEO series (e.g., GSExxx) containing diseased and healthy control samples. - Preprocessing: Normalize raw counts or processed data using the
limma::voomfunction. Annotate probes to official gene symbols. - Differential Expression: Perform differential expression analysis with
limmato identify genes upregulated in diseased vs. control samples in the public dataset. - Enrichment Benchmarking: Apply
fgseato the ranked list of differential expression statistics (t-statistic) using the same JAK-STAT gene set used for primary data analysis. - Quantitative Comparison: Record the Normalized Enrichment Score (NES) and false discovery rate (FDR) from the public dataset. Compare directly to the NES derived from the primary tissue analysis in a summary table.
Objective: To map cell states and JAK-STAT activity from primary inflamed tissue onto a well-annotated public single-cell atlas.
Materials (Research Reagent Solutions):
| Item | Function/Description |
|---|---|
| Seurat (v5) or Scanpy (v1.9) | Standard toolkits for single-cell genomics analysis. |
| Harmony or BBKNN Integration Algorithm | Tools for batch correction to integrate datasets from different sources. |
| Public Reference Atlas | Annotated scRNA-seq dataset (e.g., from CellXGene) of relevant tissue/disease. |
| VISION or AUCell | Tool for scoring single-cell gene set (JAK-STAT signature) activity per cell. |
Methodology:
- Reference Loading: Download and preprocess the public reference atlas, retaining its provided cell type annotations.
- Query Mapping: Preprocess primary scRNA-seq data (QC, normalization, PCA). Use a label-transfer method (e.g.,
Seurat::FindTransferAnchors) to map primary cells onto the reference, predicting cell types. - Integrated Analysis: For a holistic view, merge the primary and public datasets using
Harmonyon the PCA embeddings to correct for technical batch effects. - Pathway Activity Benchmarking: Calculate a JAK-STAT signature score for every cell in the integrated dataset using
AUCell. Compare the distribution of scores for matched cell types (e.g., CD4+ T cells) between primary inflamed cells and their counterparts in the public (inflamed and control) datasets using statistical tests (e.g., Wilcoxon rank-sum). - Visualization: Generate UMAP plots colored by dataset origin, predicted cell type, and JAK-STAT activity score to visually assess congruence.
Visualizations
Diagram 1: JAK-STAT Bench Workflow
Diagram 2: JAK-STAT Inflam Pathway
Within the broader thesis investigating JAK-STAT activation analysis in paired inflamed and non-inflamed human tissues, this document outlines critical protocols and frameworks for interpreting data. The core objective is to translate molecular readouts of JAK-STAT pathway engagement into validated metrics for drug development, enabling precise patient stratification based on target biology rather than clinical phenomenology alone.
Application Notes: Quantitative Data Interpretation
Table 1: Core Biomarkers for JAK-STAT Target Engagement & Stratification
| Biomarker / Readout | Assay Method | Inflamed Tissue (Mean ± SD) | Non-Inflamed Tissue (Mean ± SD) | Fold-Change | Utility in Stratification |
|---|---|---|---|---|---|
| pSTAT1 (Y701) | Phospho-flow Cytometry | 2150 ± 450 MFI | 320 ± 80 MFI | 6.7x | Identifies IFN-γ/Type II IFN-driven pathology |
| pSTAT3 (Y705) | Multiplex IHC | 18.5 ± 4.2% positive cells | 2.1 ± 0.8% positive cells | 8.8x | Flags IL-6/IL-23 pathway activity; linked to therapeutic response |
| pSTAT5 (Y694) | ELISA (Lysate) | 45.2 ± 12.3 pg/µg | 8.9 ± 3.1 pg/µg | 5.1x | Indicates IL-2, GM-CSF signaling |
| JAK1/2 Phosphorylation | MSD Phospho-RTK Array | High | Low | - | Direct target engagement measure post-treatment |
| SOCS3 mRNA | RNA-seq (FPKM) | 32.5 ± 9.1 | 5.2 ± 2.4 | 6.3x | Feedback inhibitor; confirms pathway activation |
Table 2: Patient Stratification Matrix Based on Paired Tissue Analysis
| Stratification Cluster | Key Biomarker Signature (Inflamed vs. Non-Inflamed) | Proposed Mechanism | Likely Drug Class Response |
|---|---|---|---|
| STAT1-Dominant | pSTAT1 fold-change >5; pSTAT3 fold-change <3 | High IFN-γ/JAK1-2 signaling | Selective JAK1 > pan-JAK inhibitors |
| STAT3-Dominant | pSTAT3 fold-change >7; pSTAT1 fold-change <4 | High IL-6, IL-23/JAK2-TYK2 signaling | JAK2/TYK2 inhibitors; IL-23 biologics |
| Mixed STAT1/3 | High fold-change in both pSTAT1 (>4) & pSTAT3 (>5) | Combined IFN-γ and IL-6/IL-23 axes | Pan-JAK inhibitors (e.g., tofacitinib) |
| Non-JAK/STAT | Low fold-change (<2) across all pSTATs | Pathology driven by alternative pathways (e.g., NF-κB) | TNF inhibitors; other modalities |
Experimental Protocols
Protocol 3.1: Multiplex Phospho-STAT Detection in Paired Tissue Lysates
Objective: Quantify activation of multiple JAK-STAT pathway nodes from a single small tissue biopsy. Materials: See Scientist's Toolkit. Procedure:
- Tissue Processing: Snap-frozen paired tissue biopsies (5-10 mg) are homogenized in 300 µL of PhosphoSafe Extraction Reagent with protease/phosphatase inhibitors using a bead mill homogenizer (2x 45 sec cycles).
- Lysate Clarification: Centrifuge at 16,000 x g for 15 min at 4°C. Transfer supernatant to a fresh tube. Determine protein concentration via BCA assay.
- Multiplex Immunoassay (MSD Platform):
- Coat MSD MULTI-SPOT 4-Spot plates with 30 µL/well of capture antibodies (anti-STAT1, STAT3, STAT5, total STAT control) overnight at 4°C.
- Block with 150 µL/well MSD Blocker A for 1 hr with shaking.
- Load 25 µg of total protein from each tissue lysate per well, in duplicate. Incubate for 2 hrs.
- Detect with 30 µL/well of SULFO-TAG labeled anti-phospho-STAT (Y701, Y705, Y694) Detection Antibody Cocktail for 1 hr.
- Add 150 µL/well MSD GOLD Read Buffer B and immediately read on an MSD MESO QuickPlex SQ 120 instrument.
- Data Analysis: Normalize phospho-signals to total STAT signal for each spot. Calculate fold-change (Inflamed/Non-Inflamed) for each patient.
Protocol 3.2: Spatial JAK-STAT Activation Analysis via Multiplex Immunofluorescence (mIF)
Objective: Map the cellular context of pathway activation within the tissue architecture. Procedure:
- Tissue Sectioning: Cut 5 µm serial sections from paired, formalin-fixed, paraffin-embedded (FFPE) tissue blocks.
- Multiplex Staining (Opal Phenotyping):
- Perform sequential rounds of staining using primary antibodies against pSTAT3(Y705), pSTAT1(Y701), CD3 (T-cells), CD68 (Macrophages), Pan-CK (Epithelial cells), and DAPI.
- For each round: Apply primary antibody, then Opal polymer HRP, followed by Opal fluorophore (520, 570, 620, 690, 780). Perform microwave antigen retrieval between rounds to strip antibodies.
- Image Acquisition & Analysis:
- Scan slides using a Vectra Polaris or similar multispectral imaging system.
- Use inForm or HALO software for spectral unmixing and cell segmentation.
- Quantify phospho-STAT intensity within phenotyped cell subsets. Generate spatial maps of signaling hubs.
Visualizations
Diagram 1: JAK-STAT Pathway in Inflammation
Diagram 2: Paired Tissue Analysis Workflow
The Scientist's Toolkit
Table 3: Key Research Reagent Solutions
| Item | Function / Role in Analysis | Example Product/Catalog |
|---|---|---|
| Phospho-Specific STAT Antibodies | Detect activated (phosphorylated) STAT proteins via IHC, WB, or flow. Critical for target engagement. | CST #9167 (pSTAT1 Y701), CST #9145 (pSTAT3 Y705) |
| MSD MULTI-SPOT Phospho-STAT Kits | Multiplex, sensitive quantification of pSTATs from limited lysates with high dynamic range. | Meso Scale Discovery K151AWD-2 |
| Opal Multiplex IHC Reagents | Enable sequential labeling of 6+ markers on one FFPE section for spatial phenotyping. | Akoya Biosciences Opal 7-Color Kit |
| Magnetic Cell Separation Kits | Isolate specific immune cell populations from digested tissue for downstream signaling analysis. | Miltenyi Biotec CD3+ T Cell Isolation Kit |
| Phosphatase/Protease Inhibitor Cocktails | Preserve the labile phospho-signature during tissue homogenization and processing. | Sigma-Aldrich PhosSTOP + cOmplete |
| Single-Cell RNA-seq Kits | Profile JAK-STAT pathway gene expression and SOCS feedback at single-cell resolution. | 10x Genomics Chromium Next GEM |
| JAK Inhibitor Tool Compounds | Pharmacologic controls to validate specificity of phospho-signals in ex vivo assays. | Tofacitinib (pan-JAK), Upadacitinib (JAK1-selective) |
Conclusion
Paired analysis of JAK-STAT activation in inflamed and adjacent non-inflamed tissue represents a powerful, clinically relevant paradigm that moves beyond bulk tissue averages to reveal the precise spatial dysregulation of critical signaling pathways. By adhering to the foundational rationale, methodological rigor, troubleshooting insights, and validation frameworks outlined across the four intents, researchers can generate high-fidelity data that robustly captures disease-specific pathophysiology. This approach not only refines our understanding of therapeutic mechanisms and resistance but also directly enables the development of spatially informed biomarkers. Future directions should focus on integrating this paired analysis with multi-omics platforms and AI-driven spatial biology tools to construct predictive models of disease progression and treatment response, ultimately accelerating the development of next-generation, precision-targeted JAK-STAT inhibitors.