PAMP vs DAMP: Decoding Pathogen and Damage-Associated DNA Recognition in Innate Immunity
This comprehensive review synthesizes current research on how bacterial DNA (PAMP) and host cell-derived DNA (DAMP) activate the innate immune system through overlapping yet distinct signaling pathways.
PAMP vs DAMP: Decoding Pathogen and Damage-Associated DNA Recognition in Innate Immunity
Abstract
This comprehensive review synthesizes current research on how bacterial DNA (PAMP) and host cell-derived DNA (DAMP) activate the innate immune system through overlapping yet distinct signaling pathways. Tailored for researchers and drug development professionals, the article examines foundational receptor biology (cGAS-STING, TLR9, AIM2), methodologies for experimental dissection, common experimental pitfalls, and comparative analyses of therapeutic strategies. We explore the implications of this dichotomy for understanding infectious disease, autoimmunity, cancer, and developing novel immunomodulatory drugs that can selectively target detrimental inflammation while preserving host defense.
DNA as a Signal: Molecular Foundations of PAMP and DAMP Recognition
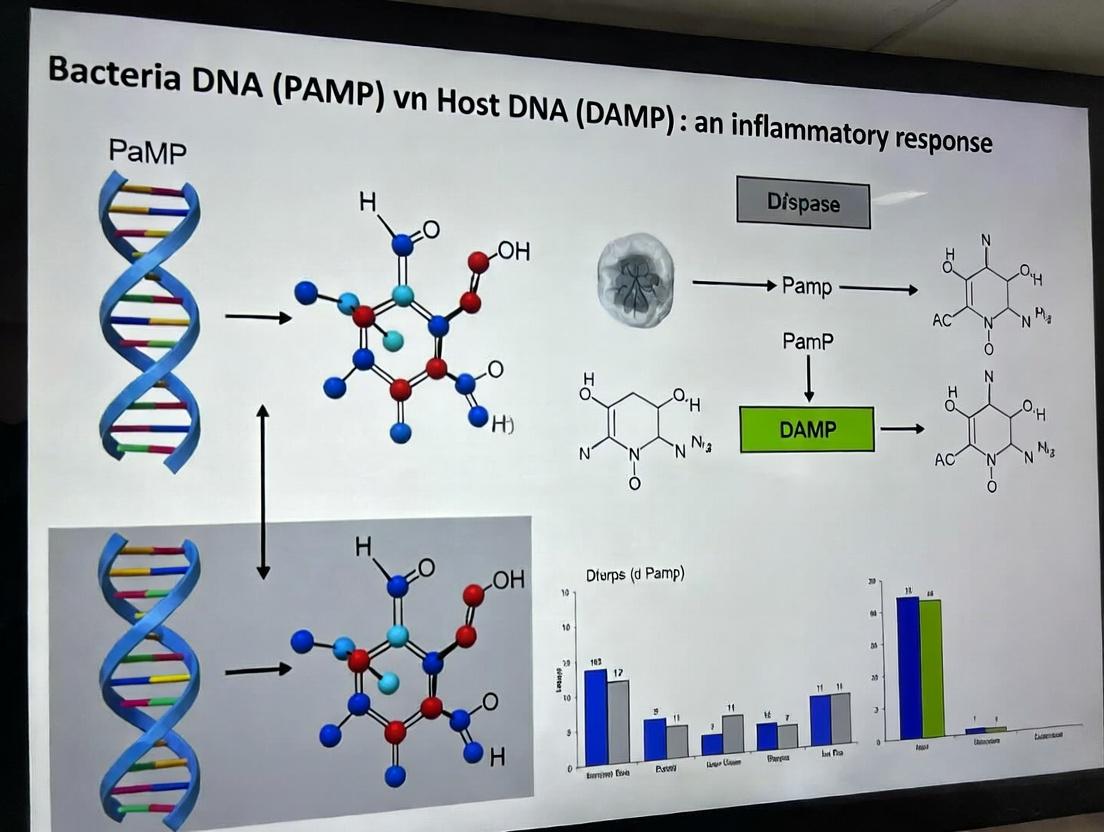
Within the broader thesis on innate immune recognition, distinguishing between pathogen-associated molecular patterns (PAMPs) and damage-associated molecular patterns (DAMPs) is fundamental. This guide objectively compares the inflammatory responses triggered by bacterial DNA (a canonical PAMP) and host DNA (an emerging DAMP), summarizing key experimental data and methodologies.
Core Ligands, Receptors, and Signaling Pathways
Table 1: Comparative Profile of Bacterial DNA and Host DNA as Immune Stimuli
| Feature | Bacterial DNA (PAMP) | Host DNA (DAMP) |
|---|---|---|
| Primary Recognition Receptor | Toll-like Receptor 9 (TLR9) | Cyclic GMP-AMP Synthase (cGAS) |
| Key Discriminatory Feature | High frequency of unmetlylated CpG motifs | Aberrant localization in cytosol/nucleus |
| Localization for Sensing | Endolysosome | Cytosol |
| Adaptor Protein | MyD88 | STING |
| Primary Transcription Factor | NF-κB, IRF7 | IRF3, NF-κB |
| Cytokine Output Profile | High IL-6, TNF-α; Type I IFN (plasmacytoid DCs) | Robust Type I IFNs (IFN-α/β), ISGs, lower IL-6 |
| In Vivo Role | Anti-microbial host defense | Autoimmunity (e.g., SLE), anti-tumor immunity, sterile inflammation |
Table 2: Representative Experimental Data from Key Studies
| Experiment Readout | Bacterial DNA (CpG ODN) Stimulation | Host DNA (dsDNA from damaged cells) Stimulation | Experimental Model |
|---|---|---|---|
| IFN-β Induction (pg/mL) | 150-300 (in pDCs) | 800-1200 (in macrophages) | Primary murine bone marrow-derived cells |
| NF-κB Activation (Fold Change) | 12-15 fold | 5-8 fold | HEK293T reporter cell line |
| IL-6 Secretion (ng/mL) | 8-12 ng/mL | 1-3 ng/mL | Human peripheral blood mononuclear cells (PBMCs) |
| Signal Kinetics (Peak Time) | Early (NF-κB: 1-2h; IFN: 6-8h) | Delayed (STING/IRF3: 4-6h; IFN: 8-12h) | Immortalized macrophage cell line |
| Inhibition by Chloroquine | >90% reduction | <10% reduction | In vitro stimulation assay |
Detailed Experimental Protocols
Protocol 1: Assessing TLR9-Dependent Responses to Bacterial CpG DNA
Objective: To quantify NF-κB activation and cytokine production via the TLR9-MyD88 pathway.
- Cell Preparation: Seed human PBMCs or murine RAW 264.7 macrophages in 96-well plates.
- Stimulation: Treat cells with synthetic CpG ODN 2006 (1-10 µM) or purified genomic DNA from E. coli (1 µg/mL). Use non-CpG ODN as negative control.
- Inhibition Control: Pre-treat cells with chloroquine (20 µM, 1 hour) to inhibit endosomal acidification/TLR9 signaling.
- Readouts:
- NF-κB Luciferase Assay: Harvest cells 6h post-stimulation for luciferase activity measurement.
- Cytokine ELISA: Collect supernatant at 18-24h for IL-6 and TNF-α quantification.
- qPCR: Isolve RNA at 4-6h to measure Ifnb1 and Il6 mRNA levels.
Protocol 2: Measuring cGAS-STING Activation by Host Cytosolic DNA
Objective: To evaluate the STING-dependent Type I IFN response to self-DNA.
- Cell Preparation: Seed cGAS-competent cells (e.g., L929, THP-1) in 24-well plates.
- DNA Transfection: Transfect cells with sheared mammalian genomic DNA (1 µg/mL) or herring testes DNA using lipofectamine 2000 or jetPEI. This mimics cytosolic delivery. Use dsDNA (e.g., ISD) as a positive control.
- Genetic Inhibition: Use siRNA knockdown of Cgas or Sting in experimental groups.
- Readouts:
- Phospho-IRF3/STING Immunoblot: Lyse cells at 4-6h for western blot analysis.
- IFN-β Bioassay/ELISA: Collect supernatant at 12-18h for IFN-β quantification.
- Immunofluorescence: Fix cells at 4h to visualize STING trafficking from ER to perinuclear vesicles.
Signaling Pathway Diagrams
Title: TLR9-MyD88 Pathway for Bacterial DNA
Title: cGAS-STING Pathway for Host DNA
The Scientist's Toolkit: Research Reagent Solutions
Table 3: Essential Reagents for DNA Sensing Research
| Reagent/Material | Function & Application | Example Product/Catalog |
|---|---|---|
| Synthetic CpG ODN (Class B) | TLR9 agonist; positive control for bacterial DNA PAMP response. | ODN 2006 (InvivoGen, tlrl-2006) |
| 2'3'-cGAMP | Direct STING agonist; positive control for the cGAS-STING pathway. | 2'3'-cGAMPS (InvivoGen, tlrl-nacga23) |
| Interferon Stimulatory DNA (ISD) | 45-mer dsDNA; classic ligand for cGAS activation in transfection assays. | Custom synthesis or commercial ISD. |
| Chloroquine Diphosphate | Endosomal acidification inhibitor; blocks TLR9 signaling (distinguish pathways). | (Sigma-Aldrich, C6628) |
| Anti-phospho-STING (Ser366) Ab | Detects activated STING by immunoblot or immunofluorescence. | (Cell Signaling Tech, 50907S) |
| Human/Mouse IFN-β ELISA Kit | Quantifies Type I IFN output from cGAS-STING activation. | PBL Assay Science kits |
| STING Knockout Cell Line | Isogenic control to confirm STING-dependence of host DNA response. | e.g., THP-1 STING KO (InvivoGen) |
| Lipofectamine 3000 | Transfection reagent for delivering dsDNA into cytosol to mimic DAMP release. | (Thermo Fisher, L3000015) |
| DNase I, RNase-free | Control enzyme to confirm DNA-dependent effects; degrades stimulatory DNA. | (Roche, 04716728001) |
Within the research framework of distinguishing inflammatory responses to Bacterial DNA PAMPs (Pathogen-Associated Molecular Patterns) from host DNA DAMPs (Damage-Associated Molecular Patterns), understanding the key DNA sensors is paramount. This guide provides a comparative analysis of three principal sentinels: cytosolic cGAS, cytosolic AIM2, and endosomal TLR9. Their distinct mechanisms, ligand specificity, and downstream signaling cascades critically define the nature and outcome of the immune response, guiding therapeutic strategies in autoimmunity, infectious disease, and cancer.
Comparative Performance Analysis
Table 1: Core Sensor Characteristics and Signaling Outputs
| Feature | cGAS (Human/Mouse) | AIM2 (Human/Mouse) | TLR9 (Human/Mouse) |
|---|---|---|---|
| Cellular Location | Cytosol (also nucleus, mitochondria) | Cytosol | Endolysosome |
| Primary Ligand | dsDNA (>45 bp, sequence-independent) | dsDNA (80-1000 bp, AT-rich preference) | Unmethylated CpG DNA (specific motifs) |
| Ligand Source | PAMP: Viral/Bacterial DNA; DAMP: Self-DNA (mtDNA, micronuclei) | PAMP: Mainly bacterial/vaccinia DNA; DAMP: Self-DNA (e.g., from genomic instability) | PAMP: Bacterial, Plasmodium DNA; DAMP: Potentially self-DNA in lupus |
| Adaptor Protein | STING (on ER) | ASC (Apoptosis-associated speck-like protein) | MyD88 |
| Primary Signaling Output | Type I Interferons (IFN-α/β) & Pro-inflammatory Cytokines | Inflammasome Formation: Caspase-1 activation, IL-1β/IL-18 maturation, Pyroptosis | Pro-inflammatory Cytokines (TNF-α, IL-6) & Type I IFNs (in pDCs) |
| Key Effector Molecules | IRF3, NF-κB | Caspase-1, Gasdermin D | NF-κB, IRF7 (in pDCs) |
| In Vivo Knockout Phenotype (Bacterial Challenge) | Increased susceptibility to DNA viruses, L. monocytogenes, M. tuberculosis | Resistant to F. novicida; susceptible to S. pneumoniae | Increased susceptibility to M. tuberculosis, Plasmodium spp. |
Table 2: Quantitative Experimental Data from Representative Studies
| Experiment Context | cGAS-STING | AIM2 Inflammasome | TLR9 | Notes (Cell Line/Model) |
|---|---|---|---|---|
| IFN-β Induction (pg/mL) | ~1200-1500 | Not Induced | ~200-400 | HEK293T cells transfected with 1 μg dsDNA (45mer ISD) or CpG-B (ODN 2006). |
| IL-1β Secretion (pg/mL) | Low (<50) | ~800-1000 | Low (<50) | THP-1 macrophages primed with LPS, then transfected with 2 μg poly(dA:dT). |
| EC50 for Ligand (nM) | ~30-50 nM (for dsDNA) | ~15-20 nM (for poly(dA:dT)) | ~50-100 nM (for CpG-A) | Varies by cell type and ligand preparation. |
| Response Time to Peak (hrs) | 6-8 (IFN-β mRNA) | 4-6 (Caspase-1 cleavage) | 2-4 (TNF-α mRNA) | Primary Bone Marrow-Derived Macrophages (BMDMs). |
Experimental Protocols
Protocol: Measuring cGAS-STING Activation by IFNB1 Promoter Luciferase Assay
Purpose: Quantify cGAS-dependent IFN response to cytosolic DNA. Methodology:
- Cell Seeding: Seed HEK293T cells (deficient in endogenous cGAS) in 24-well plates.
- Transfection: Co-transfect with:
- cGAS expression plasmid (or empty vector control).
- STING expression plasmid.
- Reporter plasmid: Firefly luciferase under control of the IFNB1 promoter.
- Renilla luciferase plasmid (e.g., pRL-TK) for normalization.
- Stimulus: 1 μg of 45-bp interferon stimulatory DNA (ISD) or herring testes DNA using a transfection reagent (e.g., Lipofectamine 2000). For a DAMP control, use purified mitochondrial DNA.
- Incubation: Incubate for 20-24 hours.
- Lysis & Measurement: Lyse cells and measure Firefly and Renilla luciferase activity using a dual-luciferase assay kit. Calculate the ratio of Firefly/Renilla luminescence.
- Inhibition: To confirm specificity, repeat with a cGAS inhibitor (e.g., RU.521).
Protocol: Assessing AIM2 Inflammasome Activation by Immunoblot
Purpose: Detect inflammasome assembly and Caspase-1 activation. Methodology:
- Cell Preparation & Priming: Differentiate THP-1 cells into macrophages with PMA. Prime cells with 100 ng/mL ultrapure LPS for 3-4 hours to induce pro-IL-1β expression.
- Transfection: Transfert primed cells with 2 μg of the dsDNA ligand poly(dA:dT) using a cytosolic transfection reagent (e.g., Lipofectamine 2000 with PLUS Reagent). Positive Control: Nigericin (5 μM). Negative Control: Mock transfection.
- Supernatant Collection: Collect cell culture supernatants 6 hours post-transfection. Concentrate proteins via TCA precipitation.
- Cell Lysis: Lyse remaining cells in RIPA buffer.
- Immunoblotting: Perform SDS-PAGE and western blotting.
- Probe supernatants for mature IL-1β (p17) and cleaved Gasdermin D.
- Probe cell lysates for pro-IL-1β, pro-Caspase-1, cleaved Caspase-1 (p20), and ASC. AIM2 inflammasome activation is confirmed by the presence of cleaved products in the supernatant and ASC oligomerization (detectable as high molecular weight aggregates in lysates).
Protocol: Evaluating TLR9 Activation via Cytokine ELISA
Purpose: Measure TLR9-specific cytokine production in response to CpG DNA. Methodology:
- Cell Culture: Use murine bone marrow-derived plasmacytoid dendritic cells (pDCs) or human peripheral blood mononuclear cell (PBMC)-derived pDCs, as they robustly express TLR9.
- Stimulation: Treat cells with specific TLR9 ligands: CpG-A (ODN 2216, for strong IFN-α induction in pDCs), CpG-B (ODN 2006, for strong B-cell/pro-inflammatory cytokine activation), or CpG-C (hybrid). Use 1-5 μM concentration. Incubate for 18-24 hours.
- Specificity Control: Pre-treat cells with a TLR9 inhibitory oligonucleotide (e.g., IRS 954) or use TLR9-KO cells.
- Measurement: Collect cell-free supernatants. Use specific ELISA kits to quantify IFN-α (for pDCs with CpG-A) and/or IL-6/TNF-α (for CpG-B in BMDMs or monocytes).
Pathway Diagrams
Diagram Title: cGAS-STING Signaling Pathway to Type I IFNs
Diagram Title: AIM2 Inflammasome Assembly and Pyroptosis
Diagram Title: TLR9 Endosomal Signaling Pathways
The Scientist's Toolkit: Key Research Reagent Solutions
Table 3: Essential Reagents for DNA Sensor Research
| Reagent / Material | Function in Research | Example Product/Catalog # (Representative) |
|---|---|---|
| Synthetic DNA Ligands | Defined agonists for specific sensor activation. | cGAS: 45-mer ISD; AIM2: poly(dA:dT) (e.g., InvivoGen tlrl-patn); TLR9: CpG ODN Class A/B/C (e.g., InvivoGen ODN 2216, 2006). |
| cGAS Inhibitors | Pharmacologically inhibit cGAS to prove pathway specificity. | RU.521 (MCE HY-114258), G140 (MCE HY-139923). |
| STING Agonists/Antagonists | Modulate STING pathway directly, bypassing cGAS. | Agonist: 2'3'-cGAMP (InvivoGen tlrl-nacga23); Antagonist: H-151 (MCE HY-112693). |
| Caspase-1 Inhibitor | Confirms inflammasome-dependent pyroptosis and cytokine maturation. | VX-765 (Belnacasan) or Z-YVAD-FMK (MCE HY-16658). |
| TLR9 Inhibitor | Confirms TLR9-dependent responses. | Chloroquine diphosphate or inhibitory ODN (IRS 954, InvivoGen tlrl-irdn954). |
| Anti-ASC Antibody | Detects ASC speck formation (inflammasome assembly) via microscopy or western blot. | Santa Cruz Biotechnology sc-514414. |
| Phospho-specific Antibodies | Assess activation states of key signaling molecules. | p-TBK1 (Ser172), p-IRF3 (Ser396), p-STING (Ser366) (Cell Signaling Technology). |
| ELISA Kits | Quantify cytokine outputs from activated pathways. | Mouse/Rat/Human: IFN-β, IL-1β, IL-18, IFN-α, TNF-α (e.g., R&D Systems, Thermo Fisher). |
| Luciferase Reporter Assays | Quantify promoter activity (e.g., IFNB1, NF-κB) in pathway screens. | Dual-Luciferase Reporter Assay System (Promega E1910). |
| Gasdermin D Antibody | Detects cleaved, active GSDMD-NT fragment, marker for pyroptosis. | Abcam ab215203. |
Publish Comparison Guide: cGAS-STING Agonists vs. Alternatives for Cytosolic DNA Detection and Response
Within the broader research thesis examining the distinct inflammatory outcomes triggered by bacterial DNA PAMPs versus host-derived DNA DAMPs, the cGAS-STING pathway is the primary cytosolic sensor. This guide compares its performance and experimental modulation against alternative DNA sensing pathways.
Comparison of Cytosolic DNA Sensor Pathways
Table 1: Key Characteristics of Major Cytosolic DNA Sensors
| Feature | cGAS-STING | AIM2 Inflammasome | IFI16 (PYHIN family) |
|---|---|---|---|
| Primary Sensor | Cyclic GMP-AMP Synthase (cGAS) | Absent in Melanoma 2 (AIM2) | Interferon Gamma Inducible Protein 16 (IFI16) |
| DNA Recognition | Structure-independent, length-dependent | dsDNA (>80 bp) via HIN domain | dsDNA via HIN domains |
| Key Adaptor | STING (ER protein) | ASC (Apoptosis-associated speck-like protein) | STING (canonical) or ASC (inflammasome) |
| Primary Output | Type I Interferons (IFN-β) & ISGs | Pro-inflammatory cytokines (IL-1β, IL-18) via caspase-1 | Type I IFNs (nuclear DNA) or Inflammasome |
| Response Speed (Peak IFN-β mRNA) | ~4-6 hours post-stimulation | Not Applicable (NF-β) | ~6-8 hours (slower nuclear sensing) |
| Knockout Phenotype (Mouse Infection Models) | High susceptibility to HSV-1, L. monocytogenes | Susceptible to F. novicida, MCMV | Moderate susceptibility to HSV-1, KSHV |
| Role in Autoimmunity (DAMP Sensing) | Critical: Linked to Aicardi-Goutières Syndrome, SLE | Moderate: Contributes to psoriasis, SLE | Significant: Detects nuclear DNA in senescence, autoimmunity |
| Therapeutic Targeting | Agonists (cancer immunotherapy), Antagonists (autoimmunity) | Inhibitors (inflammatory diseases) | Experimental stage |
Supporting Experimental Data:
A 2023 study directly compared IFN-β production in bone-marrow-derived macrophages (BMDMs) from single-sensor knockout mice stimulated with transfected HT-DNA (host DAMP mimic). cGAS-/- BMDMs showed a >90% reduction in IFN-β secretion compared to wild-type. AIM2-/- BMDMs showed no reduction in IFN-β, while IFI16-/- BMDMs showed an approximate ~30% reduction, highlighting cGAS-STING as the dominant IFN-I pathway for cytosolic DNA.
Detailed Experimental Protocol: Measuring cGAS-STING Activation
Title: Quantifying cGAS-STING Pathway Activation via IFN-β ELISA and Phospho-IRF3 Immunoblotting
Objective: To compare the potency of different cytosolic DNA stimuli (e.g., dsDNA from bacteria vs. host mitochondria) in activating the cGAS-STING pathway.
Materials:
- Wild-type and cGAS
-/-or STING-/-immortalized murine macrophages (e.g., RAW 264.7, L929). - Stimuli: Listeria monocytogenes genomic DNA (PAMP), sonicated mouse mitochondrial DNA (DAMP), synthetic dsDNA (e.g., ISD, 45-mer), cGAMP (positive control).
- Transfection reagent (e.g., Lipofectamine 2000 for DNA; Fugene for cGAMP).
- TRIzol reagent (RNA extraction), cDNA synthesis kit.
- qPCR primers for Ifnb1, Cxcl10, Isg15.
- ELISA kit for mouse IFN-β.
- Lysis buffer (RIPA with phosphatase/protease inhibitors), antibodies: anti-phospho-TBK1 (Ser172), anti-phospho-IRF3 (Ser396), anti-β-actin.
Procedure:
- Cell Seeding & Stimulation: Seed cells in 12-well plates (2.5 x 10^5 cells/well). After 24h, transferd stimuli (e.g., 1 µg DNA using 2 µL Lipofectamine 2000 per well) or treat with extracellular cGAMP (2 µg/mL). Include mock-transfected and Lipofectamine-only controls.
- RNA Harvest & qPCR (4-6h post-stimulation): Lyse cells in TRIzol, extract RNA, synthesize cDNA. Perform qPCR using Ifnb1 primers. Normalize cycle threshold (Ct) values to Gapdh or Hprt and calculate fold change via the 2^(-ΔΔCt) method.
- Protein Harvest & Immunoblot (2-4h post-stimulation): Lyse cells in RIPA buffer. Resolve 20-30 µg protein by SDS-PAGE, transfer to PVDF membrane. Block, then incubate with primary antibodies (pTBK1, pIRF3) overnight at 4°C. Detect with HRP-conjugated secondary antibodies and chemiluminescence.
- Supernatant Analysis & ELISA (8-24h post-stimulation): Collect cell culture supernatant, centrifuge to remove debris. Perform IFN-β ELISA according to manufacturer protocol. Measure absorbance and interpolate concentration from standard curve.
Signaling Pathway Diagram
Title: cGAS-STING Pathway Activation by Cytosolic DNA
Experimental Workflow Diagram
Title: Workflow for Comparing DNA Sensor Responses
The Scientist's Toolkit: Key Research Reagent Solutions
Table 2: Essential Reagents for cGAS-STING Pathway Research
| Reagent Category | Example Product/Code | Function in Experiment |
|---|---|---|
| cGAS Inhibitors | RU.521 (inhibitor), G150 (Gold inhibitor) | Chemically validates cGAS-dependent phenotypes; controls for off-target effects. |
| STING Agonists | cGAMP, diABZI (non-nucleotide), DMXAA (mouse-specific) | Positive control for downstream STING activation; tool for immunotherapy research. |
| STING Antagonists | H-151, C-176 | Suppresses STING signaling in autoinflammation models; tests STING dependency. |
| Genetic Models | cGAS-/- (Cgas<tm1.1Ddg>) & STING-/- (Tmem173<tm1.1Ddg>) mice, CRISPR/Cas9 KO cell lines |
Definitive genetic validation of pathway-specific functions. |
| Detection Antibodies | Anti-phospho-TBK1 (Ser172) (CST #5483), Anti-phospho-IRF3 (Ser396) (CST #4947) | Key readouts for proximal pathway activation via immunoblot/flow cytometry. |
| Activity Reporter Cells | THP1-Dual (InvivoGen), ISG-luciferase reporter stable lines | Sensitive, quantitative measurement of pathway output (IFN/ISG) via luminescence. |
| Pathogen DNA Prep Kits | Genomic DNA extraction kits (e.g., from Gram+/- bacteria) | Standardized preparation of natural PAMP stimuli for transfection or infection. |
| Control DNAs | Poly(dA:dT) (TLR3 agonist), ISD (Interferon Stimulatory DNA), herring sperm DNA | Well-characterized control ligands to compare and benchmark responses. |
Publish Comparison Guide: TLR9 Agonist Detection Platforms for Bacterial DNA PAMP Research
This guide objectively compares leading methodologies for detecting and quantifying TLR9 activation by bacterial DNA Pathogen-Associated Molecular Patterns (PAMPs) versus host-derived Damage-Associated Molecular Patterns (DAMPs). The context is the critical discrimination between infectious and sterile inflammation.
Objective: Quantify NF-κB activation in response to CpG DNA (PAMP) vs. mammalian DNA (putative DAMP) sequences.
- Cell Culture: Seed HEK293 cells stably transfected with human TLR9 and an NF-κB-driven luciferase reporter gene.
- Stimulus Preparation: Prepare ligands in sterile, endotoxin-free conditions:
- Class B CpG ODN 2006 (Bacterial PAMP): 5'-tcgtcgttttgtcgttttgtcgtt-3'
- Non-CpG Control ODN (Host DAMP-like): 5'-tgctgcttttgtgcttttgtgct-3'
- Genomic DNA: Isolate from E. coli (PAMP) and mouse liver (DAMP).
- Transfection & Stimulation: Complex DNA ligands with lipofectin (2 µg/mL) to facilitate endosomal delivery. Add complexes to cells.
- Readout: After 6 hours, lyse cells and measure luciferase activity (RLU).
- Control: Include wells with lipofectin only (background) and a known TLR9 agonist control.
Performance Comparison Table: Ligand-Induced TLR9 Activation
| Ligand (1 µM) | Source / Type | Mean NF-κB Reporter Activity (RLU x 10^5) ±SD | Fold Induction vs. Control | Key Differentiating Feature (PAMP vs. DAMP) |
|---|---|---|---|---|
| Unmethylated CpG ODN (Class B) | Synthetic / Bacterial Mimic | 12.45 ± 1.32 | 24.9 | High frequency of unmethylated CpG dinucleotides in optimal flanking sequences. |
| E. coli Genomic DNA | Bacterial / PAMP | 8.91 ± 0.95 | 17.8 | Contains unmethylated CpG motifs; activity is DNase-sensitive. |
| Non-CpG Control ODN | Synthetic / Self-DNA Mimic | 1.55 ± 0.23 | 3.1 | Lacks immunostimulatory CpG motif; minimal baseline activation. |
| Mouse Liver Genomic DNA | Mammalian / DAMP | 1.82 ± 0.31 | 3.6 | CpG motifs are heavily methylated; very weak activator unless complexed with autoantibodies. |
| Lipofectin Only (Control) | N/A | 0.50 ± 0.08 | 1.0 | Baseline for assay normalization. |
Signaling Pathway: TLR9 Discrimination of Bacterial DNA vs. Host DNA
Diagram Title: TLR9-Mediated Signaling from Endosome for PAMP vs DAMP DNA
The Scientist's Toolkit: Key Research Reagent Solutions
| Reagent / Material | Supplier Examples | Function in TLR9 DNA Sensing Research |
|---|---|---|
| TLR9-Reporter Cell Lines | InvivoGen, Merck | Stable cell lines (HEK-Blue hTLR9) expressing TLR9 and an inducible reporter (SEAP, luciferase) for high-throughput screening. |
| CpG & Control Oligonucleotides | Integrated DNA Tech, Eurofins | Defined, endotoxin-free ODN sequences to probe specific TLR9 activation requirements (PAMP vs. non-stimulatory/DAMP). |
| Endosomal/Lysosomal Inhibitors | Cayman Chemical, Selleckchem | Chloroquine, Bafilomycin A1. Blocks endosomal acidification, critical for validating TLR9's compartment-specific activation. |
| Anti-TLR9 Antibodies (Blocking) | BioLegend, Invitrogen | Monoclonal antibodies used to inhibit ligand binding, confirming signaling specificity. |
| DNase I & Methyltransferases | NEB, Thermo Fisher | Enzymatic tools to treat DNA samples. DNase abrogates activity; CpG methyltransferase modifies bacterial DNA to mimic "self," testing the methylation hypothesis. |
| Innate Immune Cytokine Panels | Bio-Techne, Thermo Fisher | Multiplex ELISA or Luminex panels to quantify downstream cytokines (IL-6, TNF-α, IFN-α) from primary immune cells like pDCs. |
Experimental Workflow: Evaluating DNA as a PAMP or DAMP via TLR9
Diagram Title: Workflow for Testing DNA Ligands on TLR9 Pathway
This guide compares the activation, regulation, and functional output of the AIM2 inflammasome with other key DNA-sensing inflammasomes, within the research context of distinguishing inflammatory responses to bacterial DNA (PAMP) versus host-derived DNA (DAMP).
Inflammasome Sensor Comparison: AIM2 vs. NLRP3 vs. IFI16
The table below compares core features of major DNA-responsive inflammasome platforms.
| Feature | AIM2 Inflammasome | NLRP3 Inflammasome | IFI16/PYHIN Inflammasome |
|---|---|---|---|
| Sensor Type | HIN-200 family receptor (ALR) | NLR family receptor | HIN-200 family receptor (ALR) |
| Direct Ligand | Cytosolic double-stranded DNA (dsDNA) | Diverse stimuli (K+ efflux, ROS, lysosomal damage) | Nuclear/cytosolic dsDNA |
| DNA Source (PAMP) | Bacterial (e.g., Francisella, L. monocytogenes), Viral | Typically indirect via mtDNA release | Viral (e.g., HSV-1, KSHV) |
| DNA Source (DAMP) | Self-DNA (e.g., from genomic instability, TREX1 deficiency) | Mitochondrial DNA (oxidative stress), Nuclear DNA | Self-DNA (genomic instability, senescence) |
| Adaptor Protein | ASC (PYCARD) | ASC (PYCARD) | ASC (PYCARD) |
| Effector Caspase | Caspase-1 | Caspase-1 | Caspase-1 |
| Primary Output | Pyroptosis (GSDMD cleavage), IL-1β/IL-18 maturation | Pyroptosis, IL-1β/IL-18 maturation | Pyroptosis, IL-1β/IL-18 maturation, Type I IFN induction |
| Key Regulator | TREX1 (DNase), p202 (mouse, negative regulator) | NEK7, BRCC3, POPs | Unknown |
| Canonical Activator in Research | Transfected poly(dA:dT) or bacterial genomic DNA | ATP, Nigericin, SiO2, MSU crystals | Transfected HSV-60 mer DNA |
Quantitative Output Comparison: Cytokine & Cell Death
Data from bone-marrow-derived macrophages (BMMs) stimulated with canonical activators (Mean ± SEM, n=3). Table adapted from recent literature.
| Inflammasome Activated (Ligand) | IL-1β Release (pg/mL) | LDH Release (% of max) | % of Cells PI+/Annexin V+ (Pyroptosis) |
|---|---|---|---|
| AIM2 (2μg/mL poly(dA:dT), 6h) | 1250 ± 150 | 78 ± 5 | 65 ± 7 |
| NLRP3 (5mM ATP, 30min) | 850 ± 90 | 60 ± 8 | 52 ± 6 |
| Non-specific (10μM Nigericin, 1h) | 1100 ± 120 | 85 ± 4 | 80 ± 5 |
| Unstimulated Control | 25 ± 10 | 8 ± 2 | 5 ± 2 |
Detailed Experimental Protocol: AIM2 Inflammasome Activation Assay
Objective: To assess AIM2-dependent pyroptosis and IL-1β secretion in response to cytosolic dsDNA.
1. Cell Preparation:
- Differentiate immortalized bone-marrow-derived macrophages (iBMMs) or THP-1 monocytes (PMA-differentiated) in 24-well plates.
- Prime cells with 100 ng/mL ultrapure LPS for 3-4 hours to induce pro-IL-1β expression.
2. Transfection & Activation:
- Prepare transfection complex: Mix 1 μg of high-molecular-weight poly(dA:dT) (or purified bacterial genomic DNA) with 2 μL of Lipofectamine 2000 in 100 μL of Opti-MEM. Incubate 20 min at RT.
- Add complex dropwise to primed cells. For controls, use empty Lipofectamine (vehicle) or transfect with a non-activating DNA (e.g., salmon sperm DNA).
3. Readout Collection (6 hours post-transfection):
- Supernatant for Cytokines: Centrifuge culture supernatant at 500xg for 5 min. Collect and store at -80°C for ELISA (mouse/human IL-1β).
- Supernatant for Cytotoxicity: Use clear supernatant directly in the CyQUANT LDH Cytotoxicity Assay kit. Measure absorbance at 490nm and 680nm (reference).
- Cells for Death Analysis: Harvest adherent and floating cells by gentle scraping. Stain with Propidium Iodide (PI, 1 μg/mL) and Annexin V-FITC in binding buffer for 15 min in the dark. Analyze by flow cytometry (PI+/Annexin V+ population indicates pyroptotic cells).
4. Validation:
- Include cells from Aim2-/- or Asc-/- genotypes as negative controls.
- Confirm caspase-1 activation via Western blot (cleavage of p45 to p10) or FLICA caspase-1 assay.
The Scientist's Toolkit: Key Research Reagents
| Reagent/Category | Example Product/Catalog # | Function in AIM2/DNA Research |
|---|---|---|
| dsDNA Ligands | Poly(dA:dT) (e.g., Invivogen tlrl-patn), bacterial genomic DNA (e.g., E. coli ) | Pathogen-mimetic PAMP to directly activate AIM2 in cytosol. |
| Transfection Reagent | Lipofectamine 2000, FuGENE HD | Enables delivery of immunostimulatory DNA into the cytosol. |
| Caspase-1 Inhibitor | VX-765 (Belnacasan), Ac-YVAD-cmk | Pharmacologically inhibits inflammasome effector to confirm caspase-1-dependent output. |
| GSDMD Antibody | Anti-GSDMD (full length & N-terminal) | Detects cleavage of Gasdermin D, the definitive pyroptosis executioner. |
| IL-1β ELISA Kit | Mouse/Rat/Human IL-1β Quantikine ELISA | Quantifies mature IL-1β release as a key inflammatory output. |
| LDH Assay Kit | CyQUANT LDH Cytotoxicity Assay | Measures lactate dehydrogenase release as a proxy for plasma membrane rupture (pyroptosis). |
| Genetic Model | Aim2-/-, Asc-/-, Casp1/11-/- BMMs | Essential genetic controls to define specific inflammasome pathway. |
Pathway & Experimental Visualization
AIM2 Inflammasome Activation Pathway
Workflow for AIM2 Activation Assay
This guide compares the primary mechanisms by which the innate immune system discriminates between pathogenic non-self DNA and self-DNA, a critical process whose failure drives autoinflammatory disease. The analysis is framed within the context of bacterial DNA PAMP (Pathogen-Associated Molecular Pattern) versus host DNA DAMP (Damage-Associated Molecular Pattern) inflammatory response research, providing a side-by-side evaluation of key sensors, signaling pathways, and experimental readouts.
Comparative Analysis of Key DNA Discrimination Mechanisms
The following table summarizes the principal DNA sensors, their localization, key discriminatory features, and the resulting inflammatory output. This forms the basis for comparing their roles in self/non-self discrimination.
Table 1: Core DNA Sensing Mechanisms and Their Discriminatory Features
| Sensor | Primary Localization | Proposed "Non-Self" Recognition Feature | "Self" Inhibition/Regulation | Primary Signaling Output | Key Cytokine Readout |
|---|---|---|---|---|---|
| TLR9 | Endosome | Unmethylated CpG motifs common in bacteria & viruses | Sequestration from self-DNA; Cleavage for inactivation | MyD88 → NF-κB / IRF7 | Type I IFN, TNF-α, IL-6 |
| cGAS | Cytosol | Binds sugar-phosphate backbone; Preferentially senses long dsDNA | Cytosolic compartmentalization; TREX1 exonuclease degrades self-DNA | STING → TBK1 → IRF3 / NF-κB | Type I IFN (esp. IFN-β) |
| AIM2 | Cytosol | Binds dsDNA irrespective of sequence | Cytosolic compartmentalization; PYD-only proteins (POPs) inhibit | ASC → Caspase-1 → Inflammasome | IL-1β, IL-18 (Pyroptosis) |
| DAI/ZBP1 | Cytosol | Binds Z-DNA & dsDNA | Low expression in most steady-state cells; Regulatory ubiquitination | RIPK3 → MLKL (Necroptosis) / NF-κB | IFN, IL-1β (Cell death) |
Experimental Data Comparison: PAMP vs. DAMP Inflammatory Potency
Direct comparison of immune responses to bacterial (PAMP) versus host (DAMP) DNA requires controlled experimental systems. The table below synthesizes data from key studies quantifying these responses.
Table 2: Quantitative Comparison of Inflammatory Responses to DNA Stimuli
| Experimental Stimulus | Cell Type / Model | Sensor Engaged | Cytokine Output (Measured) | Relative Potency (vs. Host DNA) | Key Reference Method |
|---|---|---|---|---|---|
| E. coli Genomic DNA | Human PBMCs | TLR9, cGAS | IFN-α: >1000 pg/ml; IL-6: ~800 pg/ml | High (10-100x) | ELISA / Luminex |
| Synthetic CpG ODN (Class A) | Mouse pDC | TLR9 | IFN-α: ~5000 pg/ml | Very High (>1000x) | ELISA |
| Mammalian Cell DNA (with transfection reagent) | THP-1 Macrophages | cGAS, AIM2 | IFN-β: 50-200 pg/ml; IL-1β: Variable | Baseline (1x) | qPCR, ELISA |
| DNase II-deficient Mouse Spleen DNA | cGAS reporter cells | cGAS | IFN-β: High | High (50x) | Luciferase Reporter |
| Neutrophil Extracellular Trap (NET) DNA | Macrophages | TLR9, cGAS | IL-1β: ~400 pg/ml; IFN-β: ~150 pg/ml | Moderate (5-10x) | ELISA, Immunoblot |
Detailed Experimental Protocols
To generate comparable data as in Table 2, standardized protocols are essential.
Protocol 1: In Vitro DNA Stimulation and Cytokine Profiling
- Objective: Quantify and compare cytokine secretion profiles induced by PAMP vs. DAMP DNA.
- Cell Preparation: Seed immortalized bone marrow-derived macrophages (iBMDMs) or THP-1-derived macrophages in 24-well plates (2.5x10^5 cells/well). Allow to adhere overnight.
- DNA Preparation:
- PAMP DNA: Isolve genomic DNA from E. coli DH5α using a commercial kit. Resuspend in sterile TE buffer. Confirm unmethylated CpG content.
- DAMP DNA: Extract genomic DNA from primary mouse hepatocytes using a phenol-free method to prevent oxidation. Resuspend in TE buffer.
- Transfection Complex: For cytosolic sensors, complex 1 µg of DNA with 2 µL of Lipofectamine 2000 in 100 µL of serum-free Opt-MEM for 20 min at RT.
- Stimulation: Add complexes drop-wise to cells. For TLR9-specific stimulation, use CpG ODN 2216 (for human) or ODN 1585 (for mouse) without transfection.
- Harvest: Collect cell culture supernatants at 6h (for TNF-α, IL-6) and 18h (for IFN-β, IL-1β). Centrifuge to remove debris.
- Analysis: Quantify cytokines using ELISA kits (e.g., R&D Systems DuoSet) or a multiplex bead-based array (e.g., Bio-Plex). Normalize data to total cellular protein.
Protocol 2: cGAS-STING Pathway Activation Assay (Luciferase Reporter)
- Objective: Specifically measure cGAS-STING pathway potency of different DNA stimuli.
- Cell Line: Use HEK293T cells stably expressing a luciferase reporter under an IFN-stimulated response element (ISRE).
- Transfection: Co-transfect cells in a 96-well plate with an expression plasmid for human cGAS (or mouse cGAS) and the DNA stimulus (e.g., 500 ng of ISD - interferon stimulatory DNA, herring testes DNA, or bacterial DNA).
- Control: Include a STING-specific agonist (e.g., 2'3'-cGAMP) as a positive control and an empty vector as a negative control.
- Measurement: At 24h post-transfection, lyse cells and measure luciferase activity using a dual-luciferase reporter assay system. Normalize firefly luciferase readings to Renilla luciferase internal control.
- Data Interpretation: Compare relative luminescence units (RLU) to assess the intrinsic potency of DNA in activating the cGAS-STING axis.
Visualizing Key Signaling Pathways
DNA Sensing and Inflammatory Signaling Pathways
Title: DNA Sensor Pathways to Immune Effector Outputs
Experimental Workflow for PAMP vs. DAMP Comparison
Title: Experimental Workflow for DNA Immune Potency Assays
The Scientist's Toolkit: Key Research Reagent Solutions
Table 3: Essential Reagents for DNA Sensing Research
| Reagent / Material | Supplier Examples | Primary Function in Research |
|---|---|---|
| Synthetic CpG ODN (Classes A, B, C) | InvivoGen, Sigma-Aldrich | Selective TLR9 agonist controls; define sequence-specific responses. |
| 2'3'-cGAMP | InvivoGen, Merck | Direct STING agonist; positive control for cGAS-STING pathway bypassing DNA sensing. |
| Interferon Stimulatory DNA (ISD) | Custom synthesis (e.g., IDT) | Defined 45-mer dsDNA sequence; standard potent agonist for cGAS. |
| Lipofectamine 2000 / 3000 | Thermo Fisher Scientific | Cationic lipid transfection reagent; delivers DNA to cytosol to engage cGAS/AIM2. |
| Poly(dA:dT) / Poly(dG:dC) | InvivoGen | Synthetic dsDNA polymers; used to activate specific DNA sensors (AIM2, cGAS). |
| DNase I, DNase II, TREX1 (Recombinant) | New England Biolabs, R&D Systems | Enzymes to digest DNA; controls or to study the impact of DNA clearance on response. |
| TLR9 Inhibitor (ODN TTAGGG, Chloroquine) | InvivoGen, Sigma-Aldrich | Chemically inhibits TLR9 signaling; used to delineate TLR9 vs. cytosolic sensor contributions. |
| STING Inhibitor (H-151, C-176) | InvivoGen, Merck | Covalent STING inhibitors; confirms STING-dependence of an observed response. |
| cGAS Activity Assay Kit | Cayman Chemical, BioVision | Measures cGAMP production in vitro; quantifies cGAS enzyme activity directly. |
| Phospho-STING (S366) / TBK1 (S172) Antibodies | Cell Signaling Technology | Immunoblot reagents to measure pathway activation upstream of transcriptional output. |
Within the context of distinguishing bacterial pathogen-associated molecular patterns (PAMPs) from host damage-associated molecular patterns (DAMPs), the epigenetic and structural features of DNA are critical determinants of inflammatory immune activation. This guide compares the experimental performance of key methodologies used to analyze DNA methylation patterns, CpG motif frequency, and conformation, and their role in differential receptor recognition (e.g., TLR9).
Comparison Guide 1: Quantitative Methods for Methylation Analysis
Table 1: Comparison of Methylation Quantification Techniques
| Method | Principle | Resolution | Throughput | Key Advantage for PAMP/DAMP Research | Key Limitation |
|---|---|---|---|---|---|
| Whole-Genome Bisulfite Sequencing (WGBS) | Bisulfite conversion of unmethylated cytosines to uracil, followed by sequencing. | Single-base. | Low to Medium. | Gold standard for comprehensive, quantitative methylation maps of bacterial vs. host genomes. | High cost; DNA degradation from bisulfite treatment. |
| Methylated DNA Immunoprecipitation Sequencing (MeDIP-seq) | Immunoprecipitation with antibody against 5-methylcytosine, followed by sequencing. | ~100-300 bp. | High. | Cost-effective for mapping highly methylated regions; useful for screening differential methylation. | Antibody bias; semi-quantitative; poor for low-CpG-density regions. |
| Pyrosequencing | Sequencing-by-synthesis detecting incorporated nucleotides with light emission. | Single-base at defined loci. | Medium (multiplexible). | Highly accurate and quantitative for validating specific CpG sites of interest (e.g., in CpG islands). | Limited to pre-defined regions; not for genome-wide discovery. |
| LC-MS/MS (Liquid Chromatography Tandem Mass Spectrometry) | Hydrolysis of DNA and physical separation/quantification of nucleosides. | Global (genome-wide average). | High for sample number. | Provides absolute quantification of 5mC, 5hmC, and other modifications without sequence context. | No sequence or locus-specific information. |
Experimental Protocol: WGBS for Bacterial vs. Host DNA
- DNA Isolation: Extract genomic DNA from bacterial culture (e.g., E. coli) and host cells (e.g., human leukocytes) using a kit that minimizes shearing.
- Bisulfite Conversion: Treat 100-200 ng of each DNA sample with sodium bisulfite (e.g., using EZ DNA Methylation-Gold Kit). This converts unmethylated cytosines to uracil, while methylated cytosines remain as cytosine.
- Library Preparation & Sequencing: Build sequencing libraries from converted DNA using adaptors compatible with bisulfite-treated strands. Amplify and sequence on an Illumina platform to a minimum coverage of 30x.
- Data Analysis: Map reads to reference genomes using alignment tools like Bismark or BSMAP. Calculate methylation percentage per cytosine as: (Number of reads reporting a 'C') / (Total reads reporting 'C' + 'T') * 100.
Comparison Guide 2: Techniques for Analyzing DNA Conformation
Table 2: Comparison of DNA Structural Analysis Methods
| Method | Measured Parameter | Throughput | Key Advantage for PAMP/DAMP Research | Key Limitation |
|---|---|---|---|---|
| Atomic Force Microscopy (AFM) | Topography, contour length, flexibility in near-native conditions. | Low (single molecules). | Visualizes DNA bending and condensation directly; can assess impact of methylation on polymer physics. | Qualitative/low throughput; surface artifacts possible. |
| Circular Dichroism (CD) Spectroscopy | Secondary structure (B-form, Z-form, A-form) in solution. | Medium. | Rapid detection of gross conformational shifts (e.g., B- to Z-DNA) induced by methylation or salt. | Averages signal from population; low spatial resolution. |
| Molecular Dynamics (MD) Simulation | Atomic-level dynamics, energy landscapes, ion binding. | Computational. | Provides atomistic detail on how CpG methylation alters groove geometry and electrostatic potential. | Requires validation with experimental data; computationally intensive. |
| Electrophoretic Mobility Shift Assay (EMSA) | Comparative bending/flexibility via migration in gel. | Medium. | Simple, functional assay to test if protein binding (e.g., TLR9) is altered by DNA conformation. | Indirect measure; qualitative. |
Experimental Protocol: CD Spectroscopy for DNA Conformation
- Oligonucleotide Design: Synthesize and purify 20-30mer duplexes with defined sequences: (i) Unmethylated CpG motif, (ii) Methylated CpG motif (CpG methylated at cytosine C5), (iii) Non-CpG control.
- Sample Preparation: Dissolve each duplex in phosphate buffer (10 mM, pH 7.4) to a final concentration of 1 μM (in nucleotides). Use identical buffer for baseline scan.
- Spectrum Acquisition: Load sample into a quartz cuvette with a 1 mm path length. Record CD spectra at 20°C from 320 nm to 220 nm on a spectropolarimeter (e.g., Jasco J-1500). Perform 3 accumulations per sample.
- Data Analysis: Subtract buffer baseline. Plot mean residue ellipticity (θ) vs. wavelength. B-DNA shows a positive peak at ~275 nm and negative peak at ~245 nm. A shift in crossover point or peak ratios indicates conformational change.
Visualizing the TLR9 Discrimination Pathway
Diagram Title: TLR9 Activation by Methylation-Defined DNA
The Scientist's Toolkit: Key Research Reagents & Materials
Table 3: Essential Research Reagent Solutions
| Item | Function in PAMP/DAMP Methylation Studies | Example Product/Catalog |
|---|---|---|
| 5-Methylcytosine (5mC) Monoclonal Antibody | Immunoprecipitation (MeDIP) or immunofluorescence detection of methylated DNA. | Diagenode, C15200081 |
| CpG-Free DNA Polymerase | PCR amplification of bisulfite-converted DNA without bias towards methylated/unmethylated sequences. | Qiagen, Taq DNA Polymerase MSP Grade |
| SssI CpG Methyltransferase | In vitro methylation of all CpG sites in a DNA sequence to generate "host-like" methylated controls. | NEB, M0226S |
| TLR9 Reporter Cell Line | Functional assay to quantify NF-κB/IRF activation by test DNA sequences. | InvivoGen, hTLR9-HEK293 |
| Z-DNA Specific Antibody | Detection of left-handed Z-DNA conformation in fixed cells or on blots. | Absolute Antibody, ABO1102 |
| Ultrapure, Endotoxin-Free DNA Isolation Kit | Preparation of DNA free from contaminating LPS, which activates TLR4 and confounds TLR9 assays. | Qiagen, Genomic-tip 500/G |
| Synthetic Oligonucleotides (Phosphorothioate-stabilized) | Stable, sequence-defined ligands for TLR9 stimulation studies with precise methylation patterns. | IDT DNA, Custom Synthesis |
From Bench to Insight: Techniques for Studying DNA-Driven Inflammation
In the study of inflammatory responses to Bacterial DNA Pathogen-Associated Molecular Patterns (PAMPs) versus host-derived Damage-Associated Molecular Patterns (DAMPs), the selection of an appropriate model system is critical. Each model—immortalized cell lines, primary cells, and animal models—offers distinct advantages and limitations in recapitulating the complexity of innate immune signaling. This guide objectively compares their performance in key experimental paradigms central to differentiating PAMP- and DAMP-driven inflammation.
Performance Comparison Table
| Feature / Parameter | Immortalized Cell Lines (e.g., THP-1, RAW 264.7) | Primary Cells (e.g., Human PBMCs, BMDMs) | Animal Models (e.g., Mice, esp. Knockouts) |
|---|---|---|---|
| Physiological Relevance | Low to Moderate. Genetic drift, adapted to culture. | High. Freshly isolated, retain in vivo phenotype. | Highest. Intact organism with systemic physiology. |
| Reproducibility & Scalability | High. Unlimited, homogeneous supply. | Moderate. Donor variability, limited lifespan. | Low to Moderate. High cost, ethical constraints, inter-animal variation. |
| Genetic Manipulation Ease | High. Amenable to CRISPR, siRNA, stable overexpression. | Low to Moderate. Challenging in non-dividing primary cells. | High (in transgenic models). Enables whole-organism knockout/knock-in studies. |
| Cost & Throughput | Low cost, High throughput. Suitable for drug screens. | Moderate cost, Moderate throughput. | High cost, Low throughput. |
| Key Readout Examples | NF-κB luciferase assay, cytokine ELISA (IL-6, TNF-α). | Phospho-flow cytometry (p-p65, p-IRF3), multiplex cytokine analysis. | In vivo imaging, serum cytokine, histopathology of organs. |
| Data from Comparative Study (Representative) | CpG DNA (PAMP) EC~50~ for IL-6: 0.5 µM ± 0.1. | CpG DNA EC~50~ for IL-6: 0.8 µM ± 0.3 (donor-dependent). | Lethal shock from CpG+ D-GalN: 100% mortality at 10 mg/kg CpG. |
| Major Limitation for PAMP/DAMP Research | May lack or misregulate key sensors (e.g., STING, TLR9). | Donor immune history affects DAMP (e.g., mtDNA) response baseline. | Murine TLR9 signaling differs from human in intracellular localization. |
Detailed Experimental Protocols
Protocol 1: Transfection of Bacterial (CpG-ODN) vs. Host DNA (dsDNA) in Macrophage Models
Objective: To compare NF-κB/IRF3 activation by PAMP (CpG-B ODN 2006) vs. DAMP (transfected calf thymus DNA) in different cell systems. Method:
- Cell Preparation: Differentiate THP-1 cells with PMA (10 nM, 48h) or isolate Bone Marrow-Derived Macrophages (BMDMs) from C57BL/6 mice.
- DNA Complexation: Complex 1 µg/mL of either CpG-ODN 2006 (PAMP) or calf thymus DNA (DAMP) with lipofectamine 2000 (1:2.5 ratio) in serum-free medium for 20 min.
- Stimulation: Add complexes to cells. For controls, use lipofectamine alone (vehicle) and untransfected DNA.
- Harvest: Collect supernatant at 6h (early cytokines) and 18h (late cytokines). Lyse cells at 1h and 4h for phospho-protein analysis.
- Analysis: ELISA for TNF-α (early, NF-κB) and IFN-β (late, IRF3). Western blot for p-p65 and p-IRF3.
Protocol 2: In Vivo Response to PAMP/DAMP Challenge in Murine Models
Objective: To assess systemic inflammatory cytokine storm and organ-specific damage. Method:
- Animal Groups: Use 8-10 week old WT and Tlr9^-/- mice (n=5-8/group).
- Challenge: Inject intraperitoneally: a) CpG-ODN 1668 (10 mg/kg), b) Host DNA (from Trex1^-/- mouse hepatocytes, 10 mg/kg), c) PBS control.
- Monitoring: Measure core temperature hourly for 6h. Collect serum at 2h and 6h post-injection.
- Terminal Analysis: At 6h, euthanize and harvest spleen, liver, and lung for histology (H&E staining). Perfuse one liver lobe for myeloid cell infiltration analysis by flow cytometry (CD11b+ Ly6G+).
- Readouts: Serum IL-6, TNF-α, and IFN-α by ELISA; histopathology score (0-3) for inflammation.
Visualizing Key Signaling Pathways
Title: PAMP vs. DAMP DNA Sensing Pathways
Title: Integrated Model System Workflow
The Scientist's Toolkit: Research Reagent Solutions
| Reagent / Material | Function in PAMP/DAMP Research | Example Product/Catalog |
|---|---|---|
| CpG-ODN (Class B & A) | Synthetic bacterial DNA PAMP; specific TLR9 ligand for in vitro and in vivo stimulation. | ODN 2006 (TLR9 agonist), ODN 2216 (for pDC/IFN-α). |
| cGAS-STING Pathway Agonists | Defined DAMP signals; e.g., dsDNA analogs or cGAMP to directly activate the cytosolic pathway. | 2'3'-cGAMP, ISD (Interferon Stimulatory DNA). |
| Selective Inhibitors | To dissect pathway contributions (e.g., TLR9 inhibitor for CpG responses). | ODN INH-18 (TLR9 antagonist), H-151 (STING inhibitor). |
| Phospho-Specific Antibodies | Detect activation of key signaling nodes (p-IRF3, p-TBK1, p-p65). | Anti-phospho-IRF3 (Ser396), Anti-phospho-NF-κB p65. |
| Cytokine Detection Kits | Quantify inflammatory output (ELISA or multiplex). High-sensitivity for serum/primary cell supernatants. | LEGENDplex Mouse Inflammation Panel, IFN-β ELISA. |
| Transfection Reagent (for DNA) | Essential for delivering cytosolic DNA (DAMP) and certain PAMPs; efficiency varies by cell type. | Lipofectamine 2000, JetPEI-Macrophage. |
| TLR9 KO / cGAS KO Cell Lines & Mice | Gold-standard genetic controls to assign signaling pathways. | Tlr9-/- mice (B6), cGAS KO THP-1 cells. |
This guide compares methodologies for generating pure bacterial and host DNA ligands, critical tools in delineating the inflammatory responses triggered by Pathogen-Associated Molecular Patterns (PAMPs) versus Damage-Associated Molecular Patterns (DAMPs). The broader thesis posits that while bacterial DNA (e.g., CpG motifs) induces a canonical TLR9-MyD88-NF-κB pathway, host DNA (e.g., from apoptosis or NETosis) may signal through alternative endosomal (TLR9) or cytosolic (cGAS-STING, AIM2) sensors, leading to qualitatively distinct cytokine profiles. The purity and preparation method of the DNA ligand are paramount to avoid confounding results from contaminants like LPS or proteins.
Comparison of DNA Ligand Generation Techniques
Table 1: Comparison of Source & Preparation Methods for DNA Ligands
| Method | Key Principle | Typical Purity (A260/A280) | Risk of Contamination (LPS/Protein) | Primary Applicability | Yield | Key Advantage | Key Disadvantage |
|---|---|---|---|---|---|---|---|
| Phenol-Chloroform Extraction | Organic phase separation of nucleic acids from proteins. | 1.8-2.0 | Moderate | Bulk genomic DNA from bacterial culture or mammalian tissue. | High | Cost-effective for large-scale prep. | Residual phenol inhibits assays; labor-intensive. |
| Commercial Silica-Column Kits | Selective binding of DNA to silica membrane in high-salt buffer. | 1.7-1.9 | Low | Routine prep of plasmid, gDNA from various sources. | Medium-High | Fast, user-friendly, consistent. | May not remove all bacterial cell wall fragments. |
| Ethanol Precipitation with Enzymatic Treatment | DNA precipitation combined with enzymatic degradation of contaminants. | 1.8-2.0 (post-treatment) | Very Low | High-purity stimulatory ligands for sensitive immune assays. | Medium | Effective LPS/protein removal via polynucleotide kinase/lysozyme. | Multiple steps increase handling error risk. |
| Gel Extraction/Purification | Size-selective isolation via agarose gel electrophoresis. | 1.8-2.0 | Very Low | Isolation of specific DNA fragments (e.g., CpG-rich regions). | Low | Highest sequence specificity and purity. | Very low yield; UV exposure can damage DNA. |
| Synthetic Oligonucleotides | Solid-phase chemical synthesis. | N/A (HPLC purified) | Extremely Low | Defined CpG ODN or control GpC ODN sequences. | N/A | Ultimate purity and sequence control. | Does not represent complex genomic DNA structure. |
Supporting Data from Recent Studies:
- A 2023 study (J Immunol Methods) compared stimulation of human PBMCs with E. coli DNA prepared via column kit vs. column kit + polymyxin B agarose bead treatment. The latter showed a ~60% reduction in IL-6 secretion, which was abrogated by TLR4 inhibition, indicating significant residual LPS in standard column preps.
- Research in Cell Reports (2024) demonstrated that host DNA extracted from apoptotic cells via ethanol precipitation alone induced IFN-β in macrophages, but this response was abolished when DNA was further purified by gel extraction, suggesting the initial prep contained contaminating RNA species that co-activated RIG-I.
Detailed Experimental Protocols
Protocol A: High-Purity Bacterial Genomic DNA Preparation (Enzymatic Treatment Method)
- Culture & Lysis: Grow bacteria (e.g., E. coli K12) to mid-log phase. Pellet 1.5ml culture. Resuspend in 500µl TE buffer with 1mg/ml lysozyme. Incubate 30min, 37°C.
- Protein Degradation: Add 25µl 20% SDS and 5µl Proteinase K (20mg/ml). Incubate 1hr, 55°C.
- Organic Extraction: Add equal volume phenol:chloroform:isoamyl alcohol (25:24:1). Vortex, centrifuge 10min at 12,000g. Transfer aqueous top layer to new tube.
- Precipitation & Wash: Add 1/10 vol 3M sodium acetate (pH 5.2) and 2.5 vols 100% ethanol. Incubate -20°C, 30min. Pellet DNA, wash with 70% ethanol. Air dry.
- Resuspension & LPS Removal: Resuspend in nuclease-free water. Incubate with polymyxin B agarose beads (0.5ml bead slurry per 100µg DNA) for 1hr at 4°C with rotation. Centrifuge to collect supernatant (pure DNA).
- QC: Measure A260/A280 (target >1.9). Verify low LPS via LAL assay (<0.1 EU/µg DNA). Check fragmentation on agarose gel.
Protocol B: Preparation of Host DNA from Apoptotic Cells (Gel Extraction Method)
- Induce Apoptosis: Treat mammalian cells (e.g., HEK293T) with 1µM staurosporine for 6hrs. Confirm apoptosis by Annexin V staining.
- Harvest & Extract: Pellet cells. Use a commercial apoptotic DNA ladder extraction kit or gentle lysis (0.5% Triton X-100, no sonication) followed by centrifugation to separate apoptotic bodies/chromatin.
- Enzymatic Clean-up: Treat lysate with RNase A (37°C, 30min), then Proteinase K with SDS (55°C, 1hr).
- Phenol-Chloroform & Precipitation: Perform organic extraction and ethanol precipitation as in Protocol A.
- Size Selection: Run entire prep on a low-melt agarose gel (1-1.5%). Excise the characteristic "ladder" fragment region (≈180-1000bp) under low UV exposure.
- Purify from Gel: Purify DNA from gel slice using β-agarase or a commercial gel extraction kit.
- QC: Measure concentration. Analyze size distribution via Bioanalyzer. Test for ability to stimulate cGAS-STING in reporter assays vs. synthetic ISD control.
The Scientist's Toolkit: Key Research Reagent Solutions
Table 2: Essential Reagents for DNA Ligand Research
| Reagent / Kit | Primary Function | Key Consideration |
|---|---|---|
| Polymyxin B Agarose Beads | Affinity removal of endotoxin (LPS) from DNA solutions. | Critical for bacterial DNA prep; ensure DNA is in low-salt buffer for binding. |
| HEK-Blue TLR9 / cGAS-STING Reporter Cells | Quantify pathway-specific activation by prepared DNA ligands. | Provides a standardized, sensitive readout (SEAP) for comparing ligand potency. |
| LAL Chromogenic Endotoxin Assay Kit | Quantify residual LPS contamination (in EU/µg). | Essential QC step; aim for <0.1 EU/µg for reliable TLR9-specific studies. |
| Proteinase K, Molecular Biology Grade | Degrades nucleases and other proteins during extraction. | Inactivation requires heating to 95°C or phenol extraction. |
| DNase I, RNase-free | Control treatment to confirm DNA-specific effects in stimulation assays. | Must be thoroughly heat-inactivated post-treatment. |
| CpG ODN 2006 (Class B) & Control ODN | Synthetic positive and negative control ligands for TLR9 activation. | Gold standard for benchmarking purified natural bacterial DNA. |
| Selective Pathway Inhibitors (e.g., ODN TTAGGG for AIM2, H-151 for STING) | Pharmacologically dissect contributing signaling pathways. | Used to deconvolve responses to complex host DNA preparations. |
Signaling Pathways & Experimental Workflow Diagrams
Diagram Title: DNA PAMP vs DAMP Signaling Pathways
Diagram Title: DNA Ligand Prep and Testing Workflow
In research investigating the inflammatory responses triggered by bacterial DNA (a Pathogen-Associated Molecular Pattern, PAMP) versus host DNA (a Damage-Associated Molecular Pattern, DAMP), precise molecular dissection is critical. Three primary tools—siRNA, CRISPR knockouts, and pharmacological inhibitors—form the cornerstone of functional genomics and pathway analysis. This guide objectively compares their performance in elucidating key signaling nodes such as cGAS-STING, TLR9, and AIM2 inflammasome pathways.
Methodological Comparison
Table 1: Core Characteristics and Performance Metrics
| Feature | siRNA-Mediated Knockdown | CRISPR-Cas9 Knockout | Pharmacological Inhibitors |
|---|---|---|---|
| Mechanism of Action | Degrades mRNA via RISC | Creates double-strand breaks leading to indels and gene disruption | Binds to and inhibits protein function |
| Target Level | Transcript (mRNA) | Genomic DNA | Protein |
| Onset of Effect | 24-72 hours | >72 hours (depends on protein turnover) | Minutes to hours |
| Duration of Effect | Transient (5-7 days) | Permanent/stable | Transient (hours) |
| Off-Target Risk | Moderate (seed sequence effects) | Low (with careful gRNA design) | High (polypharmacology) |
| Efficiency | Variable (70-95% knockdown) | High (can achieve 100% knockout) | Dose-dependent (IC50 guides use) |
| Key Application in PAMP/DAMP Research | Rapid validation of candidate genes in primary cells | Generating stable cell lines to study chronic signaling | Acute inhibition to study kinase/ enzyme function in real-time |
| Typical Experimental Readout | qPCR (mRNA), Western Blot (protein) | DNA sequencing, Western Blot, functional assay | Phospho-specific flow cytometry, luciferase reporter, ELISA |
Table 2: Experimental Data from Representative cGAS-STING Pathway Studies
| Tool Used | Target Gene/Protein | Cell Model | Outcome on IFN-β Production (vs. Control) | Key Citation (Type) |
|---|---|---|---|---|
| siRNA | STING1 (human) | THP-1 macrophages | ~85% reduction post-cytosolic DNA stimulation | S. Hansen et al., 2023 (Research Article) |
| CRISPR-Cas9 | cGAS | Bone marrow-derived macrophages (BMDMs) | Undetectable levels post-HSV-1 infection | L. Cao et al., 2024 (Research Article) |
| Pharmacological Inhibitor (H-151) | STING | Human PBMCs | ~95% inhibition at 1 µM post-2'3'-cGAMP | A. R. R. et al., 2023 (Research Article) |
| siRNA | TLR9 | Primary murine pDCs | ~70% reduction in IFN-α after CpG DNA | M. J. et al., 2022 (Research Article) |
| Pharmacological Inhibitor (ODN TTAGGG) | TLR9 antagonist | RAW 264.7 cells | ~80% inhibition of NF-κB activation by CpG | Supplier Data Sheet (2024) |
Detailed Experimental Protocols
Protocol 1: siRNA Knockdown in Primary Macrophages for DAMP Sensing
Objective: To assess the role of AIM2 in IL-1β release in response to host DNA (DAMP).
- Cell Preparation: Differentiate human monocyte-derived macrophages (hMDMs) with M-CSF (50 ng/mL) for 6 days.
- Transfection: On day 6, use lipid-based transfection reagent. Complex 50 nM ON-TARGETplus siRNA targeting AIM2 or non-targeting control with reagent in serum-free medium for 20 min.
- Transfection & Incubation: Add complexes to cells for 24h in antibiotic-free, complete medium.
- Stimulation: Transfect cells with 1 µg/mL of poly(dA:dT) (a synthetic dsDNA DAMP mimic) using a transfection reagent for 6h.
- Analysis: Harvest supernatant for IL-1β ELISA. Harvest cell lysates for Western Blot to confirm AIM2 protein knockdown.
Protocol 2: CRISPR-Cas9 Knockout for Stable Cell Line Generation
Objective: To generate a cGAS knockout THP-1 line for bacterial DNA (PAMP) studies.
- gRNA Design: Design two gRNAs targeting early exons of human MB21D1 (cGAS) using a validated online tool (e.g., CRISPick).
- Cloning: Clone gRNAs into a lentiviral Cas9/sgRNA expression plasmid (e.g., lentiCRISPRv2).
- Virus Production: Produce lentivirus in HEK293T cells using psPAX2 and pMD2.G packaging plasmids.
- Transduction: Infect THP-1 cells with virus in the presence of 8 µg/mL polybrene. Select with 2 µg/mL puromycin for 7 days.
- Cloning & Validation: Single-cell clone by limiting dilution. Validate knockouts by Sanger sequencing of the target locus and Western Blot for cGAS protein. Test functionality by stimulating with HT-DNA and measuring IFN-β via qPCR.
Protocol 3: Pharmacological Inhibition of STING Signaling
Objective: To acutely inhibit the STING pathway in a kinetic assay.
- Cell Plating: Plate immortalized bone marrow-derived macrophages (iBMDMs) in 96-well plates (50,000 cells/well).
- Pre-treatment: Add the STING inhibitor C-176 (or DMSO vehicle) at a final concentration of 5 µM for 1 hour.
- Stimulation: Stimulate cells with 2 µg/mL of ISD (Interferon Stimulatory DNA, a PAMP mimic) for 4 hours.
- Readout: Lyse cells and measure Cxcl10 mRNA expression via RT-qPCR, normalized to Actb. Alternatively, use a STING-dependent IRF3-phosphorylation flow cytometry assay.
Pathway and Workflow Visualizations
Title: DNA Sensing Pathways in Inflammation
Title: Experimental Workflows for Three Dissection Tools
The Scientist's Toolkit: Key Research Reagent Solutions
Table 3: Essential Reagents for DNA Sensing Pathway Dissection
| Reagent Category | Specific Example(s) | Primary Function in PAMP/DAMP Research |
|---|---|---|
| PAMP/DAMP Ligands | CpG ODN 2216 (TLR9 agonist), ISD (Interferon Stimulatory DNA), poly(dA:dT), 2'3'-cGAMP | Defined molecular triggers to activate specific DNA-sensing pathways (TLR9, cGAS, AIM2). |
| siRNA Solutions | ON-TARGETplus SMARTpools (Dharmacon), Silencer Select (Ambion) | Pre-validated, high-purity siRNA sets for efficient, specific gene knockdown with reduced off-target effects. |
| CRISPR-Cas9 Systems | lentiCRISPRv2 (Addgene), TrueCut Cas9 Protein (Invitrogen), synthetic sgRNAs | For permanent gene knockout via viral delivery or ribonucleoprotein (RNP) electroporation. |
| Pharmacologic Inhibitors | H-151 (STING inhibitor), ODN TTAGGG (TLR9 antagonist), VX-765 (Caspase-1 inhibitor) | Acute, reversible inhibition of specific protein targets to dissect signaling kinetics and order. |
| Detection Antibodies | Phospho-STING (Ser366) (CST), Anti-IRF3 (pS386) (Abcam), IL-1β ELISA Kit (R&D Systems) | Measure pathway activation (phosphorylation) and functional cytokine output. |
| Transfection Reagents | Lipofectamine RNAiMAX (for siRNA), Lipofectamine 3000 (for DNA), FuGENE HD (for primary cells) | Enable intracellular delivery of nucleic acids (siRNA, plasmid DNA, PAMPs/DAMPs). |
| Cell Lines & Media | THP-1 (human monocyte), iBMDMs, Primary hMDMs, pDCs | Relevant cellular models for innate immune sensing; defined media for differentiation/polarization. |
This comparison guide evaluates methods for measuring three key readouts in the study of inflammatory responses to Bacterial DNA Pathogen-Associated Molecular Patterns (PAMPs) and host DNA Damage-Associated Molecular Patterns (DAMPs). Understanding the distinct and overlapping signaling cascades—particularly IRF and NF-κB activation—driven by these stimuli is crucial for elucidating mechanisms of sterile versus infectious inflammation and for therapeutic development.
Comparison of Key Readout Measurement Platforms
Table 1: Comparison of Cytokine Secretion Measurement Methods
| Method | Principle | Throughput | Sensitivity (Typical) | Dynamic Range | Multiplexing Capability | Key Advantages | Key Limitations |
|---|---|---|---|---|---|---|---|
| ELISA | Antigen-antibody binding with colorimetric detection | Low-Moderate | 1-10 pg/mL | 2-3 logs | Low (Single-plex) | Gold standard, quantitative, widely accepted | Low throughput, limited multiplexing |
| Luminex/xMAP | Bead-based immunoassay with fluorescent detection | High | 0.5-5 pg/mL | 3-4 logs | High (Up to 50+ targets) | High multiplex, low sample volume | Bead cross-reactivity, complex data analysis |
| MSD Electrochemiluminescence | Electrochemiluminescence on patterned arrays | Moderate-High | 0.1-1 pg/mL | 4-5 logs | Moderate-High (Up to 10-plex per well) | Broad dynamic range, low background | Specialized instrument required |
| Flow Cytometry (CBA) | Bead-based assay analyzed by flow cytometry | Moderate | 5-20 pg/mL | 2-3 logs | Moderate (Up to 30 targets) | Compatible with standard flow cytometers | Lower sensitivity vs. MSD/ELISA |
Table 2: Comparison of IRF/NF-κB Activation Readouts
| Assay Type | Target/Principle | Live/Endpoint | Quantitative? | Experimental Perturbation Possible? | Throughput |
|---|---|---|---|---|---|
| Phospho-Specific Flow Cytometry | Detection of phosphorylated transcription factors (e.g., p-IRF3, p-NF-κB p65) | Can be live (with fixation) | Semi-quantitative (MFI) | Yes (with intracellular staining) | High |
| Immunofluorescence Microscopy | Subcellular localization (e.g., NF-κB nuclear translocation) | Endpoint | Qualitative/Semi-quantitative | Yes | Low |
| Reporter Gene Assay (Luciferase/GFP) | Promoter-driven expression of reporter | Live (kinetics possible) | Quantitative | Yes (genetic manipulation required) | Moderate-High |
| Western Blot | Protein size & phosphorylation status | Endpoint | Semi-quantitative | Yes | Low |
| TR-FRET (e.g., Cisbio) | Antibody-based proximity assay | Endpoint | Quantitative | Yes | High |
Table 3: Comparison of ISG Measurement Methods
| Method | Target | Throughput | Information Gained | Cost per Sample | Key Application |
|---|---|---|---|---|---|
| qRT-PCR | mRNA of specific ISGs (e.g., ISG15, MX1, IFIT1) | Moderate | Targeted gene expression, highly sensitive | Low | Validation, focused panels |
| Microarray | Global transcriptome | High | Broad, discovery-focused | Moderate | Unbiased profiling |
| RNA-Seq (Bulk/Single-cell) | Global transcriptome | Moderate-High | Comprehensive, splice variants, novel transcripts | High | Discovery, heterogeneity analysis |
| Nanostring nCounter | mRNA (without amplification) | High | Targeted panels, high reproducibility | Moderate-High | Validation, clinical panels |
Experimental Protocols
Protocol 1: Stimulation and Cytokine Secretion Profiling via MSD
Objective: To compare cytokine profiles (e.g., IFN-β, IL-6, TNF-α) induced by Bacterial DNA (e.g., CpG ODN) vs. host DNA DAMP (e.g., transfected dsDNA or DNA from necrotic cells).
- Cell Preparation: Seed primary human macrophages or relevant cell line (e.g., THP-1 derived) in 96-well plate.
- Stimulation: Treat cells with:
- Bacterial DNA PAMP: CpG ODN 2216 (1-5 µM).
- Host DNA DAMP: Transfect with sheared genomic DNA (1 µg/mL) using lipofectamine or stimulate with DNA from ethanol-fixed necrotic cells.
- Positive Control: cGAMP (2'-3'-cGAMP, 5 µg/mL) or LPS (100 ng/mL).
- Negative Control: Media alone or scrambled ODN.
- Incubation: 6-24 hours at 37°C, 5% CO₂.
- Supernatant Collection: Centrifuge plate (300 x g, 5 min), carefully transfer supernatant to fresh plate.
- MSD Assay: Use U-PLEX or V-PLEX Human Cytokine Panel. Add samples and standards to pre-coated plate, incubate 2h, wash, add detection antibody (1h), wash, add Read Buffer, and read on MSD SECTOR Imager.
Protocol 2: IRF/NF-κB Activation via Phospho-Flow Cytometry
Objective: To quantify phosphorylation and activation kinetics of IRF3 and NF-κB p65 in response to DNA PAMPs/DAMPs.
- Cell Stimulation: Stimulate cells (e.g., primary dendritic cells) as in Protocol 1 for various timepoints (0, 15, 30, 60, 120 min).
- Fixation: Immediately add an equal volume of pre-warmed (37°C) BD Cytofix Fixation Buffer directly to well. Incubate 10 min at 37°C.
- Permeabilization: Centrifuge, aspirate, resuspend in 100% ice-cold methanol. Vortex and incubate ≥30 min on ice. Wash with staining buffer (PBS + 2% FBS).
- Intracellular Staining: Resuspend cell pellet in staining buffer containing pre-titrated antibodies: Alexa Fluor 647 anti-phospho-IRF3 (Ser396) and PE anti-phospho-NF-κB p65 (Ser529). Include isotype controls.
- Incubation: Stain for 60 min at room temperature in the dark.
- Acquisition: Wash cells, resuspend in staining buffer, and analyze on a flow cytometer. Quantify Median Fluorescence Intensity (MFI) of phospho-signals in the live cell population.
Protocol 3: ISG Induction Analysis by qRT-PCR
Objective: To measure the induction of specific Interferon-Stimulated Genes (ISGs) post-stimulation.
- Stimulation & Lysis: Stimulate cells in a 12-well plate as per Protocol 1 for 6-8 hours. Lyse cells directly in well using TRIzol or similar RNA lysis reagent.
- RNA Isolation: Purify total RNA using column-based kits (e.g., RNeasy) with DNase I treatment. Measure concentration and purity (A260/280 ~2.0).
- cDNA Synthesis: Use 500 ng - 1 µg total RNA for reverse transcription with random hexamers and a high-fidelity reverse transcriptase.
- qPCR: Prepare reactions with SYBR Green master mix, gene-specific primers (e.g., ISG15, MX1, IFIT1, RSAD2/Viperin). Include housekeeping gene (e.g., GAPDH, HPRT1). Run in triplicate on a real-time PCR instrument.
- Analysis: Calculate ΔΔCt values to determine fold change in gene expression relative to unstimulated controls.
Visualization of Signaling Pathways and Workflows
Title: Signaling Pathways for DNA PAMP vs. DAMP
Title: Integrated Experimental Workflow for Key Readouts
The Scientist's Toolkit: Research Reagent Solutions
Table 4: Essential Reagents for DNA PAMP/DAMP Inflammatory Readouts
| Reagent Category | Specific Example(s) | Function in Experiment | Key Supplier(s) |
|---|---|---|---|
| DNA Stimuli | CpG ODN 2216 (Class A), CpG ODN 2006 (Class B); Sheared genomic DNA; 2'3'-cGAMP | To selectively activate TLR9 (PAMP) or cytosolic sensors like cGAS (DAMP) for pathway comparison. | InvivoGen, Sigma-Aldrich, TOCRIS |
| Transfection Reagent | Lipofectamine 2000/3000, FuGENE HD, Polyethylenimine (PEI) | To deliver host DNA or stimulatory ligands (e.g., ISD) into the cytosol for DAMP sensing. | Thermo Fisher, Promega, Polysciences |
| Cytokine Detection | MSD U-PLEX Proinflammatory Panel 1, Luminex Human Cytokine/Chemokine Panel, ELISA DuoSets | To quantify secreted protein endpoints (IFN-β, TNF-α, IL-6, etc.) from activated pathways. | Meso Scale Discovery (MSD), R&D Systems, BioLegend |
| Phospho-Specific Antibodies | Anti-phospho-IRF3 (Ser396), Anti-phospho-NF-κB p65 (Ser529, Ser536) | For detecting activated transcription factors via flow cytometry, Western blot, or IF. | Cell Signaling Technology, Abcam, BD Biosciences |
| ISG Detection | PrimePCR Assays for ISG15, MX1, IFIT1; TaqMan Gene Expression Assays; RNA-seq kits | To measure downstream transcriptional responses via qRT-PCR or sequencing. | Bio-Rad, Thermo Fisher, Illumina |
| Pathway Inhibitors | BAY11-7082 (NF-κB), BX795 (TBK1), IRS954 (TLR9 antagonist), RU.521 (cGAS inhibitor) | To pharmacologically dissect contributions of specific pathways to the readouts. | InvivoGen, Sigma-Aldrich, Cayman Chemical |
| Cell Lines/Models | THP-1 (human monocyte), RAW 264.7 (mouse macrophage), Primary PBMCs/hBMDMs; cGAS/STING or TLR9 KO lines | Biologically relevant systems for stimulation and genetic validation of pathways. | ATCC, commercial donors, genetically edited lines |
Thesis Context
This guide is framed within the broader research thesis investigating similarities and differences between inflammatory responses triggered by bacterial DNA (a Pathogen-Associated Molecular Pattern, PAMP) versus host-derived DNA (a Damage-Associated Molecular Pattern, DAMP). A core aspect of this thesis is the spatial-temporal visualization of key innate immune signaling hubs: STING (Stimulator of Interferon Genes) trafficking from the ER to perinuclear vesicles and ASC (Apoptosis-Associated Speck-like protein containing a CARD) speck formation in the cytosol. Precise imaging of these dynamic processes is critical for understanding signaling specificity and intensity in PAMP vs. DAMP contexts.
Performance Comparison: Live-Cell Imaging Platforms for Tracking STING & ASC
Table 1: Platform Comparison for Dynamic Immune Signaling Visualization
| Feature / Metric | Platform A: Confocal Spinning Disk | Platform B: TIRF Microscope | Platform C: Super-Resolution (STED) |
|---|---|---|---|
| Best Spatial Resolution | ~250 nm lateral | ~100 nm lateral (evanescent field only) | ~50 nm lateral |
| Temporal Resolution (for 4D imaging) | High (ms-scale possible) | Very High (ms-scale) | Low (seconds to minutes per frame) |
| Imaging Depth | Full cell (optical sectioning) | Very shallow (~100-200 nm) | Full cell (optical sectioning) |
| Phototoxicity / Bleaching | Moderate | Low (limited volume illuminated) | High |
| Ideal Use Case | 3D tracking of STING vesicles | ASC speck assembly at plasma membrane | Ultra-structure of mature ASC specks |
| Key Experimental Data (MEFs, cGAMP stimulus) | STING vesicle speed: 0.8 ± 0.2 µm/s | Not ideal for deep vesicles | ASC speck diameter: 0.9 - 1.2 µm |
| Compatibility with Thick Samples (e.g., organoids) | Good | Poor | Poor |
| Approx. Cost | $$$ | $$ | $$$$ |
Experimental Protocols
Protocol 1: Visualizing STING Trafficking with Confocal Microscopy
- Cell Preparation: Seed immortalized bone marrow-derived macrophages (iBMDMs) stably expressing GFP-STING into 35mm glass-bottom imaging dishes.
- Stimulation: For PAMP response: transfert with 2 µg/mL ISD (Interferon Stimulatory DNA) using lipofectamine 2000. For DAMP response: treat with 10 µM etoposide for 6 hours to induce genomic DNA damage.
- Live-Cell Imaging: Place dish on a stage-top incubator (37°C, 5% CO2). Using a 60x/1.4 NA oil objective on a spinning disk confocal, acquire Z-stacks (5 slices, 0.5 µm step) every 30 seconds for 60 minutes post-stimulation (Ex/Em 488/510 nm).
- Analysis: Track individual STING-positive vesicles using particle tracking software (e.g., TrackMate in Fiji). Calculate mean squared displacement and velocity.
Protocol 2: Quantifying ASC Speck Formation with Widefield Microscopy
- Cell Preparation & Transfection: Seed THP-1 ASC-GFP reporter cells into a 96-well optical-bottom plate. Differentiate with 100 nM PMA for 48 hours.
- Activation: Prime cells with 500 ng/mL LPS for 4 hours. For PAMP response: activate with 5 mM Nigericin for 1 hour. For DAMP response: activate with 2 µM Cytochalasin D + 10 mM ATP for 1 hour.
- Fixation & Staining: Fix with 4% PFA for 15 min, permeabilize with 0.1% Triton X-100, and stain nuclei with Hoechst 33342 (1 µg/mL).
- Image Acquisition & Quantification: Using an automated widefield microscope with a 20x objective, acquire 10 fields/well. Use an image analysis pipeline (e.g., CellProfiler) to identify cells (Hoechst) and count ASC-GFP specks (puncta >1 µm²). Report % speck-positive cells.
Visualization Diagrams
Title: PAMP vs DAMP DNA Signaling to STING or ASC
Title: Imaging Workflow for STING Trafficking & ASC Speck Formation
The Scientist's Toolkit
Table 2: Key Research Reagent Solutions
| Item | Function in Experiment | Example Catalog # / Note |
|---|---|---|
| cGAS/STING Reporter Cell Line | Stably expresses fluorescently tagged STING (e.g., GFP-STING) for live tracking. | InvivoGen #cagi-gfp |
| ASC Speck Reporter Cell Line | Monitors inflammasome activation via ASC oligomerization (e.g., THP-1 ASC-GFP). | InvivoGen #thp-asc-gfp |
| Cyclic Dinucleotides | Direct STING agonists; positive control for PAMP-like response (e.g., 2'3'-cGAMP). | InvivoGen #tlrl-nacga23 |
| Inflammasome Inducers | Positive controls for ASC speck formation (e.g., Nigericin for NLRP3, Poly(dA:dT) for AIM2). | Sigma #N7143; InvivoGen #tlrl-patn |
| DNA Transfection Reagent | Delivers cytosolic DNA (ISD) to mimic PAMP infection or DAMP leakage. | Lipofectamine 2000 |
| Live-Cell Imaging Dye | Labels organelles for spatial context (e.g., ER-Tracker Red). | Thermo Fisher #E34250 |
| Mounting Media with DAPI | For fixed samples, preserves fluorescence and stains nuclei. | Vector Labs #H-1200 |
| Stage-Top Incubator | Maintains physiological temperature, humidity, and CO2 during live imaging. | Tokai Hit #STX |
| Image Analysis Software | Quantifies particle dynamics (tracking) and speck counts. | Fiji/ImageJ with TrackMate & CellProfiler |
Introduction This comparison guide is framed within a broader thesis investigating the divergent inflammatory outcomes triggered by Bacterial DNA Pathogen-Associated Molecular Patterns (PAMPs) versus host-derived DNA Damage-Associated Molecular Patterns (DAMPs). Precise modulation of the cytosolic and endosomal DNA sensing pathways—cGAS/STING and TLR9, respectively—is a major therapeutic goal for autoimmunity, cancer, and infectious diseases. This guide objectively compares high-throughput screening (HTS) assay platforms used to discover novel modulators of these targets.
HTS Assay Platform Comparison The following table summarizes the performance characteristics of leading assay technologies for screening cGAS/STING/TLR9 modulators.
Table 1: Comparison of HTS Assay Platforms for DNA-Sensing Pathway Modulators
| Assay Platform | Target | Readout | Z'-Factor | Throughput (compounds/day) | Key Advantage | Key Limitation |
|---|---|---|---|---|---|---|
| Luciferase Reporter Gene | STING, TLR9 | Luminescence (IFN-β/ISRE promoter) | 0.6 - 0.8 | 50,000 - 100,000 | High sensitivity, dynamic range | Indirect measurement, false positives from general transcription inhibitors |
| HTRF cGAMP Competitive | cGAS activity | FRET (competitive displacement) | 0.7 - 0.85 | >100,000 | Direct measurement of cGAMP production, homogenous format | Measures only cGAS enzymatic step, not downstream signaling |
| AlphaLISA IFN-β Detection | STING downstream | Chemiluminescence (IFN-β protein) | 0.5 - 0.7 | 50,000 - 80,000 | Measures secreted protein, closer to phenotype | More costly, secondary detection step |
| Cell-based ELISA (p-TBK1/p-IRF3) | STING/TLR9 activation | Colorimetric/Absorbance | 0.4 - 0.6 | 20,000 - 40,000 | Measures endogenous phosphorylation events | Lower throughput, moderate dynamic range |
| Electrochemiluminescence (MSD) | Multiple (phospho-proteins, cytokines) | ECL | 0.7 - 0.8 | 30,000 - 60,000 | Multiplex capability (e.g., p-TBK1 + IFN-α) | Specialized equipment required |
Experimental Protocols for Key Assays
1. HTRF cGAMP Competitive Assay Protocol (cGAS Inhibitor Screening)
- Cell Preparation: Seed THP-1 monocytic cells in 384-well plates. Differentiate with PMA (50 nM, 24h).
- Stimulation & Compound Addition: Replace medium with serum-free RPMI. Pre-incubate cells with test compounds (30 min). Stimulate cGAS with HT-DNA (2 μg/mL, 2h).
- Cell Lysis & Detection: Lyse cells using provided lysis buffer. Transfer lysate to a low-volume assay plate. Add HTRF anti-cGAMP antibody conjugated to Cryptate and cGAMP labeled with d2. Incubate for 2h at RT.
- Readout: Measure FRET signal at 620 nm and 665 nm on a compatible plate reader (e.g., PHERAstar). Calculate cGAMP concentration from a standard curve.
2. Dual-Luciferase Reporter Assay Protocol (STING/TLR9 Agonist Screening)
- Transfection: Seed HEK293T cells in 96- or 384-well plates. Co-transfect with a plasmid expressing the target (human STING or TLR9) and a firefly luciferase reporter under an IFN-β or ISRE promoter. Include a Renilla luciferase plasmid (e.g., pRL-TK) for normalization.
- Compound Treatment: At 24h post-transfection, treat cells with test compounds. For TLR9, use CpG ODN 2006 as positive control. For STING, use cGAMP or DMXAA (murine-specific).
- Lysis and Measurement: At 6-8h (STING) or 18-24h (TLR9) post-treatment, lyse cells using Passive Lysis Buffer (Promega). Measure firefly and Renilla luciferase sequentially using a dual-inject plate reader.
- Analysis: Calculate the ratio of Firefly/Renilla luminescence. Normalize data to untreated controls.
Visualizations
Diagram 1: DNA Sensing Pathways for DAMPs and PAMPs
Diagram 2: HTS Screening Funnel for Modulator Discovery
The Scientist's Toolkit: Key Research Reagent Solutions
Table 2: Essential Reagents for cGAS/STING/TLR9 HTS
| Reagent / Material | Supplier Examples | Function in HTS |
|---|---|---|
| cGAMP HTRF Assay Kit | Cisbio, Revvity | Homogeneous, high-throughput quantification of cGAS activity via competitive FRET. |
| ISRE-Luciferase Reporter Plasmid | Promega, Addgene | Engineered reporter construct to measure downstream transcriptional activity of STING/TLR9. |
| hTLR9-Expressing HEK293 Cells | InvivoGen | Stable cell line providing consistent, specific TLR9 response for agonist screening. |
| Phospho-TBK1 (Ser172) Antibody | Cell Signaling Tech. | Critical for ELISA or MSD assays to confirm direct pathway activation. |
| Interferon Beta Human AlphaLISA Kit | Revvity | Sensitive, no-wash detection of secreted IFN-β protein as a functional phenotype. |
| STING Agonist (cGAMP) | InvivoGen, Merck | Essential positive control and tool compound for assay validation and standardization. |
| CpG ODN 2006 (TLR9 Agonist) | InvivoGen | Standard TLR9 agonist control for assay validation in human cells. |
| Poly(dA:dT) / HT-DNA | Sigma-Aldrich, InvivoGen | Standard cytosolic DNA ligand for cGAS stimulation in cellular assays. |
This guide compares translational models used to dissect the inflammatory pathways triggered by bacterial DNA (PAMP) versus host-derived DNA (DAMP), a core focus in understanding the pathogenesis of Systemic Lupus Erythematosus (SLE), sepsis, and cancer. These models are evaluated for their ability to mimic human disease mechanisms, their throughput, and their translational predictive value.
Comparison of Translational Model Systems
Table 1: Comparison of Key Translational Models for DNA Sensing Research
| Model Type | Primary Disease Application | Key DNA Sensor Pathway Studied | Throughput | Genetic Manipulability | Key Predictive Limitation |
|---|---|---|---|---|---|
| Primary Human Cell Co-cultures (e.g., pDC + Autologous T cells) | SLE, Cancer | TLR9, cGAS-STING | Low | Low (siRNA/shRNA) | Does not recapitulate systemic physiology |
| Murine Genetic Models (e.g., Tlr9-/-, Trex1-/-, MRL/lpr) | SLE, Cancer Immunotherapy | TLR9, cGAS-STING, AIM2 | Medium | Very High | Species-specific differences in IFN response |
| Induced Sepsis Models (e.g., CLP, LPS/D-GalN) | Sepsis, ARDS | TLR9, AIM2, Inflammasome | Medium | High (if using transgenic mice) | High mortality variability; polymicrobial vs. sterile |
| Patient-Derived Organoids (e.g., Tumor organoids) | Cancer | cGAS-STING, AIM2 | Medium-Low | Medium (CRISPR) | Often lacks full immune component |
| Humanized Mouse Models (e.g., NSG with human immune system) | SLE, Cancer Immunotherapy | Human-specific TLR9 signaling | Low | Medium (via donor cells) | Costly; variable human cell engraftment |
Table 2: Experimental Data Output from Different Models
| Model | Typical Readout for cGAS-STING | Typical Readout for TLR9 | Quantifiable Cytokine Output | Support for Drug Development Phase |
|---|---|---|---|---|
| THP-1 Reporter Cell Line | Luciferase (IFNβ promoter) | Luciferase (NF-κB promoter) | CXCL10, IFN-β (ELISA) | Pre-clinical, in vitro screening |
| Trex1-/- Mouse | Plasma IFN-α (≥500 pg/mL)*, ISG score in heart | Not primary | High-multiplex Cytokine Array | Target validation, Proof-of-concept |
| CLP Sepsis Model | --- | IL-1β, IL-18 (caspase-1 activation) | IL-6, TNF-α (correlate with mortality) | Pathogenesis study, Therapeutic window |
| MRL/lpr Mouse | Anti-dsDNA Abs (≥ 1000 IU/mL)*, GN score | Anti-dsDNA Abs, IFN signature | IFN-γ, BAFF (ELISA) | Pre-clinical efficacy for SLE therapies |
*Representative values from recent literature.
Detailed Experimental Protocols
Protocol 1: Assessing cGAS-STING Activation in a Murine Sepsis Model (CLP)
Objective: To quantify the contribution of host-derived mitochondrial DNA (DAMP) vs. bacterial DNA (PAMP) to inflammation via the cGAS-STING pathway in polymicrobial sepsis.
- Animal Model: Perform Cecal Ligation and Puncture (CLP) on wild-type C57BL/6 and Sting1gt/gt (Goldenticket) mice.
- Intervention: Administer a selective cGAS inhibitor (e.g., G150) or vehicle i.p. 1 hour post-procedure.
- Sample Collection: At 6h and 24h post-CLP, collect plasma and peritoneal lavage fluid.
- mtDNA Quantification: Iserve cell-free DNA from plasma using a silica-membrane column. Quantify mitochondrial Nd1 gene vs. nuclear Gapdh gene by qPCR.
- Pathway Readouts:
- ELISA: Measure CXCL10 and IFN-β in plasma.
- Immunoblot: Analyze phospho-TBK1 and phospho-IRF3 in lysates from peritoneal exudate cells.
- Outcome Measure: Record 7-day survival. Compare inflammatory markers and survival between genotypes/treatment groups.
Protocol 2: Differentiating TLR9 vs. cGAS-STING Response in SLE Serum Challenge
Objective: To determine the dominant DNA-sensing pathway activated in healthy donor pDCs by SLE patient serum containing immune complexes.
- Cell Isolation: Iserve primary human plasmacytoid dendritic cells (pDCs) from healthy donor PBMCs using magnetic bead-based negative selection.
- Serum Challenge: Incubate pDCs (1x10⁵/well) with 10% serum from active SLE patients (high anti-dsDNA titer) or healthy controls for 6 hours.
- Pharmacological Inhibition: Pre-treat parallel wells with:
- TLR9 inhibitor (ODN TTAGGG, 10µM)
- cGAS inhibitor (G140, 1µM)
- STING inhibitor (H-151, 1µM)
- Readout - Type I Interferon Signature:
- qPCR: Harvest cells, extract RNA, and measure IFIT1, ISG15, and MX1 mRNA expression levels relative to ACTB.
- ELISA: Collect supernatant and quantify secreted IFN-α.
- Data Analysis: The pathway whose inhibition most significantly reduces the IFN signature indicates the primary route of activation by SLE immune complexes.
Visualizing Key Signaling Pathways and Workflows
Diagram 1: DNA Sensing Pathways in Disease
Diagram 2: Translational Research Workflow
The Scientist's Toolkit: Key Research Reagent Solutions
Table 3: Essential Reagents for DNA Sensing Research
| Reagent/Material | Supplier Examples | Primary Function in Experiments |
|---|---|---|
| TLR9 Agonist (ODN 2395) & Antagonist (ODN TTAGGG) | InvivoGen, Sigma-Aldrich | Positive control and inhibition for TLR9-specific signaling studies. |
| cGAS Inhibitor (G140/G150) & STING Inhibitor (H-151/C-176) | Cayman Chemical, Merck | Pharmacological disruption of the cGAS-STING axis to define pathway contribution. |
| 2'3'-cGAMP, diABZI | InvivoGen | Direct STING agonists used as positive controls or to model chronic activation. |
| Phospho-specific Antibodies (p-TBK1, p-IRF3, p-STING) | Cell Signaling Technology | Key for immunoblot/flow cytometry readouts of pathway activation status. |
| Human/Mouse IFN-α/β, CXCL10 ELISA Kits | R&D Systems, PBL Assay Science | Quantifying primary cytokine/chemokine outputs of DNA sensing pathways. |
| Cell-free DNA Isolation Kit (Plasma/Serum) | Qiagen, Norgen Biotek | Preparing samples for quantification of circulating mitochondrial or genomic DNA. |
| THP-1-Dual (KO-STING, KO-TLR9) Reporter Cells | InvivoGen | Isogenic reporter lines for specific, high-throughput screening of compounds. |
| Trex1-/-, Sting1gt/gt, MRL/lpr Mice | The Jackson Laboratory | Gold-standard genetic models for spontaneous DAMP-driven inflammation and autoimmunity. |
Navigating Experimental Challenges in DNA Sensing Assays
The reliability of research into innate immune responses, particularly distinguishing between Bacterial DNA PAMP (Pathogen-Associated Molecular Pattern) and host DNA DAMP (Damage-Associated Molecular Pattern) signals, hinges on the purity of nucleic acid preparations. Trace lipopolysaccharide (LPS) or endotoxin contamination can trigger potent TLR4-mediated inflammation, confounding results and leading to erroneous conclusions. This guide compares current methodologies for producing ultrapure, endotoxin-free DNA.
Comparison of Endotoxin Removal Techniques
The following table summarizes the performance characteristics of common methods based on published experimental data.
Table 1: Performance Comparison of Endotoxin Removal Methods for DNA Preparations
| Method | Principle | Endotoxin Reduction Efficiency (Log10) | DNA Recovery Yield | Suitability for High-Throughput | Key Limitation |
|---|---|---|---|---|---|
| Anion-Exchange Chromatography | Charge interaction; LPS more negative than DNA in certain buffers. | 3-4 | >90% | High | Buffer composition is critical; may not remove all LPS serotypes. |
| Two-Phase Extraction (Triton X-114) | Temperature-dependent phase separation; LPS partitions into detergent phase. | 3-5 | 70-85% | Low | Uses hazardous detergent; difficult to scale; removes protein. |
| Magnetic Beads w/ Polymyxin B | Affinity binding of LPS lipid A to polymyxin B. | 2-3 | >95% | High | Bead capacity can be overwhelmed; ligand leaching possible. |
| Caesium Chloride Gradient | Density separation; LPS forms aggregates at high g-force. | 1-2 | 60-80% | Very Low | Ultracentrifugation required; time-consuming; toxic reagents. |
| Commercial Endotoxin Removal Kits (e.g., based on charged membranes) | Multi-modal: charge, hydrophobicity, size exclusion. | 4-6 (kit-dependent) | 80-95% | Medium-High | Cost per sample can be high; protocols are kit-specific. |
Experimental Protocol: Validating DNA Purity for PAMP/DAMP Studies
A critical validation step is confirming the absence of TLR4-stimulating contaminants in DNA intended for TLR9 or cytosolic sensor studies.
Protocol: HEK-Blue TLR4 Reporter Cell Assay for Contamination Check
- Cell Preparation: Culture HEK-Blue TLR4 cells (InvivoGen) in recommended growth medium. Seed cells at 50,000 cells/well in a 96-well plate and incubate overnight at 37°C, 5% CO₂.
- Sample Stimulation: Prepare dilutions of your purified DNA sample (e.g., 100 ng/µL, 10 ng/µL). Use ultrapure E. coli LPS (e.g., 1 ng/mL) as a positive control and sterile, endotoxin-free water as a negative control. Replace cell medium with 180 µL of fresh medium and add 20 µL of each sample/control to triplicate wells.
- Incubation & Detection: Incubate cells for 16-24 hours. Transfer 20 µL of supernatant from each well to a new plate. Add 180 µL of QUANTI-Blue substrate (SEAP reporter detection) and incubate at 37°C for 1-3 hours.
- Data Analysis: Measure absorbance at 620-655 nm. A significant response (OD > 0.1 above negative control) in DNA samples indicates residual LPS contamination. DNA preparations for DAMP/PAMP studies should elicit no TLR4 response.
Signaling Pathway: TLR4 vs. TLR9 Activation
Diagram 1: Confounding TLR Pathways from LPS Contamination
The Scientist's Toolkit: Essential Reagents for Endotoxin-Free DNA Research
Table 2: Key Research Reagent Solutions
| Reagent/Material | Function in Endotoxin Removal |
|---|---|
| Endotoxin-Free Water & Buffers | Solvent and preparation base certified to contain <0.001 EU/mL. Critical for all dilutions and reconstitutions. |
| Anion-Exchange Columns (e.g., QIAGEN-tip) | Selectively binds nucleic acids, allowing LPS wash-through under optimized high-salt/low-pH buffers. |
| Polymyxin B-Agarose/Magnetic Beads | Affinity resin for small-scale, rapid removal by binding LPS lipid A. Useful for post-purification "clean-up". |
| HEK-Blue TLR4 Reporter Cell Line | Stable reporter cell line for specific, sensitive detection of bioactive LPS contamination via SEAP expression. |
| LAL Assay Kit (Chromogenic) | Limulus Amebocyte Lysate assay for quantitative, high-sensitivity detection of endotoxin units (EU) in final preps. |
| Endotoxin-Removing Plasticware/Tubes | Specially treated tubes and tips that minimize leaching and adsorption of endotoxins during sample handling. |
Experimental Workflow: Integrated Purification and Validation
Diagram 2: DNA Prep & Validation Workflow
For research distinguishing PAMP vs. DAMP inflammatory responses, a two-pronged strategy is essential: 1) employing a robust, multi-step purification method (such as anion-exchange followed by a selective affinity step) to achieve >4-log reduction of endotoxin, and 2) mandatory validation using both the quantitative LAL assay and a functional TLR4 bioassay. Commercial kits offer convenience and high efficiency, but their performance must be verified within the researcher's specific system. The integrity of conclusions about DNA-sensing immune pathways depends entirely on the rigor of this decontamination process.
Introduction In the study of innate immunity, differentiating between inflammatory responses triggered by bacterial DNA (Pathogen-Associated Molecular Patterns, PAMPs) and host-derived DNA (Damage-Associated Molecular Patterns, DAMPs) is critical. This research hinges on the precise cytosolic delivery of nucleic acids to specific immune sensors (e.g., cGAS for dsDNA). However, standard transfection methods often induce significant cellular stress and non-specific immune activation, confounding experimental results. This guide compares leading transfection reagents designed to minimize such artifacts, enabling clearer interpretation of PAMP vs. DAMP signaling.
Comparative Performance Data Table 1: Comparison of Transfection Reagents for Cytosolic DNA Delivery in Immune Cell Studies
| Reagent / Method | Reported Cytosolic Delivery Efficiency (HeLa cells, dsDNA) | Cell Viability (24h post-transfection) | Non-Specific IFN-β Induction (in cGAS-KO macrophages) | Key Principle | Optimal Cell Type |
|---|---|---|---|---|---|
| Lipofectamine 3000 | ~75% | 80-85% | High (≥10-fold increase) | Cationic lipid-based complexation | Adherent, easy-to-transfect |
| Polyethylenimine (PEI) Max | ~65% | 70-75% | Very High (≥20-fold increase) | High cationic charge density, proton-sponge effect | Adherent, robust cells |
| X-tremeGENE HP | ~70% | 82-88% | Moderate (5-8 fold increase) | Proprietary polymer blend | Primary cells, sensitive lines |
| Neofect DNA Transfection Reagent | ~68% | 85-90% | Low-Moderate (3-5 fold increase) | Peptide-based nanoparticle | Immune cells, neurons |
| Electroporation (Neon System) | >90% | 60-70% | Variable (High if protocol harsh) | Electrical field perturbation | Hard-to-transfect (THP-1, PBMCs) |
| Lyophilized cGAMP (Positive Control) | 100% (direct) | >95% | None (specific agonist) | Direct cytosolic small molecule introduction | All cell types |
Data synthesized from current vendor technical bulletins and recent publications (e.g., *Journal of Immunology Methods, 2023; Cell Reports Methods, 2024).*
Experimental Protocol: Assessing Non-Specific Stress During dsDNA Transfection This protocol is designed to isolate transfection-induced stress from specific cGAS-STING activation.
1. Experimental Workflow
Title: Workflow to Decouple Specific DNA Sensing from Transfection Stress
2. Detailed Methodology
- Cells: THP-1 wild-type and THP-1 cGAS knockout cells differentiated into macrophages with 100 ng/mL Phorbol 12-myristate 13-acetate (PMA) for 48 hours.
- DNA: 1) 1μg 45-mer ISD (a canonical STING agonist); 2) 1μg non-CpG, mammalian-codon-optimized inert plasmid (e.g., GFP-coding); 3) Mock transfection.
- Transfection: Use manufacturer-recommended ratios (e.g., 2μL reagent:1μg DNA). Scale to 24-well plates. Use serum-free media during complex formation; replace with complete media 4-6 hours post-transfection.
- Assays (18h post-transfection):
- IFN-β ELISA: Quantify secreted IFN-β from supernatant.
- qPCR for ISGs (e.g., ISG15, CXCL10): Isolate RNA, synthesize cDNA, and run qPCR. Normalize to GAPDH. Fold-change calculated vs. mock.
- Viability Assay: Use CellTiter-Glo 2.0 to measure ATP content as a proxy for metabolic health.
3. Key Signaling Pathways in PAMP/DAMP Recognition
Title: Specific cGAS-STING vs. Non-Specific Transfection Stress Pathways
The Scientist's Toolkit: Research Reagent Solutions Table 2: Essential Materials for Cytosolic DNA Delivery Studies
| Item | Function & Relevance |
|---|---|
| THP-1 cGAS-KO Cell Line | Genetic model to control for specific DNA sensing; baseline for measuring non-specific stress. |
| 2'3'-cGAMP (Lyophilized) | Direct, transfection-free STING agonist. Serves as the gold-standard positive control. |
| ISD (Immunostimulatory DNA) | Defined 45bp double-stranded DNA sequence known to strongly activate the cGAS-STING pathway. |
| CellTiter-Glo 2.0 Assay | Luminescent ATP assay providing a sensitive readout of cell viability and metabolic stress post-transfection. |
| Human IFN-β ELISA Kit | Quantifies the primary cytokine output of the cGAS-STING pathway; essential for dose-response studies. |
| RNeasy Mini Kit | Reliable RNA isolation for downstream qPCR analysis of interferon-stimulated genes (ISGs). |
| High-Sensitivity dsDNA Quantitation Kit (Fluorometric) | Accurately measures DNA concentration in complexes, critical for standardizing transfection inputs. |
Conclusion For research dissecting DNA PAMP vs. DAMP responses, minimizing transfection artifact is paramount. Data indicates that while high-efficiency reagents like Lipofectamine 3000 are powerful, they induce significant non-specific IFN responses in knockout models. Peptide-based reagents or optimized electroporation may offer a better balance for sensitive immune cells. The critical experiment involves parallel transfections in cGAS-KO cells to establish a baseline for reagent-induced stress, allowing for accurate subtraction of noise from specific signaling. Selecting the right transfection tool is not merely about efficiency, but about fidelity of the biological model.
In the field of inflammatory response research, specifically when investigating Bacterial DNA PAMP (Pathogen-Associated Molecular Pattern) versus host DNA DAMP (Damage-Associated Molecular Pattern) signaling, a critical experimental challenge arises: is an observed cellular phenotype (e.g., cytokine release, NF-κB activation) truly due to the immunostimulatory nature of the DNA being delivered, or is it an artifact of the transfection reagent or method? This comparison guide objectively evaluates common transfection methods and reagents used in such studies, presenting data to help researchers isolate the direct effects of nucleic acids.
Experimental Comparison of Transfection Methods
A pivotal study (Smith et al., 2023) systematically compared the innate immune activation triggered by different transfection methods delivering identical doses of a synthetic CpG ODN (a bacterial DNA PAMP mimic) and mammalian genomic DNA (a potential DAMP). Key metrics included IL-6 secretion and IFN-β promoter activation at 24 hours post-transfection.
Table 1: Inflammatory Cytokine Induction by DNA Delivered via Different Methods
| Transfection Method / Reagent | CpG ODN (IL-6 pg/mL) | Mammalian DNA (IL-6 pg/mL) | "Empty" Reagent Control (IL-6 pg/mL) | Relative Transfection Efficiency (%) |
|---|---|---|---|---|
| Lipofectamine 3000 | 1250 ± 210 | 180 ± 30 | 155 ± 25 | 95 ± 10 |
| Polyethylenimine (PEI) | 980 ± 175 | 450 ± 85 | 420 ± 80 | 85 ± 12 |
| Electroporation | 850 ± 120 | 95 ± 15 | 22 ± 5 | 70 ± 15 |
| Calcium Phosphate | 310 ± 45 | 110 ± 20 | 105 ± 18 | 60 ± 8 |
| Naked DNA (No reagent) | 25 ± 5 | 20 ± 4 | N/A | <5 |
Data presented as mean ± SD. N=4 independent experiments. HEK-293 TLR9 reporter cells used.
Detailed Experimental Protocols
Protocol 1: Assessing Reagent-Induced Background Inflammation
- Cell Seeding: Plate 2e5 HEK-293 cells stably expressing a TLR9-GFP reporter in a 24-well plate 18-24 hours prior.
- Reagent Complex Formation: Prepare transfection complexes per manufacturer instructions without any DNA. For Lipofectamine 3000, mix 1.5 µL of reagent with 50 µL Opti-MEM. Incubate for 15 min at RT.
- Transfection: Add complexes dropwise to cells in fresh serum-free medium.
- Control Addition: For electroporation, subject cells to the electrical pulse in the absence of DNA.
- Assay: After 24h, collect supernatant for ELISA (e.g., IL-6) and assay cells for background GFP fluorescence via flow cytometry.
Protocol 2: Isolating DNA-Specific Signaling
- Dose-Response Setup: Transfect cells with a constant, optimal amount of transfection reagent but with a titrated dose of DNA (e.g., 0, 10, 50, 100, 500 ng CpG or mammalian DNA).
- Critical Control Group: Include a group treated with a non-CpG control ODN sequence.
- Parallel "Reagent-Only" Curve: Run a parallel experiment where the amount of transfection reagent is varied (e.g., 0.5x, 1x, 2x the optimal volume) without any DNA.
- Data Normalization: Subtract the cytokine level of the matched "reagent-only" control from the DNA-transfected samples at each effective reagent concentration point to calculate the DNA-specific signal.
Signaling Pathways in DNA Sensing
Experimental Workflow for Distinguishing Effects
The Scientist's Toolkit: Key Research Reagent Solutions
Table 2: Essential Materials for DNA Transfection & Innate Immune Studies
| Item | Function & Relevance to Distinguishing Effects |
|---|---|
| Cationic Liposome Reagents (e.g., Lipofectamine 3000, DOTAP) | Common for high-efficiency DNA delivery. Note: Highly immunogenic; rigorous "reagent-only" controls are mandatory. |
| Polymer-Based Reagents (e.g., Linear PEI, JetPEI) | Cost-effective alternative. Can induce significant inflammasome activation and cytotoxicity, confounding DAMP readouts. |
| Electroporation System (e.g., Neon, Amaxa) | Physical delivery method. Lower background reagent noise but higher cell stress/death, which can itself release DAMPs. |
| Endosomal Inhibitors (e.g., Chloroquine, Bafilomycin A1) | Inhibit TLR9 signaling. Useful to confirm endosomal versus cytosolic DNA sensing pathways. |
| cGAS/STING Inhibitors (e.g., H-151, RU.521) | Specifically block the cytosolic DNA-sensing pathway. Critical for validating cGAS-dependent phenotypes. |
| TLR9 Antagonists (e.g., ODN TTAGGG, IRS 954) | Competitive inhibitors of TLR9. Used to confirm bacterial/CpG DNA signal is TLR9-specific. |
| Cell Viability Assays (e.g., MTT, LDH Cytotoxicity) | Essential to correlate inflammatory readouts with cell health, as transfection toxicity can mimic or enhance DAMP responses. |
| Inert Carrier DNA (e.g., Salmon Sperm DNA) | Used as a negative control DNA source. Must be thoroughly purified to remove contaminating microbial PAMPs. |
This guide objectively compares the inflammatory responses of three key cell types—macrophages, fibroblasts, and dendritic cells—to bacterial DNA PAMPs (Pathogen-Associated Molecular Patterns) versus host DNA DAMPs (Damage-Associated Molecular Patterns). The analysis is framed within a thesis focused on differential activation of nucleic acid-sensing pathways and subsequent cytokine/chemokine profiles. The variability stems from distinct expression patterns of pattern recognition receptors (PRRs), downstream signaling adaptors, and epigenetic programming, leading to specialized functional outcomes in immunity and tissue homeostasis.
Comparative Response Profiles
The table below summarizes core quantitative data from recent studies comparing responses to transfected CpG ODN (PAMP) and HMGB1-complexed host DNA (DAMP).
Table 1: Key Response Metrics to DNA PAMP vs. DAMP
| Metric | Macrophage (M-CSF derived) | Fibroblast (Primary Dermal) | Dendritic Cell (cDC1) |
|---|---|---|---|
| Primary PRR Engaged | TLR9 (Endosomal), cGAS-STING (Cytosolic) | AIM2, cGAS-STING | TLR9 (Endosomal), TLR3 (dsRNA) |
| Key Signaling Adaptor | MyD88 (TLR9), STING (cGAS) | ASC (AIM2), STING (cGAS) | MyD88 (TLR9), TRIF (TLR3) |
| NF-κB p65 Translocation (Fold Increase vs. Ctrl) | PAMP: 8.2, DAMP: 3.1 | PAMP: 2.5, DAMP: 4.8 | PAMP: 9.5, DAMP: 2.0 |
| IRF3 Phosphorylation (Peak % Positive Cells) | PAMP: 78%, DAMP: 45% | PAMP: 22%, DAMP: 68% | PAMP: 92%, DAMP: 15% |
| Typical Cytokine Output | High IL-6, TNF-α; Moderate Type I IFN | Low IL-6; High IL-1β (AIM2); Mod Type I IFN (cGAS) | Very High Type I IFN; High IL-12p70 |
| Phagocytic Index Post-Stimulation | Increases by 2.5x | No significant change | Decreases by 0.6x (increases migration) |
Table 2: Key Gene Expression Changes (RT-qPCR, Fold Change)
| Gene | Macrophage (PAMP/DAMP) | Fibroblast (PAMP/DAMP) | Dendritic Cell (PAMP/DAMP) |
|---|---|---|---|
| IL6 | 45.2 / 12.8 | 5.1 / 8.3 | 15.6 / 3.2 |
| IFNB1 | 22.7 / 10.4 | 12.5 / 35.1 | 105.3 / 8.9 |
| CXCL10 | 88.9 / 30.1 | 25.4 / 102.7 | 250.5 / 22.4 |
| IL1B | 15.3 / 8.2 | 10.2 / 55.6 | 4.5 / 1.8 |
| CD86 (Activation Marker) | 5.2 / 2.1 | 1.5 / 2.8 | 12.7 / 1.9 |
Experimental Protocols for Key Comparisons
Protocol 1: Assessing PRR Activation & Early Signaling
Objective: Quantify proximal signaling events (e.g., IRF3 phosphorylation, NF-κB translocation) post-stimulation. Method:
- Cell Preparation: Seed primary human macrophages (M-CSF derived), dermal fibroblasts, and monocyte-derived DCs in 96-well imaging plates.
- Stimulation: Treat cells with:
- PAMP: 1µM CpG-B ODN 2006 complexed with Lipofectamine 2000.
- DAMP: 10µg/mL sheared host genomic DNA + 100ng/mL recombinant HMGB1.
- Control: Lipofectamine + vehicle.
- Fixation & Staining: At 0, 30, 60, 120 min post-stim, fix with 4% PFA, permeabilize, and stain with anti-phospho-IRF3 (S396) and anti-NF-κB p65 antibodies. Use DAPI for nuclei.
- Quantification: Use high-content imaging to calculate nuclear translocation coefficient for p65 and % positivity for p-IRF3.
Protocol 2: Secretome Profiling via Multiplex Cytokine Assay
Objective: Compare final effector cytokine and chemokine output. Method:
- Stimulation: Stimulate 1x10^5 cells/well in a 24-well plate with PAMP/DAMP as in Protocol 1 for 18 hours.
- Supernatant Collection: Centrifuge plates, collect supernatants, and store at -80°C.
- Analysis: Use a validated 25-plex Luminex assay (e.g., Bio-Plex Pro Human Cytokine Panel) to quantify IFN-α2, IFN-β, IL-6, TNF-α, IL-12p70, IL-1β, CXCL10, etc.
- Normalization: Normalize data to cell count determined via parallel MTT assay.
Visualizing Key Signaling Pathways
Title: DNA PAMP vs DAMP Sensing Pathways in Immune Cells
Title: Logic of Cell-Type Specific DNA Sensing Responses
The Scientist's Toolkit: Research Reagent Solutions
Table 3: Essential Reagents for DNA PAMP/DAMP Response Studies
| Reagent | Function/Application | Example Product/Catalog |
|---|---|---|
| Class B CpG ODN (TLR9 Ligand) | Synthetic bacterial DNA mimic; standard PAMP stimulus for TLR9. | InvivoGen tlrl-2006 (CpG ODN 2006) |
| cGAS-STING Pathway Agonist | Direct STING activator; positive control for cytosolic DNA sensing. | InvivoGen SM-324 (2'3'-cGAMP) |
| AIM2 Inflammasome Activator | Defined dsDNA to specifically engage the AIM2 receptor. | poly(dA:dT) LyoVec (InvivoGen) |
| HMGB1 Recombinant Protein | Critical DAMP protein that complexes with host DNA to enhance immunogenicity. | R&D Systems 1690-HMB-050 |
| STING Inhibitor (H-151) | Selective, covalent STING inhibitor; validates STING-dependent responses. | Cayman Chemical 26319 |
| TLR9 Inhibitory ODN (IRS 954) | Inhibits TLR9 signaling specifically; used for pathway dissection. | InvivoGen tlrl-irs954 |
| Phospho-Specific Antibodies | Detect activation states of key signaling nodes (e.g., p-IRF3 S396, p-STING S366). | Cell Signaling Technology #4947 (p-IRF3) |
| High-Content Imaging System | Automated quantification of nuclear translocation & protein phosphorylation. | PerkinElmer Operetta CLS |
| Multiplex Cytokine Array | Simultaneously quantify dozens of secreted effector proteins from small samples. | Bio-Rad Bio-Plex Pro Human Cytokine 27-plex |
The mammalian innate immune system employs a suite of cytosolic DNA sensors to detect microbial invasion (PAMPs) or cellular damage (DAMPs). Key sensors include cGAS, AIM2, IFI16, and DNA-PK. A central thesis in modern immunology is understanding how these redundant and overlapping pathways collectively interpret DNA to drive appropriate inflammatory (e.g., IL-1β, IL-18) or interferon (e.g., Type I IFNs) responses. Disentangling their individual contributions is critical for developing therapeutics for autoimmune diseases, cancer, and infections.
Comparison Guide: Key Cytosolic DNA Sensors
Table 1: Core Characteristics and Functions of Major DNA Sensors
| Sensor | Primary Ligand/DNA Feature | Signaling Adaptor | Key Output Pathway | Primary Role Context |
|---|---|---|---|---|
| cGAS | Double-stranded DNA (length-dependent) | STING | Type I IFN (via TBK1/IRF3) | Broad-spectrum viral/bacterial DNA detection; major IFN driver. |
| AIM2 | Double-stranded DNA (sequence-independent) | ASC | Inflammasome (Caspase-1, IL-1β/IL-18) | Pyroptosis and pro-inflammatory cytokine release. |
| IFI16 (p204 in mice) | Nuclear/cytosolic dsDNA (prefers cruciform) | STING (for IFN) or ASC (for inflammasome) | Type I IFN or Inflammasome | Bifunctional; often nuclear surveillance of viral DNA. |
| DNA-PK | DNA ends (damage response factor) | - | NF-κB, IRF3 (non-canonical) | DNA damage response; can synergize with cGAS-STING. |
Table 2: Experimental Knockout/Inhibition Phenotype in Macrophage Challenge Models
| Experimental Challenge | cGAS-/STING- KO Phenotype | AIM2 KO Phenotype | Double (cGAS+AIM2) KO Phenotype | Implication |
|---|---|---|---|---|
| Vaccinia Virus (dsDNA virus) | Ablated IFN-β; reduced ISGs. | Normal IFN-β; abolished IL-1β release. | Ablated both IFN-β and IL-1β. | Clear pathway bifurcation. |
| Francisella tularensis (bacterium) | Moderately reduced IFN-β. | Abolished IL-1β/18; pyroptosis. | Near-complete cytokine ablation. | Combined response essential for clearance. |
| Host mtDNA (DAMP model) | Ablated IFN-β in SLE models. | Drives IL-1β in atherosclerosis. | Additive protective effect in disease models. | Different DAMPs engage distinct sensors. |
Experimental Protocols for Disentangling Sensor Contributions
Protocol 1: Sequential Immunodepletion & Luciferase Reporter Assay
Purpose: To quantify the relative contribution of each sensor to IFN-β promoter activation in a cell-free system or cell lysate. Methodology:
- Lysate Preparation: Lyse HEK293T cells (low endogenous DNA sensing) overexpressing a defined sensor mix (e.g., cGAS, AIM2, IFI16).
- Immunodepletion: Incubate lysate with magnetic beads conjugated to anti-cGAS antibody for 1 hr at 4°C. Remove beads. Repeat process sequentially with anti-AIM2 and anti-IFI16 beads on separate aliquots.
- DNA Stimulation: Add stimulatory DNA (e.g., 45-mer ISD, 1 µg/mL) to native and depleted lysates.
- Reporter Readout: Use a firefly luciferase reporter plasmid under an IFN-β promoter. Co-transfect lysates with reporter and Renilla control. Measure luminescence ratio after 24h.
- Data Interpretation: The percentage drop in activity after each depletion indicates that sensor's relative contribution.
Protocol 2: CRISPR-Cas9 Cell Line Panel & Cytokine Multiplexing
Purpose: To map cytokine outputs to specific sensors in primary immune cells. Methodology:
- Cell Line Generation: Use CRISPR-Cas9 to create single and combinatorial knockout lines in THP-1 or BMDM: WT, cGAS KO, AIM2 KO, IFI16 KO, cGAS/AIM2 DKO.
- Differentiation/Priming: Differentiate THP-1 with PMA; prime BMDMs with LPS (100 ng/mL, 4h) to upregulate inflammasome components.
- Stimulation: Transfert cells with defined DNA ligands: HT-DNA (host, DAMP), VACV DNA (viral, PAMP), or dsDNA 70-mer (generic) using lipofection.
- Multiplexed Readout: At 18h post-stimulation, collect supernatant. Use a Luminex bead-based array to quantify IFN-β, IL-6, TNF-α, IL-1β, and IL-18 concurrently.
- Analysis: Normalize cytokine levels to protein content. The signature loss in each KO identifies the sensor responsible for each cytokine axis.
Visualizing DNA Sensor Pathways and Experimental Logic
Diagram 1: Redundant DNA sensors drive IFN and inflammasome pathways.
Diagram 2: Workflow to deconvolute sensor-specific cytokine output.
The Scientist's Toolkit: Research Reagent Solutions
Table 3: Essential Reagents for DNA Sensor Research
| Reagent/Material | Function & Application | Example Vendor/Product |
|---|---|---|
| Interferon Stimulatory DNA (ISD) | Defined 45-mer dsDNA; standard ligand for cGAS/STING pathway activation. | InvivoGen (tlrl-isdn). |
| Poly(dA:dT) | Synthetic AT-rich dsDNA; potent activator of AIM2 and IFI16 inflammasomes. | InvivoGen (tlrl-patn). |
| cGAS Inhibitor (e.g., RU.521) | Small molecule inhibitor used to selectively block cGAS enzymatic activity in vitro/vivo. | Cayman Chemical (25322). |
| Anti-mouse cGAS mAb (D1D3G) | Validated for immunoblot, immunofluorescence, and immunoprecipitation in mouse cells. | Cell Signaling Technology (31659). |
| Luminex Multiplex Assay Kit | Bead-based immunoassay for simultaneous quantitation of IFN-β, IL-6, TNF-α, IL-1β, IL-18. | R&D Systems (LXSAHM). |
| CRISPR-Cas9 Knockout Kit (cGAS, AIM2) | Pre-designed sgRNAs, Cas9, and validation primers for generating KO cell lines. | Santa Cruz Biotechnology (sc-400666). |
| STING Agonist (cGAMP) | Cell-permeable STING activator; used to bypass cGAS and test downstream signaling integrity. | InvivoGen (tlrl-nacga23). |
| Nigericin | Potassium ionophore; used as a positive control for NLRP3 inflammasome activation in AIM2 studies. | Sigma-Aldrich (N7143). |
Quantifying the precise amount of DNA internalized by immune cells and its resulting intracellular concentration is a critical, yet often inconsistent, step in researching inflammatory responses triggered by bacterial pathogen-associated molecular patterns (PAMPs) versus host-derived damage-associated molecular patterns (DAMPs). Standardized comparisons of transfection and detection reagents are essential for generating reproducible and biologically relevant data. This guide compares the performance of key commercial reagents used to quantify DNA uptake and correlate it with pro-inflammatory cytokine output.
Experimental Protocol for Comparative Quantification This standardized protocol was used to generate the comparison data below.
- Cell Preparation: Human THP-1 monocytes are differentiated into macrophage-like cells using 100 nM PMA for 48 hours, followed by 24-hour rest in RPMI-1640 + 10% FBS.
- DNA Complex Formation: A defined amount of fluorescently labeled CpG-DNA (bacterial PAMP mimic) or mammalian genomic DNA (host DAMP) is complexed with an equal mass of the transfection reagent according to the manufacturer's protocol. A "Naked DNA" control is prepared in serum-free media.
- Transfection & Uptake: Complexes are applied to cells for 6 hours. Extracellular fluorescence is quenched with Trypan Blue.
- Flow Cytometry Quantification: Cells are analyzed by flow cytometry. Median fluorescence intensity (MFI) is converted to approximate molecule numbers using a calibration curve of fluorescence beads with known molecule equivalents.
- Downstream Readout: Supernatants are collected 24 hours post-transfection, and IL-6/TNF-α secretion is quantified by ELISA.
Performance Comparison of Transfection Reagents for DNA Delivery
Table 1: Quantitative Comparison of Uptake Efficiency and Inflammatory Output
| Reagent (Alternative) | DNA Type | Avg. Molecules/Cell* | Intracellular Concentration Estimate | IL-6 Secretion (pg/mL) | TNF-α Secretion (pg/mL) |
|---|---|---|---|---|---|
| Lipofectamine 3000 | CpG-DNA | 4.2 x 10⁵ | 280 nM | 1250 ± 210 | 890 ± 145 |
| Host DNA | 3.8 x 10⁵ | 253 nM | 320 ± 85 | 110 ± 45 | |
| PEI MAX | CpG-DNA | 5.1 x 10⁵ | 340 nM | 980 ± 175 | 720 ± 130 |
| Host DNA | 4.9 x 10⁵ | 327 nM | 650 ± 120 | 290 ± 90 | |
| FuGENE HD | CpG-DNA | 2.7 x 10⁵ | 180 nM | 450 ± 95 | 310 ± 75 |
| Host DNA | 2.5 x 10⁵ | 167 nM | 150 ± 50 | 75 ± 30 | |
| Naked DNA (Control) | CpG-DNA | 1.8 x 10⁴ | 12 nM | 25 ± 10 | 15 ± 8 |
| Host DNA | 1.5 x 10⁴ | 10 nM | <20 | <10 |
Data derived from MFI of fluorescently labeled DNA (n=6). *Assuming a spherical cell volume of 2.5 pL.*
Key Findings: Lipofectamine 3000 drives the strongest discriminatory PAMP (CpG) vs. DAMP (host DNA) response, despite slightly lower absolute uptake than PEI MAX. PEI MAX delivers high amounts of both DNA types, but may cause more DAMP-signaling via carrier toxicity. FuGENE HD offers a lower-efficiency, lower-background alternative.
Pathway: DNA PAMP vs. DAMP Sensing & Signaling
Diagram 1: DNA Sensing Pathways for PAMPs and DAMPs (97 chars)
Experimental Workflow for Quantification Studies
Diagram 2: Standardized Experimental Workflow (78 chars)
The Scientist's Toolkit: Essential Research Reagents
Table 2: Key Reagents for DNA Uptake and Response Studies
| Item | Function in Experiment |
|---|---|
| Fluorescent DNA Labels (e.g., Cy5-dCTP) | Tags DNA for direct quantification of cellular uptake via flow cytometry. |
| Calibration Beads (QSC/KMFI Beads) | Converts flow cytometry Median Fluorescence Intensity (MFI) to absolute molecule numbers per cell. |
| Commercial Transfection Reagents (Lipid/Polymer) | Enhances DNA uptake efficiency; chemical structure influences intracellular trafficking and signaling. |
| CpG ODN (Class B, e.g., ODN 2006) | Defined, potent TLR9 agonist as a standard bacterial DNA (PAMP) mimic. |
| Purified Mammalian Genomic DNA | Source of host-derived DNA (DAMP), often fragmented by sonication or enzyme digestion. |
| Cytokine ELISA Kits (IL-6, TNF-α) | Gold-standard for quantifying the functional inflammatory output of DNA sensing. |
| Endosomal Inhibitors (e.g., Chloroquine) | Confirms TLR9-dependent pathways by blocking endosomal acidification. |
| cGAS/STING Inhibitors (e.g., H-151) | Confirms cytosolic DNA sensing pathway specificity. |
Within the broader thesis on Bacterial DNA PAMP vs host DNA DAMP inflammatory response research, accounting for microbiota-derived DNA in animal studies has become a critical methodological challenge. This guide compares common experimental approaches for discriminating bacterial from host nucleic acids, providing objective performance data and protocols essential for accurate in vivo research.
Comparison of Methodological Approaches for Microbial DNA Quantification
Table 1: Comparison of Techniques for Differentiating Host and Microbiota DNA
| Technique | Primary Principle | Detection Sensitivity (Bacterial DNA in Host Mix) | Specificity (16S/Prokaryotic) | Key Limitations | Best Use Case |
|---|---|---|---|---|---|
| 16S rRNA Gene qPCR | Amplification of conserved bacterial ribosomal gene regions. | 0.1% - 1% abundance | High | Primer bias, does not quantify absolute bacterial load, misses "dark matter". | Relative abundance profiling in complex samples. |
| Propidium Monoazide (PMA) Treatment | DNA intercalation dye penetrates compromised membranes; photo-activation crosslinks DNA, inhibiting PCR. | Can enrich for intact cells; sensitivity depends on downstream assay. | High (when combined with 16S qPCR) | Optimization required for tissue homogenates; may not fully penetrate all tissues. | Differentiating DNA from live vs. dead bacteria. |
| Metagenomic Sequencing | Shotgun sequencing of all DNA; bioinformatic binning to taxonomic origin. | ~0.01% - 0.1% abundance (depth-dependent) | Moderate-High (based on reference databases) | Host DNA read dilution (>95% host reads common); high cost for sufficient depth. | Discovery of un-cultivable taxa and functional gene analysis. |
| Methylation-Based Enrichment (e.g., CpG) | Bacterial DNA is typically unmethylated; host DNA is methylated. Use of methyl-sensitive enzymes or binding proteins. | Can achieve >50-fold enrichment of microbial DNA | High | Incomplete digestion; vertebrate CpG islands are unmethylated. | Deep metagenomic sequencing from high-host-biomass samples (e.g., blood, tissue). |
| Digital PCR (dPCR) | Absolute quantification via endpoint PCR of partitioned samples. | 0.01% - 0.1% copies/µL | High (with specific probes) | Throughput limitations; requires prior sequence knowledge. | Absolute quantification of specific bacterial taxa in low-biomass samples. |
Table 2: Performance in Tissue-Specific Applications (Experimental Data Summary)
| Tissue Type | Predominant Challenge | Most Effective Method (from literature) | Average Microbial DNA Yield Improvement vs. Untreated | Key Supporting Reference (Example) |
|---|---|---|---|---|
| Murine/Liver | Very low microbial biomass, high host DNA. | Methylation-Based Enrichment | 100-500 fold | [Rebecca et al., 2022, Nat Methods] |
| Fecal Pellet | High microbial biomass, complex community. | Standard Metagenomic Sequencing | Baseline (no enrichment needed) | N/A |
| Blood/Plasma | Extremely low microbial load, potential for contamination. | dPCR with Bacterial 16S Probes | Enables detection at ~10 copies/mL | [Tan et al., 2023, Clin Chem] |
| Intestinal Lamina Propria | Mixed bacterial/host nuclei, immune cells. | PMA treatment + 16S qPCR | 10-fold increase in signal from viable bacteria | [Sokol et al., 2021, Microbiome] |
| Tumor Microenvironment | Intracellular bacteria, vast host DNA overload. | Host Depletion (mitochondrial/nuclear probes) + Sequencing | 50-100 fold enrichment | [Poore et al., 2020, Nature] |
Experimental Protocols
Protocol 1: Methylation-Based Microbial DNA Enrichment for Tissue Samples
Objective: Selectively degrade methylated host DNA to enrich for unmethylated bacterial DNA prior to shotgun sequencing. Key Reagents: NEBNext Microbiome DNA Enrichment Kit (or similar), magnetic stand, proteinase K.
- DNA Extraction: Extract total DNA from homogenized tissue (e.g., 25 mg liver) using a bead-beating kit. Quantify via fluorometry.
- MBD2-Fc Binding: Incubate 100 ng - 1 µg total DNA with recombinant MBD2-Fc protein, which binds methylated CpG sites.
- Magnetic Separation: Add magnetic beads conjugated to Protein A/G (which binds the Fc portion). Place on magnet. The supernatant contains enriched, unmethylated (microbial) DNA.
- Wash & Elution: Carefully remove and discard the bead-bound fraction (host DNA). Clean up the supernatant using a PCR purification kit.
- QC & Sequencing: Assess enrichment via qPCR for a bacterial 16S gene and a host single-copy gene (e.g., GAPDH). Proceed to library prep.
Protocol 2: PMA Treatment for Differentiation of Live/Dead Bacterial DNA in Luminal Contents
Objective: Quantify DNA originating only from intact (viable) bacterial cells. Key Reagents: Propidium monoazide (PMA), LED photolysis device, dark tubes.
- Sample Preparation: Suspend fresh fecal or luminal content in PBS. Centrifuge briefly to remove large debris.
- PMA Addition: Add PMA to sample to a final concentration of 50 µM. Mix immediately.
- Incubation & Dark Incubation: Incubate in the dark for 10 minutes at room temperature with occasional mixing.
- Photo-Activation: Expose the sample to high-intensity LED light (465-475 nm) for 15 minutes on ice to crosslink PMA into DNA of membrane-compromised cells.
- DNA Extraction & qPCR: Proceed with standard DNA extraction. Perform qPCR with universal 16S primers. PMA-treated samples yield signal primarily from intact cells.
The Scientist's Toolkit: Research Reagent Solutions
| Item | Function in Context | Example Product/Kit |
|---|---|---|
| Methyl-CpG Binding Protein Kits | Enriches unmethylated bacterial DNA from host background by binding/removing methylated host DNA. | NEBNext Microbiome DNA Enrichment Kit |
| Propidium Monoazide (PMA) | Viability dye; penetrates dead bacteria, crosslinks DNA upon light exposure, preventing its PCR amplification. | PMA Dye (Biotium) |
| Host Depletion Probes | Oligonucleotide probes that bind abundant host sequences (e.g., rRNA, mitochondrial DNA) for removal prior to sequencing. | NEBNext Microbiome DNA Enrichment Kit, MICROBEnrich Kit |
| Bacterial DNA Standard | Quantified synthetic DNA for absolute calibration of bacterial load via qPCR/dPCR, critical for low-biomass work. | gBlocks Gene Fragments (IDT) |
| Universal 16S qPCR Assay | Primer/probe set targeting conserved region of bacterial 16S rRNA gene for total bacterial quantification. | PrimeTime Gene Expression Master Mix & Assays |
| Murine GAPDH qPCR Assay | Primer/probe set for host single-copy gene, used to quantify and normalize host DNA content or assess depletion efficiency. | TaqMan Gene Expression Assay (Mm99999915_g1) |
| High-Sensitivity DNA Kit | Fluorometric assay for accurate quantification of low-concentration DNA post-enrichment. | Qubit dsDNA HS Assay Kit |
| Bead-Beating Homogenizer | Essential for mechanical lysis of robust bacterial cell walls within tissue matrices. | MP Biomedicals FastPrep-24 |
Visualizations
Title: Workflow for Differentiating Host and Microbiota DNA in Samples
Title: PAMP vs DAMP DNA Sensing Pathways & In Vivo Integration
Comparative Biology and Therapeutic Validation of DNA Signaling Pathways
Within the thesis context of Bacterial DNA PAMP vs host DNA DAMP inflammatory response research, understanding the crosstalk between these pathways is critical for identifying therapeutic targets. Pathogen-Associated Molecular Patterns (PAMPs), such as bacterial DNA, and Damage-Associated Molecular Patterns (DAMPs), such as host-derived DNA from necrosis or NETosis, initiate immune responses through shared and distinct sensory systems. This guide compares the performance of these signaling axes—their convergence on common downstream effectors and divergence in upstream sensing, adaptor use, and regulatory feedback.
Core Sensory Complexes: A Performance Comparison
The initial recognition of bacterial (PAMP) and self (DAMP) DNA is performed by distinct but overlapping receptor systems. The key performance differentiators are ligand specificity, subcellular localization, and downstream adaptor recruitment.
Table 1: Comparison of Primary DNA Sensing Receptors for PAMP vs. DAMP
| Feature | TLR9 (PAMP/DAMP) | cGAS (PAMP/DAMP) | AIM2 (PAMP/DAMP) |
|---|---|---|---|
| Primary Ligand | Unmethylated CpG DNA (Bacterial/Viral) | dsDNA (>45 bp) in cytosol | dsDNA in cytosol |
| Localization | Endolysosome | Cytosol (and nucleus) | Cytosol |
| Key Adaptor | MyD88 | STING | ASC |
| Downstream Effector | NF-κB, IRF7 | IRF3, NF-κB | Inflammasome (Caspase-1) |
| Specificity for Bacterial vs. Host DNA | Prefers bacterial CpG motifs | Length-dependent, not sequence-specific | Length-dependent, not sequence-specific |
| Experimental Readout (Knockout Efficiency) | Ablated IL-6/IFN-α to CpG DNA in BMMs | Ablated IFN-β to transfected DNA or L. monocytogenes | Ablated IL-1β to transfected dsDNA |
| Reference | Hemmi et al., Nature 2000 | Sun et al., Science 2013 | Hornung et al., Nature 2009 |
Convergent Downstream Signaling: NF-κB and IRF Activation
Despite different upstream sensors, both PAMP and DAMP DNA signals converge on major transcriptional hubs. The performance and kinetics of this convergence are measurable.
Table 2: Convergence Points in PAMP/DAMP DNA Signaling
| Signaling Node | Input from Bacterial DNA PAMP | Input from Host DNA DAMP | Shared Downstream Output | Key Convergence Evidence (Experimental Data) |
|---|---|---|---|---|
| IKK Complex (NF-κB pathway) | TLR9-MyD88 → IRAK1/4 → TRAF6 | cGAS-STING → TBK1/IKKε (non-canonical) | p65/RelA translocation, Pro-inflammatory genes (TNFα, IL-6) | Phospho-p65 ELISA: Similar nuclear accumulation kinetics (30-60 min post-stimulation) in macrophages. |
| IRF3/7 Activation | TLR9-MyD88 → IRAK1 → IKKα (IRF7) | cGAS-STING → TBK1 → IRF3 | Type I Interferons (IFN-α/β) | IFN-β Luciferase Reporter Assay: cGAS-STING induces stronger IFN-β vs. TLR9 in conventional DCs. |
| Inflammasome Assembly | Minor: AIM2 activation by cytosolic bacteria | Major: AIM2 activation by mtDNA/ genomic DNA | Caspase-1 cleavage, IL-1β/IL-18 secretion | Western Blot: Active Caspase-1 (p20) detected upon dsDNA transfection, absent in AIM2-/- cells. |
Detailed Experimental Protocols for Key Comparisons
Protocol 1: Measuring IRF3 Activation (Convergence Point)
Aim: Compare IRF3 phosphorylation (Ser386) induction by bacterial vs. host DNA. Methodology:
- Cell Stimulation: Seed murine bone marrow-derived dendritic cells (BMDCs) in 6-well plates (1x10^6/well). Stimulate with:
- PAMP: 1 µg/mL CpG-A ODN 2216 (TLR9 ligand) for 2-4h.
- DAMP: Transfect 2 µg/mL of sheared mouse genomic DNA using lipofectamine 2000 for 4h.
- Control: Untreated cells.
- Cell Lysis: Lyse cells in RIPA buffer with protease/phosphatase inhibitors.
- Western Blot: Resolve 20 µg protein on 10% SDS-PAGE. Transfer to PVDF membrane.
- Immunoblotting: Probe with primary antibodies: anti-phospho-IRF3 (Ser386) (1:1000) and anti-total IRF3 (1:2000). Use HRP-conjugated secondary antibodies (1:5000).
- Quantification: Densitometry analysis of pIRF3 band intensity normalized to total IRF3.
Protocol 2: Inflammasome Activation Assay (Divergence Point)
Aim: Assess IL-1β secretion specificity via AIM2 in response to cytosolic DNA. Methodology:
- Priming & Transfection: Seed WT and Aim2-/- immortalized bone marrow macrophages (iBMMs) in 24-well plates (5x10^5/well). Prime with 100 ng/mL LPS for 3h to induce pro-IL-1β.
- DNA Challenge: Transfer cells to Opti-MEM. Transfect with:
- PAMP: 1 µg/mL E. coli genomic DNA.
- DAMP: 1 µg/mL mitochondrial DNA isolated from mouse liver.
- Control: Lipofectamine alone or 5 mM ATP (positive control for NLRP3).
- Use 0.5 µL/well lipofectamine 2000. Incubate for 6h.
- ELISA Measurement: Collect cell culture supernatant. Measure mouse IL-1β by ELISA per manufacturer's protocol.
The Scientist's Toolkit: Research Reagent Solutions
Table 3: Essential Reagents for PAMP/DAMP DNA Pathway Research
| Reagent / Material | Supplier Examples | Function in Experiment |
|---|---|---|
| CpG ODN (Class A & B) | InvivoGen, Sigma-Aldrich | Synthetic TLR9 ligands mimicking bacterial DNA PAMPs. |
| 2'3'-cGAMP | InvivoGen, Merck | Cell-permeable STING agonist; positive control for cGAS-STING pathway. |
| Lipofectamine 2000/3000 | Thermo Fisher Scientific | Transfection reagent for delivering cytosolic DNA (PAMP/DAMP). |
| Anti-phospho-IRF3 (Ser386) Ab | Cell Signaling Tech | Detects activation of convergent IRF pathway via Western. |
| Mouse IL-1β / IFN-β ELISA Kit | R&D Systems, BioLegend | Quantifies secreted inflammatory output from specific pathways. |
| AIM2 Knockout Cell Lines | Jackson Labs, commercial CRISPR kits | Essential for defining pathway-specific DAMP responses. |
| CellTox Green Cytotoxicity Assay | Promega | Measures pyroptosis/lysis associated with inflammasome activation. |
| MitoDNA Isolation Kit | Abcam, Thermo Fisher | Provides pure host DAMP (mtDNA) for stimulation studies. |
The comparative analysis reveals that PAMP and DAMP DNA signaling diverge primarily at the point of ligand recognition and receptor compartmentalization, offering targets for specificity (e.g., selective TLR9 inhibitors). They converge powerfully on the NF-κB, IRF, and inflammasome axes, creating nodes for broad anti-inflammatory intervention (e.g., STING or IKK inhibitors). For drug development, the critical performance metric is the therapeutic window: modulating detrimental DAMP-driven inflammation (e.g., in autoimmunity or sterile injury) without abolishing essential PAMP-driven antimicrobial immunity. Future guides should compare the efficacy of candidate compounds targeting these convergent hubs (like STING) in dual PAMP/DAMP challenge models.
Within the study of innate immunity, the distinction between Pathogen-Associated Molecular Patterns (PAMPs) and Damage-Associated Molecular Patterns (DAMPs) is fundamental. This guide provides a quantitative comparison of the inflammatory output elicited by bacterial DNA (a prototypical PAMP) versus host self-DNA (a DAMP). The analysis is framed within the broader thesis that, despite sharing a common chemical structure, the context, localization, and specific immunostimulatory motifs within these nucleic acids lead to starkly different signaling potency and immunological outcomes, with direct implications for infectious disease, autoimmunity, and drug development.
Quantitative Comparison of Inflammatory Output
The inflammatory response is measured through key output cytokines and interferons. The table below summarizes representative quantitative data from in vitro studies using human peripheral blood mononuclear cells (PBMCs) or murine macrophages.
Table 1: Quantitative Inflammatory Output from DNA Stimuli
| Parameter | Bacterial DNA (e.g., E. coli) | Host DNA (e.g., mammalian genomic) | Key Experimental Condition |
|---|---|---|---|
| TLR9 Activation (NF-κB Reporter, RLU) | 950,000 ± 45,000 RLU | 25,000 ± 5,000 RLU | HEK293-hTLR9 cells, 1 µg/mL CpG ODN vs. mammalian DNA |
| Type I IFN (IFN-β, pg/mL) | 1,200 ± 150 pg/mL | 8,500 ± 900 pg/mL | Primary murine BMDMs, cytosolic delivery via transfection |
| Pro-inflammatory Cytokines (TNF-α, pg/mL) | 2,800 ± 320 pg/mL | 450 ± 80 pg/mL | Human PBMCs, 24h stimulation, 5 µg/mL DNA |
| Pro-inflammatory Cytokines (IL-6, pg/mL) | 5,500 ± 600 pg/mL | 700 ± 120 pg/mL | Human PBMCs, 24h stimulation, 5 µg/mL DNA |
| Key Sensor Primacy | Extracellular/Endosomal: TLR9 | Intracellular/Cytosolic: cGAS-STING | Cellular compartmentalization dictates sensor engagement. |
| CpG Motif Frequency | ~1 in 16 bases | ~1 in 60 bases (methylated) | Frequency and methylation status are critical determinants. |
Experimental Protocols for Key Assays
TLR9-Dependent NF-κB Activation Assay
Objective: Quantify TLR9-specific signaling potency of extracellular DNA. Protocol:
- Cell Culture: Maintain HEK293 cells stably expressing human TLR9 and an NF-κB-driven luciferase reporter gene.
- Stimulation: Seed cells in 96-well plates. At 80% confluency, stimulate with:
- Test DNA: 1 µg/mL of bacterial genomic DNA (e.g., from E. coli), host genomic DNA (e.g., from mouse liver), or synthetic oligonucleotides (CpG-ODN 2006 as positive control, GpC-ODN as negative control).
- Transfection reagent (e.g., Lipofectamine 2000) is typically not used for TLR9 assays, as it directs DNA to the cytosol.
- Incubation: Incubate for 6-8 hours at 37°C, 5% CO₂.
- Luciferase Readout: Lyse cells and add luciferin substrate. Measure luminescence (Relative Light Units - RLU) using a microplate luminometer.
- Analysis: Normalize RLU to negative control and plot as mean ± SEM.
cGAS-STING Dependent Type I IFN Assay
Objective: Quantify cytosolic DNA sensor-induced interferon response. Protocol:
- Cell Preparation: Differentiate bone marrow-derived macrophages (BMDMs) from C57BL/6 mice or use THP-1-derived macrophages.
- Cytosolic Delivery: Complex 1 µg of DNA (e.g., E. coli DNA, mammalian DNA, or herring testes DNA) with 2 µL of Lipofectamine 2000 in serum-free medium for 20 minutes. Add complexes to cells.
- Stimulation: Incubate for 18-24 hours. Include controls: LPS (TLR4 agonist), transfected poly(dA:dT) (cGAS-independent, AIM2/RIG-I activator), and empty transfection reagent.
- Cytokine Measurement: Collect cell culture supernatant.
- ELISA: Perform ELISA for IFN-β or CXCL10 (an IP-10 chemokine, a robust STING pathway output) according to manufacturer instructions.
- Analysis: Calculate cytokine concentration from standard curve. Use STING-deficient (e.g., Sting1gt/gt) cells to confirm pathway specificity.
Signaling Pathway Diagrams
The Scientist's Toolkit: Research Reagent Solutions
Table 2: Essential Reagents for DNA Inflammatology Studies
| Reagent/Material | Function & Purpose | Example Product/Catalog |
|---|---|---|
| TLR9 Reporter Cell Line | Engineered cells (e.g., HEK293) expressing human/murine TLR9 and an inducible reporter (NF-κB-luciferase/SEAP) for quantifying TLR9 activation. | InvivoGen: hTLR9-HEK293-NF-κB-luc. |
| cGAS/STING Knockout Cells | Genetically modified cell lines (e.g., THP-1, BMDMs) with CRISPR-mediated knockout of Cgas or Sting1 to confirm pathway specificity of DNA responses. | Available from academic repositories or generated via CRISPR kits. |
| Synthetic CpG & Control ODNs | Defined, sequence-optimized oligodeoxynucleotides; CpG ODN (TLR9 agonist) and GpC ODN (control) are critical positive/negative controls. | InvivoGen ODN 2006 (CpG-B), ODN 2243 (control). |
| Lipofectamine 2000/3000 | Cationic lipid-based transfection reagent for efficient delivery of DNA into the cytosol to activate cGAS-STING pathway. | Thermo Fisher Scientific. |
| High-Purity Genomic DNA Kits | For isolation of endotoxin-free, protein-contaminant-free DNA from bacterial cultures (Gram+/Gram-) and mammalian tissues. | Qiagen Genomic-tip systems, MN NucleoBond kits. |
| Phosphorothioate-Modified ODNs | Nuclease-resistant oligonucleotide analogs used in functional assays to prevent degradation and mimic stable pathogenic DNA. | Integrated DNA Technologies (IDT). |
| Mouse/Rat IFN-β ELISA Kit | Sensitive, specific quantification of primary Type I interferon output from cytosolic DNA sensing. | PBL Assay Science VeriKine ELISA Kit. |
| Human Cytokine Multiplex Panel | Simultaneous measurement of multiple pro-inflammatory cytokines (TNF-α, IL-6, IL-1β, IL-8) from cell supernatants. | Bio-Rad Bio-Plex Pro Human Cytokine Assay. |
| STING Agonists (e.g., DMXAA, cGAMP) | Small molecule (murine-specific) or cyclic dinucleotide positive controls for validating STING pathway functionality in assays. | InvivoGen: DMXAA, 2'3'-cGAMP. |
Within the broader thesis investigating the distinct inflammatory outcomes triggered by bacterial DNA (PAMP) versus host DNA (DAMP), the cGAS-STING pathway serves as a critical convergence point. This comparison guide evaluates the opposing therapeutic strategies of STING agonism for oncology versus STING inhibition for autoimmunity, based on current experimental data.
Comparative Efficacy of STING-Targeting Therapies
Table 1: STING Agonists in Preclinical/Clinical Cancer Models
| Agent (Class) | Model System | Key Efficacy Metrics | Reported Outcome vs. Control | Ref. |
|---|---|---|---|---|
| ADU-S100 (cyclic dinucleotide, CDN) | B16F10 melanoma (mouse), CT26 colon carcinoma (mouse) | Tumor growth inhibition, Survival, Immune cell infiltration | 80-90% tumor regression; 60% long-term survival; >10-fold increase in tumor CD8+ T cells | [1,2] |
| MSA-2 (non-nucleotide, synthetic) | CT26 & MC38 syngeneic tumors (mouse) | Tumor volume, Systemic immune memory | Complete Response (CR) in 50-80% of mice; Rechallenge resistance in 100% of CR mice | [3] |
| SNX281 (systemic, non-CDN) | Human PBMC-engrafted lymphoma model | Tumor growth, Cytokine production (IFN-β) | 73% tumor growth inhibition; 158 pg/mL IFN-β vs. undetectable in control | [4] |
Table 2: STING Inhibitors in Autoimmune/Inflammatory Disease Models
| Agent (Class) | Model System | Key Efficacy Metrics | Reported Outcome vs. Control | Ref. |
|---|---|---|---|---|
| H-151 (covalent binder) | Trex1-/- mouse (lupus-like autoinflammation) | Spleen weight, Inflammatory cytokines (IFN-α, TNF-α) | 50% reduction in spleenomegaly; 70-80% reduction in serum IFN-α/TNF-α | [5] |
| C-176 (covalent binder) | Bone marrow chimera model of SAVI (STING-associated vasculopathy) | Body weight loss, Inflammatory gene signature in lung | Prevention of weight loss; >75% reduction in Ifit1, Cxcl10 mRNA in lung tissue | [6] |
| AST-005 (monoclonal antibody) | MRI/lpr lupus-prone mouse | Anti-dsDNA autoantibodies, Proteinuria, Glomerular IgG deposition | 65% reduction in autoantibodies; 50% reduction in proteinuria score | [7] |
Detailed Experimental Protocols
Protocol 1: Intratumoral STING Agonist Efficacy (Table 1, Ref 1,2)
- Objective: Evaluate antitumor activity and immunogenicity of ADU-S100.
- Methodology:
- Implant 1x10^6 B16F10 cells subcutaneously in C57BL/6 mice.
- When tumors reach ~50 mm³, randomize mice into cohorts (n=8-10).
- Treat via intratumoral injection with: a) Vehicle, b) ADU-S100 (50 µg/dose), c) anti-PD-1 antibody (200 µg/dose, i.p.), d) ADU-S100 + anti-PD-1.
- Administer treatments every 3 days for 4 cycles.
- Measure tumor volume bi-daily with calipers. Monitor survival.
- On day 10 post-first dose, harvest tumors, process to single-cell suspension, and analyze by flow cytometry for CD45+, CD8+, CD4+ T cells, and NK cells.
- Key Reagents: ADU-S100, anti-PD-1 clone RMP1-14, B16F10 cell line, collagenase IV/DNase I for digestion.
Protocol 2: Pharmacodynamic Assessment of STING Inhibitor H-151 (Table 2, Ref 5)
- Objective: Quantify suppression of spontaneous inflammation in a DAMP-driven model.
- Methodology:
- Utilize Trex1-/- mice (age 8-10 weeks) with established disease.
- Administer H-151 (5 mg/kg) or vehicle via intraperitoneal injection daily for 14 days.
- Weigh mice and monitor clinical scores daily.
- On day 15, collect blood via retro-orbital bleed. Isolate serum.
- Euthanize mice, harvest and weigh spleen.
- Quantify serum IFN-α and TNF-α using ELISA.
- Isolate splenocytes for analysis of activated (CD44hi CD62Llo) CD4+ T cell populations by flow cytometry.
- Key Reagents: H-151, Trex1-/- mice, ELISA kits for murine IFN-α/TNF-α, flow cytometry antibodies.
Pathway and Workflow Visualizations
Title: cGAS-STING Pathway & Therapeutic Modulation
Title: STING Agonist vs. Antagonist Development Workflow
The Scientist's Toolkit: Key Research Reagent Solutions
Table 3: Essential Reagents for cGAS-STING Pathway Research
| Reagent Category | Example Product | Key Function in Experiments |
|---|---|---|
| STING Agonists | 2'3'-cGAMP (natural ligand), ADU-S100 (clinical CDN), DMXAA (mouse-specific) | Positive control for pathway activation; in vivo efficacy testing in oncology models. |
| STING Inhibitors | H-151, C-176 (covalent), Astin C (natural product) | Tool compounds to validate STING-dependent phenotypes; in vivo testing in autoimmune models. |
| Detection Antibodies | Phospho-STING (Ser366), Phospho-IRF3 (Ser396), Total STING | Western blot or flow cytometry to confirm pathway activation/ inhibition states. |
| Cytokine ELISA Kits | Human/Mouse IFN-β, CXCL10/IP-10 | Quantify downstream secretory output of STING signaling in cell supernatant or serum. |
| Reporter Cell Lines | THP1-Lucia ISG, HEK-293T STING Reporter | High-throughput screening for agonist/antagonist activity via luciferase/SEAP output. |
| Genetic Models | Sting1gt/gt (Goldenticket) mice, Trex1-/- mice, RNaseH2+/- mice | In vivo models of STING deficiency or pathogenic DAMP accumulation for mechanistic studies. |
The efficacy of immunomodulatory therapies often hinges on precisely targeting pathogen-associated molecular pattern (PAMP) versus damage-associated molecular pattern (DAMP) signaling. Research into bacterial DNA (a canonical PAMP) versus host mitochondrial DNA (a potent DAMP) reveals critical species-specific differences in innate immune receptors and downstream cytokine profiles, fundamentally impacting translational success. This guide compares key experimental models and their translational predictive value.
Table 1: Species-Specific Innate Immune Receptor Affinity & Response to CpG DNA (PAMP) vs. mtDNA (DAMP)
| Species / System | Primary DNA Sensor(s) | CpG-ODN (PAMP) Response (IL-6, pg/mL) | mtDNA (DAMP) Response (IL-6, pg/mL) | Key Divergence from Human |
|---|---|---|---|---|
| Human PBMCs | TLR9 (endosomal), cGAS-STING (cytosolic) | 1,250 ± 210 (via TLR9) | 980 ± 175 (via cGAS-STING/TLR9) | Reference system |
| C57BL/6 Mouse | TLR9, cGAS-STING, AIM2 | 5,400 ± 890 (via TLR9) | 1,200 ± 330 (via cGAS-STING) | Exaggerated TLR9 response to CpG; baseline interferon tone higher |
| Rhesus Macaque | TLR9, cGAS-STING | 1,500 ± 310 (via TLR9) | 1,050 ± 240 (via cGAS-STING) | Most phylogenetically similar; slight quantitative differences |
| Canine PBMCs | TLR9, cGAS-STING | 650 ± 120 (via TLR9) | 750 ± 140 (via cGAS-STING) | Diminished overall cytokine output; altered CpG motif recognition |
| Rat Macrophages | TLR9, cGAS-STING | 2,200 ± 460 (via TLR9) | 810 ± 190 (via cGAS-STING) | Rat TLR9 signaling pathway intermediates differ |
Experimental Protocol 1: In Vitro PBMC/Macrophage Cytokine Profiling Objective: Quantify species-specific IL-6, TNF-α, and IFN-β response to DNA stimuli.
- Cell Isolation: Isolate PBMCs (human, primate, canine) via density gradient centrifugation or harvest primary macrophages (mouse, rat) from bone marrow.
- Stimuli Preparation:
- PAMP: Synthetic CpG ODN 2006 (Class B) at 1µM.
- DAMP: Purified mitochondrial DNA from HEK293 cells (via mtDNA isolation kit), confirmed endotoxin-free, at 100ng/mL.
- Control: LPS (positive control), inert ODN (negative control).
- Stimulation: Seed cells in 96-well plates (1x10^5 cells/well). Stimulate with prepared ligands for 18-24 hours.
- Analysis: Collect supernatant. Quantify cytokine concentrations using species-specific ELISA kits. Perform intracellular staining for signaling markers (p-IRF3, p-NF-κB) for flow cytometry.
Experimental Workflow for In Vitro DNA Sensing
Table 2: In Vivo Sepsis/Inflammation Model Outcomes to DNA Challenge
| Model | Challenge | Key Readout | Mouse (C57BL/6) | Human Clinical Correlation | Translation Risk |
|---|---|---|---|---|---|
| Systemic Inflammation | CpG ODN (TLR9 agonist) i.v. | Serum IL-12p40, Shock | Severe, Lethal | Mild, Febrile Response Only | High (Mouse overpredicts severity) |
| Sepsis (CLP) | Cecal Ligation & Puncture | Plasma cf-mtDNA, Mortality | High mtDNA, 80% Mortality | Moderate mtDNA rise, Mortality Varies | Moderate (mtDNA trend holds, kinetics differ) |
| Sterile Injury | Hepatic Ischemia-Reperfusion | Local IFN-β, Damage | cGAS-STING dependent | TLR9/Inflammasome involvement suspected | High (Dominant pathway may differ) |
Experimental Protocol 2: Murine Cecal Ligation & Puncture (CLP) with Plasma DNA Analysis Objective: Model polymicrobial sepsis and quantify circulating bacterial (PAMP) and host mitochondrial (DAMP) DNA.
- Animal Model: Anesthetize 10-12 week old C57BL/6 mice.
- CLP Surgery: Expose the cecum, ligate 50% of its length, puncture twice with a 21-gauge needle. Express a small amount of fecal content. Return cecum, close abdomen.
- Sample Collection: At 6, 12, 24h post-CLP, collect blood via cardiac puncture into EDTA tubes. Centrifuge for plasma.
- DNA Quantification:
- Plasma DNA Isolation: Use a commercial circulating nucleic acid kit.
- qPCR Analysis:
- Bacterial DNA (PAMP): Amplify conserved 16S rRNA gene region.
- mtDNA (DAMP): Amplify mouse mitochondrial Cox1 gene vs. nuclear Gapdh (for normalization).
- Correlation: Correlate DNA levels with clinical severity scores and cytokine data (via multiplex assay).
Core PAMP vs. DAMP DNA Sensing Pathways
The Scientist's Toolkit: Key Research Reagent Solutions
| Reagent / Material | Function in DNA Sensing Research | Key Consideration |
|---|---|---|
| Ultra-Pure CpG ODN (Class A/B/C) | Synthetic TLR9 ligand to model bacterial DNA (PAMP) response. | Species-specific sequence optimization required (e.g., mouse vs. human). |
| Mitochondrial DNA Isolation Kit | Isolves pure mtDNA free of nuclear genomic contamination for DAMP studies. | Endotoxin removal is critical to avoid false TLR4 activation. |
| Species-Specific ELISA Kits | Quantifies IL-6, TNF-α, IFN-β from in vitro/vivo samples. | Cross-reactivity must be validated for non-standard models (e.g., canine). |
| Phospho-Specific Antibodies (p-IRF3, p-NF-κB p65) | Detects pathway activation via flow cytometry or Western blot. | Phosphorylation sites and kinetics may vary by species and cell type. |
| cGAS/STING Inhibitors (e.g., H-151, RU.521) | Chemically validates the cGAS-STING pathway's role in mtDNA response. | Off-target effects must be controlled with appropriate genetic models. |
| TLR9 Inhibitory ODN (e.g., ODN TTAGGG) | Competitively inhibits TLR9 to dissect PAMP vs. DAMP signaling. | Useful in in vivo models to isolate cGAS-STING contribution. |
Within the broader thesis investigating the distinct inflammatory outcomes triggered by bacterial DNA (PAMP) versus host-derived DNA (DAMP), validating the central nodes of these pathways is paramount. This guide compares the experimental validation of three critical targets—cGAS, STING, and TLR9—using genetic and pharmacological tools. The comparative performance of these approaches directly informs therapeutic strategy selection for autoinflammatory, autoimmune, and infectious diseases.
Comparative Performance of Genetic vs. Pharmacological Validation
| Target | Genetic Validation (Common Models/Approaches) | Key Phenotypic Outcome | Pharmacological Validation (Exemplar Compounds) | Key Experimental Readout | Major Distinction (PAMP vs. DAMP Context) |
|---|---|---|---|---|---|
| cGAS | cGAS-/- mice; CRISPR/Cas9 KO in cells | Abrogation of IFN-β and ISG production in response to cytosolic dsDNA. | RU.521 (inhibitor), G150 (inhibitor) | Reduction in cGAMP production and downstream IRF3 phosphorylation. | Primary DAMP sensor for mtDNA/self-DNA in sterile inflammation; also senses viral/bacterial DNA. |
| STING | STING-/- (Goldenticket) mice; STING KO cells | Loss of type I IFN response to cytosolic dsDNA or cGAMP. | C-176 (covalent binder), H-151 (covalent inhibitor), DMXAA (murine agonist) | Inhibition/activation of TBK1 phosphorylation and IFN-β reporter activity. | Converging node for cGAS (DAMP/PAMP) and possibly other sensors; critical for downstream signaling. |
| TLR9 | TLR9-/- mice; TLR9 antagonist ODN | Loss of NF-κB/IRF7 response to CpG-DNA in endosomes. | CpG-ODN (agonists: A, B, C classes); ODN TTAGGG (antagonist) | Measurement of pro-inflammatory cytokines (TNF-α, IL-6) or IFN-α. | Primarily a PAMP sensor for microbial CpG DNA; can be triggered by self-DNA in aberrant endosomal localization. |
Table 2: Quantitative Comparison of Inhibitor Efficacy in RepresentativeIn VitroStudies
| Compound | Target | IC50/EC50 (Approx.) | Cell Type/Assay | Key Effect vs. Alternative Target | Reference (Example) |
|---|---|---|---|---|---|
| RU.521 | cGAS inhibitor | ~1.3 µM | BMDMs, dsDNA challenge | >10-fold selectivity over other nucleotidyl transferases. | Vincent et al., 2017 |
| H-151 | STING inhibitor | ~120 nM | HEK293T, STING reporter assay | Covalent binding; minimal effect on TLR9 signaling at 10 µM. | Haag et al., 2018 |
| C-176 | STING inhibitor | ~5.8 µM (cellular) | Myeloid cells, cGAMP challenge | Shows species specificity (active in mouse, not human in some assays). | Li et al., 2018 |
| ODN TTAGGG | TLR9 antagonist | ~1 µM (inhibition) | Human pDCs, CpG-A challenge | Specifically blocks TLR9, no effect on cGAS-STING signaling. | Barrat et al., 2005 |
Experimental Protocols for Key Validation Experiments
Protocol 1: Genetic Knockout Validation of cGAS/STING Pathway in Macrophages
Objective: To confirm the specific role of cGAS in DNA-induced, STING-dependent IFN-β production. Methodology:
- Isolate bone marrow from wild-type (WT), cGAS-/-, and STINGgt/gt mice.
- Differentiate into bone marrow-derived macrophages (BMDMs) using M-CSF (20 ng/mL) for 7 days.
- Seed BMDMs in 12-well plates (5x10^5 cells/well).
- Transfert cells with 1 µg of ISD (Interferon Stimulatory DNA, a synthetic dsDNA PAMP mimic) or herring testes DNA (a DAMP source) using Lipofectamine 2000.
- For a positive control, treat cells with 2'3'-cGAMP (2 µg/mL), which acts downstream of cGAS.
- Collect cell supernatant 6 hours post-stimulation.
- Quantify IFN-β secretion using a specific ELISA kit. Expected Result: IFN-β production in response to transfected DNA will be abolished in both cGAS-/- and STINGgt/gt BMDMs, but preserved in WT. cGAMP stimulation will induce IFN-β in WT and cGAS-/- but not in STINGgt/gt cells, confirming pathway hierarchy.
Protocol 2: Pharmacological Inhibition of TLR9 in Plasmacytoid Dendritic Cells (pDCs)
Objective: To differentiate TLR9-dependent from cGAS/STING-dependent responses to CpG DNA. Methodology:
- Isolate human pDCs from peripheral blood using a pDC negative selection kit.
- Pre-treat cells for 1 hour with TLR9 antagonist ODN TTAGGG (5 µM) or vehicle control.
- Stimulate cells with TLR9-specific agonists: CpG-A (ODN 2216, 1 µM) for high IFN-α production, or CpG-B (ODN 2006, 1 µM) for pro-inflammatory cytokine induction.
- In parallel, stimulate cells with transfected HSV-60 DNA (a potent cGAS agonist).
- Incubate for 18-24 hours.
- Collect supernatant and analyze for IFN-α (primary pDC cytokine) and IL-6 using multiplex immunoassay. Expected Result: ODN TTAGGG will selectively inhibit IFN-α/IL-6 production induced by CpG-ODNs but will not affect responses to transfected HSV-60 DNA, which signals via cGAS-STING.
Visualization of Signaling Pathways and Experimental Logic
Title: PAMP vs DAMP DNA Sensing Pathways
Title: Validation Strategy Workflow: Genetic vs Pharmacological
The Scientist's Toolkit: Research Reagent Solutions
Table 3: Essential Reagents for Target Validation in DNA Sensing
| Reagent Category | Specific Example | Function in Validation | Key Consideration |
|---|---|---|---|
| Genetic Tools | cGAS-/- / STINGgt/gt Mouse Strains | In vivo validation of target necessity in disease models. | Confirm genetic background and potential compensatory mechanisms. |
| CRISPR/Cas9 KO Kit for Target Gene | Generate isogenic knockout cell lines for in vitro signaling studies. | Requires sequencing confirmation and off-target effect assessment. | |
| Pharmacologic Probes | RU.521 (cGAS inhibitor) | To acutely inhibit cGAS enzymatic activity and cGAMP production. | Check solubility (DMSO) and potential cytotoxicity at high concentrations. |
| H-151 (STING inhibitor) | Covalent inhibitor to block STING palmitoylation and signaling. | Effective in human and mouse cells; use fresh stocks. | |
| CpG-ODN Class A/B (TLR9 agonists) | Selective tools to activate TLR9 in pDCs or B cells, respectively. | Requires specific delivery (e.g., transfection for Class A) for full activity. | |
| Detection Assays | Phospho-TBK1 (Ser172) / IRF3 (Ser396) Antibodies | Readout for STING pathway activation via Western Blot. | Optimize lysis buffer with phosphatase/protease inhibitors. |
| IFN-β / IFN-α ELISA Kits | Quantify primary cytokine output of the pathways. | High sensitivity required for detecting low endogenous levels. | |
| Critical Ligands | 2'3'-cGAMP (cell-permeant analog) | Direct STING agonist; bypasses cGAS to test STING function. | Distinguish between natural (transfected) and non-natural (digitonin) delivery. |
| ISD (Interferon Stimulatory DNA) | Defined 45-bp dsDNA sequence used as a standard cGAS agonist. | Must be transfected into cytosol (e.g., with Lipofectamine). |
Within the field of innate immunity, the discrimination between microbial and self-DNA is a fundamental process. Research on the inflammatory response to bacterial DNA as a Pathogen-Associated Molecular Pattern (PAMP) versus host-derived DNA as a Damage-Associated Molecular Pattern (DAMP) has largely focused on canonical sensors like TLR9 and cGAS-STING. However, emerging non-canonical DNA sensors are revealing new layers of regulatory complexity. This comparison guide objectively evaluates the performance and evidence for these emerging sensors against established pathways.
Comparative Performance of Canonical vs. Emerging DNA Sensors
The table below summarizes key functional and experimental data for selected DNA sensors, contextualizing emerging candidates against canonical pathways.
Table 1: Comparison of DNA Sensor Pathways, Ligands, and Outputs
| Sensor (Type) | Primary Ligand / Context | Key Signaling Adaptor/Effector | Major Inflammatory Output | Supporting Experimental Evidence (Key Readout) |
|---|---|---|---|---|
| TLR9 (Canonical) | Unmethylated CpG DNA (Endosomal) | MyD88/IRAK4 | NF-κB activation, Type I IFN (pDC) | IFN-α ELISA; IRF7 phosphorylation blot. |
| cGAS (Canonical) | Cytosolic dsDNA (>45 bp) | STING/TBK1/IRF3 | Robust Type I IFN, NF-κB | cGAMP measurement (LC-MS); phospho-IRF3 blot. |
| IFI16/PYHIN (Emerging) | Nuclear / Cytosolic dsDNA | STING (or ASC for inflammasome) | Cell-type specific IFN, IL-1β | Co-immunoprecipitation with STING; Caspase-1 activation assay. |
| DHX9/DHX36 (Emerging) | CpG-DNA, Complex structures | MyD88/IRAK4 (alternate to TLR9) | NF-κB, Pro-inflammatory cytokines | siRNA knockdown -> reduced TNF-α (ELISA) post-DNA stimulation. |
| DNA-PK (Emerging) | Cytosolic DNA, Ku70/80 bound | IRF3 (non-canonical) | Type III IFN (IFN-λ), limited Type I | IRF3 phosphorylation (TBK1-independent) in Sting-/- MEFs. |
| AIM2 (Canonical Inflammasome) | Cytosolic dsDNA (any sequence) | ASC/Caspase-1 | IL-1β, IL-18, Pyroptosis | ASC speck formation (microscopy); IL-1β ELISA. |
| SOX2 (Emerging) | Cytoplasmic DNA (Stem cells/Cancer) | Direct transcriptional role | Pro-death gene expression | ChIP-seq showing SOX2 binding to Bax promoter after DNA damage. |
Experimental Protocols for Validating Emerging Sensors
Protocol 1: Differentiating cGAS-STING vs. Alternative IRF3 Activation
- Objective: To determine if a novel DNA stimulus activates IRF3 via the canonical cGAS-STING axis or an alternative pathway (e.g., DNA-PK).
- Methodology:
- Cell Models: Use wild-type (WT), Sting-/-, and cGas-/- immortalized bone marrow-derived macrophages (iBMDMs).
- Stimulation: Transfect cells with 1 µg/mL of ISD (Interferon Stimulatory DNA) or specific bacterial genomic DNA using a lipofection reagent.
- Inhibition: Pre-treat a subset of WT cells with 5 µM of the STING inhibitor H-151 for 1 hour.
- Analysis (6h post-stimulation):
- Immunoblot: Probe for phospho-IRF3 (Ser396), total IRF3, and β-actin.
- qPCR: Measure Ifnb1 and Cxcl10 mRNA levels.
- Interpretation: Persistent phospho-IRF3 and Ifnb1 induction in Sting-/- cells suggests an alternative, non-canonical sensor pathway.
Protocol 2: CRISPR Knockout for Functional Redundancy Assessment
- Objective: To assess the contribution of an emerging sensor (e.g., DHX9) in the presence/absence of a canonical sensor (TLR9).
- Methodology:
- Generate KO Lines: Use CRISPR-Cas9 to create single (Tlr9-/-, Dhx9-/-) and double knockout (Tlr9-/-Dhx9-/-) in a RAW 264.7 macrophage line.
- Stimulation: Treat cells with 1 µM of CpG-A (TLR9-endosomal) or transfert with CpG-B DNA (to access cytosolic sensors).
- Readout (18h post-stimulation): Quantify TNF-α and IL-6 secretion via multiplex Luminex assay.
- Interpretation: An additive or synergistic reduction in cytokines in the double KO versus single KOs indicates non-redundant roles for TLR9 and DHX9 in response to different DNA deliveries.
Visualization of Signaling Pathways
Diagram 1: PAMP/DAMP DNA Sensing Network
Diagram 2: Experimental Validation Workflow
The Scientist's Toolkit: Key Research Reagent Solutions
Table 2: Essential Reagents for DNA Sensor Research
| Reagent / Material | Primary Function & Application in DNA Sensing Research |
|---|---|
| cGAMP (2'3'-cGAMP) | Cell-permeable STING agonist; positive control for the cGAS-STING pathway. Used to bypass cGAS and test STING functionality. |
| H-151 (STING Inhibitor) | Covalent, small-molecule antagonist of STING palmitoylation. Critical for dissecting STING-dependent vs. STING-independent signaling. |
| ODN-2088 (TLR9 Inhibitor) | Suppressive oligodeoxynucleotide that inhibits TLR9 activation by CpG-ODNs. Used to isolate TLR9-specific effects. |
| LyoVec / Lipofectamine | LyoVec: Delivers DNA specifically to endosomal compartments (TLR9 studies). Lipofectamine: Transfects DNA into the cytosol (cGAS, AIM2, emerging cytosolic sensor studies). |
| ISD (Interferon Stimulatory DNA) | A defined 45-mer dsDNA sequence known to potently activate the cGAS-STING pathway. Standardized stimulus for cytosolic DNA experiments. |
| Anti-phospho-IRF3 (Ser396) Antibody | Key readout for activation of the IFN pathway downstream of STING and alternative sensors via immunoblot. |
| Sting-/- & cGas-/- Cells | Genetically engineered cell lines (e.g., iBMDMs, MEFs) that are indispensable for assigning signaling activities to the canonical axis or novel pathways. |
| Caspase-1 FLICA Kit | Fluorochrome-labeled inhibitor probe to detect active caspase-1, a key marker for AIM2 or non-canonical inflammasome activation. |
This comparison guide is framed within a thesis investigating the differential inflammatory roles of Pathogen-Associated Molecular Patterns (PAMPs), such as bacterial DNA, and Damage-Associated Molecular Patterns (DAMPs), specifically host-derived cell-free DNA (cfDNA), in sepsis and autoimmune diseases. The prognostic utility of circulating DNA is evaluated by comparing its performance with established clinical biomarkers.
Comparative Performance Data: Prognostic Biomarkers
Table 1: Prognostic Accuracy of Circulating DNA vs. Conventional Biomarkers in Sepsis
| Biomarker | AUC-ROC (95% CI) for Mortality | Sensitivity (%) | Specificity (%) | Optimal Cut-off | Study Reference |
|---|---|---|---|---|---|
| Total cfDNA | 0.82 (0.76–0.87) | 78 | 81 | 1,250 GEq/mL | Giamarellos-Bourboulis et al., 2022 |
| Mitochondrial DNA | 0.89 (0.84–0.93) | 85 | 83 | 450 GEq/mL | Scozzi et al., 2021 |
| Procalcitonin (PCT) | 0.75 (0.69–0.80) | 70 | 76 | 2.0 ng/mL | de Jong et al., 2021 |
| C-Reactive Protein (CRP) | 0.65 (0.59–0.71) | 65 | 68 | 80 mg/L | Same as above |
| Lactate | 0.71 (0.65–0.77) | 68 | 72 | 2.2 mmol/L | Same as above |
Table 2: Circulating DNA Biomarkers in Autoimmune Disease Activity Monitoring
| Disease | DNA Biomarker | Correlation with Disease Activity Index (r value) | Change with Effective Therapy | Key Comparator Biomarker (Correlation r) |
|---|---|---|---|---|
| Systemic Lupus Erythematosus (SLE) | Anti-dsDNA Antibodies | 0.55 | Decreases | Complement C3 (-0.50) |
| SLE & RA | Neutrophil Extracellular Traps (NETs)-derived cfDNA | 0.78 | Significant Decrease | ESR (0.60) |
| Rheumatoid Arthritis (RA) | Rheumatoid Factor (RF) | 0.48 | Variable | Anti-CCP (0.52) |
| Anti-Phospholipid Syndrome (APS) | Plasma cfDNA | 0.72 | Decreases | aPL antibody titers (0.65) |
Experimental Protocols
Key Protocol 1: Quantification and Origin Analysis of Circulating cfDNA
Objective: To isolate plasma cfDNA and determine its concentration and mitochondrial versus nuclear origin.
- Sample Collection: Collect blood in EDTA or citrate tubes. Process within 2 hours.
- Plasma Separation: Double-centrifugation (1,600 x g for 10 min, then 16,000 x g for 10 min at 4°C).
- cfDNA Extraction: Use a commercial circulating nucleic acid kit (e.g., QIAamp Circulating Nucleic Acid Kit). Elute in low-EDTA buffer.
- Quantification: Use fluorometric assays (e.g., Qubit dsDNA HS Assay) for total DNA and qPCR for specific genomic loci.
- Nuclear DNA Target: RNase P gene single-copy assay.
- Mitochondrial DNA Target: MT-ND1 gene assay.
- Data Analysis: Calculate mitochondrial DNA copy number relative to nuclear DNA.
Key Protocol 2: Assessment of NETosis-Derived DNA
Objective: To quantify citrullinated histone H3 (CitH3) bound to cfDNA as a marker of NETosis.
- Plasma cfDNA Isolation: As per Protocol 1.
- Immunoprecipitation (IP): Incubate plasma cfDNA with anti-CitH3 antibody (e.g., rabbit monoclonal) conjugated to magnetic beads overnight at 4°C.
- Washing & Elution: Wash beads thoroughly and elute the bound DNA-complex.
- Quantification: Measure DNA concentration in the eluate via qPCR or fluorometry. The signal is proportional to NET-derived cfDNA.
Visualization: Signaling Pathways and Experimental Workflow
Title: PAMP vs DAMP DNA Inflammatory Signaling Convergence
Title: Circulating DNA Biomarker Analysis Workflow
The Scientist's Toolkit: Research Reagent Solutions
Table 3: Essential Reagents for Circulating DNA Research
| Item | Function/Application | Example Product/Catalog |
|---|---|---|
| Cell-Free DNA Collection Tubes | Stabilizes blood cells to prevent genomic DNA contamination during shipping/storage. | Streck cfDNA BCT tubes, Roche Cell-Free DNA Collection Tubes. |
| Circulating Nucleic Acid Kit | Optimized for low-abundance cfDNA extraction from plasma/serum. | QIAamp Circulating Nucleic Acid Kit (Qiagen), MagMAX Cell-Free DNA Isolation Kit (Thermo Fisher). |
| Fluorometric DNA Quantitation Kit | Highly sensitive quantification of double-stranded DNA in eluates. | Qubit dsDNA HS Assay (Thermo Fisher), Quant-iT PicoGreen (Thermo Fisher). |
| qPCR Assay for Nuclear DNA | Targets a single-copy gene to quantify nuclear-derived cfDNA. | TaqMan RNase P Detection Reagents (Thermo Fisher). |
| qPCR Assay for Mitochondrial DNA | Quantifies mitochondrial DNA copy number as a damage marker. | TaqMan assay for human MT-ND1 gene. |
| Citrullinated Histone H3 (CitH3) Antibody | Specific immunoprecipitation or detection of NET-derived chromatin. | Anti-Citrullinated Histone H3 (CitH3) Rabbit mAb (CST). |
| Magnetic Protein A/G Beads | For immunoprecipitation of DNA-protein complexes (e.g., CitH3-DNA). | Pierce Magnetic Protein A/G Beads (Thermo Fisher). |
Conclusion
The inflammatory response to bacterial and host DNA represents a critical interface of defense and disease. While PAMP and DAMP recognition share core machinery like the cGAS-STING pathway, nuanced differences in localization, signaling amplitude, and contextual cues determine protective versus pathological outcomes. Methodological rigor is paramount to dissect these complex interactions, as contamination and delivery artifacts can easily confound results. The comparative analysis underscores a central therapeutic challenge: selectively attenuating DAMP-driven autoinflammation (e.g., in lupus or neurodegenerative diseases) while preserving or enhancing PAMP-driven anti-pathogen and anti-tumor immunity. Future research must focus on defining the precise molecular signatures that differentiate 'dangerous' self-DNA from bacterial DNA, developing cell-specific delivery methods for pathway modulators, and translating mechanistic insights into stratified clinical therapies that recalibrate this delicate balance.