PAMPs Unveiled: How Pathogen-Associated Molecular Patterns Trigger the Innate Immune Arsenal
This article provides a comprehensive, research-oriented analysis of how Pathogen-Associated Molecular Patterns (PAMPs) initiate the innate immune response.
PAMPs Unveiled: How Pathogen-Associated Molecular Patterns Trigger the Innate Immune Arsenal
Abstract
This article provides a comprehensive, research-oriented analysis of how Pathogen-Associated Molecular Patterns (PAMPs) initiate the innate immune response. We explore the foundational biology of PAMP recognition by Pattern Recognition Receptors (PRRs), detailing key signaling pathways like NF-κB and IRF. Methodological approaches for studying PAMP-PRR interactions, from in vitro assays to advanced imaging, are reviewed. We address common experimental challenges and optimization strategies in PAMP research. Finally, we validate core concepts by comparing different PAMP classes, receptor systems, and discuss the translational applications in vaccine adjuvant and immunotherapeutic development, offering a critical resource for scientists and drug developers.
The First Line of Defense: Decoding PAMP Recognition and Core Signaling Pathways
The central thesis framing modern innate immunity research is that Pattern Recognition Receptors (PRRs) detect conserved Pathogen-Associated Molecular Patterns (PAMPs) to initiate a rapid, first-line defense. PAMPs are invariant structures essential for microbial survival, making them ideal targets for immune surveillance. This guide provides an in-depth technical analysis of key PAMPs, from bacterial lipopolysaccharide (LPS) to viral RNA, detailing their recognition, downstream signaling, and experimental interrogation. Understanding these mechanisms is foundational for developing immunotherapies and anti-infective agents.
Core PAMPs: Structures, Receptors, and Quantitative Data
PAMPs are broadly categorized by their origin and chemical nature. The following table summarizes the defining characteristics, receptors, and key quantitative data for major PAMPs.
Table 1: Major PAMPs, Their Receptors, and Key Biological Data
| PAMP Class | Exemplar PAMP | PRR(s) (Toll-like Receptor unless noted) | Conserved Motif / Structure | Typical Agonist Concentration in Experiments | Key Cytokine Output (Primary) |
|---|---|---|---|---|---|
| Bacterial Lipids | Lipopolysaccharide (LPS) | TLR4/MD2/CD14 | Lipid A moiety | 1-100 ng/ml (E. coli LPS) | TNF-α, IL-6, IL-1β |
| Bacterial Lipoproteins | Triacylated lipopeptide | TLR2/TLR1 | N-terminal Cys with lipid tails | 10-1000 ng/ml | TNF-α, IL-8 |
| Bacterial Nucleic Acids | CpG DNA (unmethylated) | TLR9 (endosomal) | CpG dinucleotide motif | 0.1-5 µM (ODN sequences) | Type I IFN, IL-12 |
| Viral Nucleic Acids | dsRNA | TLR3 (endosomal) | Long double-stranded RNA | 1-25 µg/ml (poly(I:C)) | Type I IFN, TNF-α |
| Viral Nucleic Acids | 5'-triphosphate RNA | RIG-I (cytosolic) | Uncapped 5' triphosphate, short dsRNA | 0.1-1 µg/ml (in vitro transfection) | Type I IFN |
| Viral/Bacterial Carbohydrates | Mannan (Fungal) | Dectin-1, MBL | Mannose polymers | 10-100 µg/ml | IL-1β, IL-6, IL-23 |
| Bacterial Peptidoglycan Fragments | MDP (Muramyl dipeptide) | NOD2 (cytosolic) | MurNAc-L-Ala-D-isoGln | 1-50 µg/ml | Pro-IL-1β, defensins |
Table 2: Key Signaling Adaptors and Downstream Effector Molecules
| PRR Family | Common Adaptor Protein | Key Kinase Cascade | Terminal Transcription Factor(s) | Target Gene Examples |
|---|---|---|---|---|
| TLRs (MyD88-dependent) | MyD88 | IRAK1/4, TRAF6 -> IKK | NF-κB, AP-1 | TNF, IL6, IL1B |
| TLRs (TRIF-dependent) | TRIF | TBK1, IKKε -> IKK | IRF3/7, NF-κB | IFNB, CXCL10 |
| RIG-I-like Receptors (RLRs) | MAVS | IKKε, TBK1 -> IKK | IRF3/7, NF-κB | IFNB, IFNA4 |
| NOD-like Receptors (NLRs) | RIP2 | TAK1 -> IKK | NF-κB | DEFB2, IL6 |
| C-type Lectin Receptors (CLRs) | CARD9 | BCL10/MALT1 -> IKK | NF-κB | IL1B, IL23 |
Experimental Protocols for PAMP Research
Protocol 1: Assessing TLR4 Activation by LPS in Primary Macrophages
Objective: To measure NF-κB activation and cytokine production upon LPS challenge.
- Cell Preparation: Isolate primary murine bone marrow-derived macrophages (BMDMs) and culture in 24-well plates (5 x 10^5 cells/well).
- Stimulation: Treat cells with ultrapure E. coli K12 LPS (1-100 ng/mL) in serum-free medium for timepoints ranging from 15 min (signaling) to 6-24h (cytokine secretion). Include controls: vehicle and a TLR4 inhibitor (e.g., TAK-242, 1µM, pre-incubated 1h).
- Signaling Readout (Western Blot): Lyse cells in RIPA buffer at 15, 30, 60 min post-stimulation. Resolve proteins via SDS-PAGE. Probe for phospho-IκBα (Ser32), total IκBα, and β-actin loading control.
- Cytokine Readout (ELISA): Collect supernatant at 6h (TNF-α) and 24h (IL-6). Use Quantikine ELISA kits per manufacturer's protocol.
- Nuclear Translocation (Immunofluorescence): Fix cells at 30 min, permeabilize, stain with anti-NF-κB p65 antibody and DAPI. Quantify nuclear/cytoplasmic fluorescence ratio.
Protocol 2: Detecting Cytosolic RNA PAMPs via RIG-I
Objective: To quantify type I interferon response to 5'-triphosphate RNA (3pRNA).
- Ligand Preparation: Generate 3pRNA by in vitro transcription from a linearized plasmid using T7 RNA polymerase (non-cap analog). Purify via phenol-chloroform extraction and DNase I treatment. Verify integrity by gel electrophoresis.
- Cell Transfection: Seed HEK 293T cells (which express RIG-I but not TLRs robustly) in 12-well plates. Transfect with 0.5 µg of 3pRNA using a transfection reagent (e.g., Lipofectamine 2000, 1:2 RNA:reagent ratio). Use transfected poly(I:C) (1 µg) as a positive control for MDA5 activation.
- Luciferase Reporter Assay: Co-transfect cells with an IFN-β promoter-driven firefly luciferase plasmid and a Renilla luciferase control plasmid (e.g., pRL-TK). At 24h post-transfection, lyse cells and measure dual-luciferase activity. Normalize firefly to Renilla signal.
- Validation: Knockdown RIG-I using siRNA (50 nM, 48h pre-transfection) and repeat assay to confirm signal dependence.
PAMP Signaling Pathway Visualizations
Diagram Title: TLR4 Signaling by LPS via MyD88 and TRIF Pathways
Diagram Title: Cytosolic RNA Sensing via the RIG-I-MAVS Signaling Axis
The Scientist's Toolkit: Key Research Reagent Solutions
Table 3: Essential Reagents for PAMP Research
| Reagent Category | Specific Example(s) | Function & Purpose in Experimentation | Key Supplier(s) |
|---|---|---|---|
| Ultrapure PAMP Ligands | E. coli K12 LPS, Ultra-pure S. aureus LTA, High-MW poly(I:C) | Defined, low-contamination agonists for specific PRR activation; essential for clean signaling studies. | InvivoGen, Sigma-Aldrich |
| PRR-Specific Inhibitors | TAK-242 (TLR4), CU-CPT9a (TLR8), BX795 (TBK1/IKKε) | Pharmacological blockade to validate signaling pathway dependence and explore therapeutic targeting. | Tocris, MedChemExpress |
| Reporter Cell Lines | THP1-Blue NF-κB/AP1 cells, HEK-Blue hTLR4 cells | Engineered cells with secreted embryonic alkaline phosphatase (SEAP) under control of PRR-inducible promoters for high-throughput screening. | InvivoGen |
| ELISA Kits | Human/Mouse TNF-α, IL-6, IFN-β Quantikine ELISA | Gold-standard quantitative measurement of cytokine/chemokine output downstream of PAMP recognition. | R&D Systems |
| Phospho-Specific Antibodies | Anti-phospho-IκBα (Ser32), Anti-phospho-IRF3 (Ser386) | Critical for detecting activation states of signaling intermediates via Western blot or flow cytometry. | Cell Signaling Technology |
| Transfection Reagents | Lipofectamine 2000, TransIT-mRNA, Fugene HD | Deliver cytosolic PAMPs (e.g., RNA, DNA) or expression plasmids for PRRs/adaptors into mammalian cells. | Thermo Fisher, Mirus Bio |
| NOD Agonists | MDP (MurNAc-L-Ala-D-isoGln), iE-DAP | Synthetic, defined ligands for activating cytosolic NLRs like NOD2 and NOD1, respectively. | InvivoGen, Bachem |
| CRISPR/Cas9 Kits | PRR-KO (e.g., TLR4, RIG-I, MAVS) kits | Generate genetically engineered cell lines to conclusively demonstrate the necessity of a specific PRR pathway. | Santa Cruz Biotech, Synthego |
Within the broader thesis on How PAMPs activate innate immune response research, Pattern Recognition Receptors (PRRs) serve as the foundational sentinels that detect Pathogen-Associated Molecular Patterns (PAMPs). This in-depth technical guide provides a comprehensive overview of the four principal PRR families: Toll-like Receptors (TLRs), NOD-like Receptors (NLRs), RIG-I-like Receptors (RLRs), and C-type Lectin Receptors (CLRs). Their activation initiates complex signaling cascades leading to the production of inflammatory cytokines, type I interferons, and other antimicrobial effectors, orchestrating the first line of host defense and shaping adaptive immunity.
Toll-like Receptors (TLRs)
TLRs are transmembrane receptors located on the plasma membrane or endosomal membranes. They recognize a diverse array of PAMPs, including lipids, lipoproteins, proteins, and nucleic acids.
Signaling Pathways
TLR signaling bifurcates into two primary pathways: the MyD88-dependent pathway, used by all TLRs except TLR3, leading to NF-κB and MAPK activation and pro-inflammatory cytokine production; and the TRIF-dependent pathway, used by TLR3 and TLR4, leading to IRF3 activation and type I interferon (IFN) production.
Key Quantitative Data
Table 1: TLR Family Members, Ligands, and Localization
| TLR | Primary PAMP Ligands (Examples) | Localization | Adaptor Proteins |
|---|---|---|---|
| TLR1/TLR2 | Triacylated lipopeptides (Bacteria) | Plasma Membrane | MyD88/MAL |
| TLR3 | Double-stranded RNA (Viruses) | Endosome | TRIF |
| TLR4 | Lipopolysaccharide - LPS (Gram-negative bacteria) | Plasma Membrane | MyD88/MAL, TRIF/TRAM |
| TLR5 | Flagellin (Bacteria) | Plasma Membrane | MyD88 |
| TLR7/8 | Single-stranded RNA (Viruses) | Endosome | MyD88 |
| TLR9 | CpG DNA (Bacteria, Viruses) | Endosome | MyD88 |
NOD-like Receptors (NLRs)
NLRs are cytosolic sensors that detect intracellular PAMPs and danger-associated molecular patterns (DAMPs). Key members include NOD1, NOD2, and NLRP3.
Signaling and Inflammasome Activation
NOD1/2 recognition of bacterial peptidoglycan fragments leads to NF-κB and MAPK activation. Certain NLRs, like NLRP3, form multi-protein complexes called inflammasomes in response to crystalline structures, ATP, or pore-forming toxins, leading to caspase-1 activation and maturation of IL-1β and IL-18.
RIG-I-like Receptors (RLRs)
RLRs (RIG-I, MDA5, LGP2) are cytosolic RNA helicases that detect viral RNA, a key mechanism for antiviral defense.
Antiviral Signaling Pathway
Upon binding to viral RNA, RIG-I or MDA5 undergoes a conformational change and interacts with the mitochondrial adaptor MAVS. This nucleates a signaling complex that leads to the phosphorylation and activation of IRF3 and IRF7, driving type I IFN gene expression.
Key Quantitative Data
Table 2: RLR Family Members and Specificity
| RLR | Structural Features | Primary Viral RNA Ligand | Key Adaptor |
|---|---|---|---|
| RIG-I | 2x CARD domains, Helicase domain, CTD | Short dsRNA with 5'-triphosphate, blunt ends | MAVS |
| MDA5 | 2x CARD domains, Helicase domain | Long dsRNA (>1 kbp) | MAVS |
| LGP2 | Helicase domain, no CARD | Regulatory role, binds RNA | Modulates RIG-I/MDA5 |
C-type Lectin Receptors (CLRs)
CLRs are primarily transmembrane receptors that recognize carbohydrate structures (e.g., β-glucans, mannose) on fungi, mycobacteria, and other pathogens.
Signaling Outcomes
CLR signaling, mediated by kinases like Syk, can lead to diverse immune responses, including phagocytosis, ROS production, and cytokine polarization (e.g., via CARD9/Bcl10/MALT1 complex to NF-κB). Some CLRs (e.g., Dectin-1) can also induce inflammasome formation.
Experimental Protocols
Protocol 1: Assessing TLR4 Activation via NF-κB Reporter Assay
Objective: To quantify TLR4 pathway activation in response to LPS. Method:
- Cell Culture: Seed HEK293 cells stably expressing human TLR4/MD2/CD14 in a 96-well plate.
- Transfection: Co-transfect cells with an NF-κB-driven firefly luciferase reporter plasmid and a Renilla luciferase control plasmid (for normalization) using a suitable transfection reagent. Incubate for 24h.
- Stimulation: Treat cells with a dose range of ultrapure LPS (e.g., 0.1-1000 ng/mL) for 6-8 hours. Include controls: media only (negative) and a known TLR4 agonist (positive).
- Lysis & Measurement: Lyse cells using Passive Lysis Buffer. Measure firefly and Renilla luciferase activities sequentially using a dual-luciferase reporter assay system on a luminometer.
- Analysis: Calculate the ratio of firefly/Renilla luminescence. Plot normalized Relative Luminescence Units (RLU) vs. LPS concentration to determine EC50.
Protocol 2: NLRP3 Inflammasome Activation and IL-1β Secretion Assay
Objective: To measure NLRP3 inflammasome-dependent IL-1β maturation in primary macrophages. Method:
- Cell Priming: Differentiate human monocytic THP-1 cells into macrophages with PMA (e.g., 100 nM, 24h). Wash and rest cells for 24h in fresh media.
- Signal 1 (Priming): Treat cells with a low dose of LPS (e.g., 100 ng/mL, 3-4h) to induce pro-IL-1β and NLRP3 expression via the NF-κB pathway.
- Signal 2 (Activation): Stimulate primed cells with a known NLRP3 activator (e.g., 5 mM ATP for 1h, or 10-50 μM nigericin for 1h) to trigger inflammasome assembly.
- Sample Collection: Collect cell culture supernatants. Centrifuge to remove debris.
- Analysis: Quantify mature IL-1β in supernatants using a specific ELISA kit according to the manufacturer's instructions. Use western blot on cell lysates to confirm caspase-1 cleavage (p10/p20 subunits) as an additional readout.
Protocol 3: Measuring RIG-I-mediated IFN-β Induction
Objective: To detect RIG-I pathway activation by synthetic RNA ligand. Method:
- Cell Transfection: Seed A549 or HEK293 cells in a 12-well plate. At ~80% confluence, transfert cells with a synthetic 5'-triphosphate double-stranded RNA (3p-hpRNA, a RIG-I ligand) using a transfection reagent optimized for nucleic acids (e.g., Lipofectamine 2000). Use a control dsRNA without 5'ppp.
- Time Course: Incubate for 6, 12, and 24 hours post-transfection.
- RNA Extraction: Harvest cells and isolate total RNA using a column-based kit. Treat with DNase I.
- cDNA Synthesis: Perform reverse transcription with random hexamers.
- qPCR: Perform quantitative PCR using TaqMan or SYBR Green probes specific for human IFNB1 mRNA. Normalize to a housekeeping gene (e.g., GAPDH, ACTB). Calculate fold induction over mock-transfected control using the 2^(-ΔΔCt) method.
The Scientist's Toolkit: Key Research Reagent Solutions
Table 3: Essential Reagents for PRR Research
| Reagent / Material | Function / Application | Example (Note: not brand endorsement) |
|---|---|---|
| Ultrapure LPS (TLR4 Agonist) | Specific activation of TLR4 without contamination by other TLR ligands. Used in TLR4 signaling studies, endotoxin research. | E. coli K12 LPS, prepared via phenol extraction. |
| Poly(I:C) (HMW & LMW) | Synthetic dsRNA analog. HMW primarily activates TLR3; LMW or transfection activates RLRs (MDA5/RIG-I). | High Molecular Weight (HMW) for TLR3; Low Molecular Weight (LMW) for RLRs. |
| MDP (Muramyl Dipeptide) | Minimal bioactive peptidoglycan motif; specific ligand for intracellular NOD2 receptor. | Synthetic, cell-permeable MDP for NLR studies. |
| Nigericin (Potassium Ionophore) | A potent activator of the NLRP3 inflammasome (Signal 2) by inducing K+ efflux. | Used at 5-20 μM in in vitro inflammasome assays. |
| NF-κB Luciferase Reporter Plasmid | Contains NF-κB response elements upstream of luciferase gene. Measures canonical TLR/NOD pathway output. | Often used with a constitutively expressed Renilla luciferase plasmid for normalization. |
| Caspase-1 p20 Antibody | Detects the active cleaved subunit of caspase-1 by western blot, confirming inflammasome activation. | Specific monoclonal antibody for human/mouse caspase-1 p20. |
| Phorbol 12-myristate 13-acetate (PMA) | Differentiates monocytic cell lines (e.g., THP-1, U937) into macrophage-like cells for host-pathogen interaction studies. | Used at 50-100 nM for 24-48 hours. |
| MAVS (IPS-1) Knockout Cell Line | Genetic tool to definitively link observed signaling phenotypes to the RLR pathway. | CRISPR/Cas9-generated HEK293 or HeLa MAVS-/- cells. |
| Syk Kinase Inhibitor (e.g., R406) | Pharmacological inhibitor to probe CLR (e.g., Dectin-1) signaling dependency on the Syk kinase pathway. | Used at specified IC50 concentrations in pretreatment experiments. |
| ELISA Kits for Cytokines (IL-1β, IL-6, TNFα, IFN-β) | Gold-standard for quantitative, specific measurement of cytokine protein secretion in supernatants or serum. | Commercial kits with matched antibody pairs and recombinant standards. |
The innate immune system provides the first line of defense against pathogens through rapid detection of conserved Pathogen-Associated Molecular Patterns (PAMPs) via Pattern Recognition Receptors (PRRs). The ensuing signal transduction cascades culminate in the activation of transcription factors, notably Nuclear Factor kappa B (NF-κB) and Interferon Regulatory Factors (IRFs), which drive the expression of pro-inflammatory cytokines and type I interferons (IFNs). This whitepaper details these pathways and associated research methodologies within the broader thesis context of understanding how PAMPs activate the innate immune response.
Core Signaling Pathways
PRRs, such as Toll-like receptors (TLRs), RIG-I-like receptors (RLRs), and cytosolic DNA sensors, initiate distinct but often converging pathways.
2.1. The Canonical NF-κB Activation Pathway Engagement of receptors like TLR4 by LPS recruits adaptor proteins (MyD88, TRIF), leading to the activation of the IκB kinase (IKK) complex. IKK phosphorylates the inhibitor IκBα, targeting it for ubiquitination and proteasomal degradation. This releases NF-κB dimers (e.g., p50/p65) for nuclear translocation and gene transcription.
2.2. The IRF3/7 Activation Pathway Mainly downstream of endosomal TLRs (TLR3, TLR4 via TRIF, TLR7/9 via MyD88) and RLRs, this pathway involves the recruitment and activation of Tank-binding kinase 1 (TBK1) and IKKε. These kinases directly phosphorylate IRF3 and IRF7, inducing their dimerization, nuclear import, and initiation of IFN-α/β gene expression.
Diagram: TLR4-Mediated NF-κB and IRF3 Activation
Key Quantitative Data in PAMP Signaling
Table 1: Kinetic Parameters of Key Signaling Events Upon TLR4 Stimulation (Representative Data)
| Event | Time to Onset (Post-Stimulation) | Peak Activity | Key Readout | Reference Assay |
|---|---|---|---|---|
| IRAK1/4 Autophosphorylation | 1-2 min | 5-10 min | Phospho-IRAK1 (Thr209) | Western Blot / In-cell ELISA |
| IKK Complex Activation | 5-10 min | 15-30 min | Phospho-IKKα/β (Ser176/180) | Kinase Activity Assay |
| IκBα Degradation | 10-15 min | 20-30 min | Total IκBα Protein | Western Blot |
| NF-κB Nuclear Translocation | 15-30 min | 30-60 min | p65 Nuclear Intensity | Immunofluorescence / Imaging Flow Cytometry |
| IRF3 Phosphorylation | 30-45 min | 60-90 min | Phospho-IRF3 (Ser386) | Western Blot |
| Cytokine mRNA Induction | 30 min | 2-4 hrs | TNFα, IL6, IFNβ mRNA | qRT-PCR |
| Secreted Cytokine Protein | 2-4 hrs | 6-12 hrs | TNFα, IL6, IFNβ in Supernatant | ELISA / MSD |
Detailed Experimental Protocols
4.1. Protocol: Assessing NF-κB Activation by Electrophoretic Mobility Shift Assay (EMSA)
- Objective: To detect and quantify active NF-κB dimers capable of binding DNA in nuclear extracts.
- Materials: Cell line (e.g., RAW 264.7, THP-1), TLR agonist (e.g., LPS), Nuclear Extract Kit, [γ-³²P]ATP or biotin-labeled oligonucleotide probe containing NF-κB consensus sequence (5'-GGGACTTTCC-3'), poly(dI-dC), non-denaturing polyacrylamide gel, transfer membrane (for chemiluminescent detection).
- Procedure:
- Stimulation & Extraction: Stimulate 2x10⁶ cells with LPS (e.g., 100 ng/ml) for relevant times (e.g., 0, 15, 30, 60 min). Prepare nuclear extracts using a commercial kit, quantifying protein concentration.
- Probe Labeling: End-label 50 ng of dsDNA oligonucleotide probe with [γ-³²P]ATP using T4 polynucleotide kinase, or use a pre-biotinylated probe.
- Binding Reaction: Incubate 5-10 µg nuclear extract with 1 µg poly(dI-dC) and 0.1-0.5 ng labeled probe in binding buffer (10 mM HEPES, 50 mM KCl, 1 mM DTT, 2.5% glycerol, 0.05% NP-40) for 20 min at room temperature.
- Competition/Supershift: For specificity, include a 100-fold molar excess of unlabeled wild-type or mutant probe. For subunit identification, pre-incubate extract with 2 µg of anti-p65 or anti-p50 antibody for 30 min before adding the probe.
- Electrophoresis: Load samples on a pre-run 6% non-denaturing polyacrylamide gel in 0.5x TBE. Run at 100V at 4°C until dye front migrates sufficiently.
- Detection: For radioactive probes, dry gel and expose to phosphorimager screen. For biotinylated probes, transfer to nylon membrane, crosslink, and detect with streptavidin-HRP.
4.2. Protocol: Measuring IRF3 Activation by Dimerization Assay (Native PAGE)
- Objective: To detect phosphorylated, dimeric IRF3, which is a hallmark of its activation.
- Materials: Cells, RLR agonist (e.g., poly(I:C) transfection) or STING agonist (e.g., cGAMP), Native Sample Buffer, Tris-Glycine gels (without SDS), TBK1/IKKε inhibitor (e.g., BX795) as control.
- Procedure:
- Stimulation: Stimulate cells (e.g., primary macrophages) to activate the cytosolic pathway. Include an inhibitor control (e.g., 1 µM BX795, pre-treated 1 hr).
- Cell Lysis: Lyse cells in ice-cold native lysis buffer (1% Triton X-100, 20 mM Tris pH 7.5, 150 mM NaCl, 10% glycerol, protease/phosphatase inhibitors). Do not boil or add SDS or reducing agents.
- Native PAGE: Prepare a 7.5% Tris-Glycine gel without SDS. Mix lysates (20-50 µg protein) with native sample buffer (62.5 mM Tris pH 6.8, 25% glycerol, 0.01% Bromophenol Blue). Load and run in native running buffer (25 mM Tris, 192 mM Glycine) at 100V, 4°C, until complete.
- Western Blot: Transfer to PVDF membrane using standard wet transfer. Probe with anti-IRF3 antibody. The dimeric form (≈120 kDa) migrates slower than the monomeric form (≈55 kDa). Confirm activation by parallel phospho-IRF3 (Ser386) blot from denatured lysates.
The Scientist's Toolkit: Key Research Reagent Solutions
Table 2: Essential Reagents for Studying PAMP-Induced Signaling
| Reagent Category & Example | Specific Target/Function | Key Application in Pathway Research |
|---|---|---|
| TLR AgonistsUltra-pure LPS (TLR4), Poly(I:C) HMW (TLR3), Imiquimod (TLR7) | Specific PRR Ligand | Initiate defined signaling cascades for pathway dissection. |
| Kinase InhibitorsBAY 11-7082 (IKK), BX795 (TBK1/IKKε), Takinib (TAK1) | Key Signaling Kinases | Establish causal roles of specific nodes; validate assay readouts. |
| Phospho-Specific AntibodiesAnti-phospho-IκBα (Ser32/36), Anti-phospho-IRF3 (Ser386) | Activated Signaling Intermediates | Direct detection of pathway activation by Western, ELISA, or flow cytometry. |
| Reporter Cell LinesTHP1-Blue NF-κB/IRF, HEK293-hTLR4 | NF-κB/IRF-driven SEAP or Luciferase | High-throughput screening of agonists/antagonists; functional pathway readout. |
| Ubiquitination Assay KitsTRAF6 Ubiquitination Assay Kit (Active Motif) | E3 Ligase Activity | Study post-translational modifications critical for IKK and TBK1 activation. |
| Nuclear Translocation AssaysImage-iT LIVE NF-κB Translocation Kit (Invitrogen) | Subcellular Localization of p65 | Quantify NF-κB activation via high-content imaging or flow cytometry. |
| Cytokine DetectionV-PLEX Proinflammatory Panel 1 (MSD), ELISA Kits | Downstream Inflammatory Mediators | Measure functional output of pathway activation; multiplexing capability. |
Diagram: Experimental Workflow for Pathway Analysis
Within the broader thesis on how Pathogen-Associated Molecular Patterns (PAMPs) activate the innate immune response, the dysregulated overproduction of pro-inflammatory mediators—specifically Type I Interferons (IFNs), Tumor Necrosis Factor-alpha (TNF-α), and Interleukin-6 (IL-6)—represents a critical pathogenic transition point. This excessive, systemic release, termed a "cytokine storm," is a life-threatening complication of severe infections (e.g., COVID-19, influenza) and certain therapies. Understanding the precise molecular mechanisms governing the initiation of this cascade is fundamental for developing targeted immunomodulatory therapeutics.
PAMP Recognition and Initial Signaling Hubs
The production of Type I IFNs, TNF-α, and IL-6 is triggered by the engagement of Pattern Recognition Receptors (PRRs) by PAMPs. Different PRR families activate distinct but overlapping signaling pathways that converge on key transcription factors.
Key PRR Pathways
Toll-like Receptors (TLRs): TLR4 (recognizing LPS) and endosomal TLRs (e.g., TLR3 for dsRNA, TLR7/8 for ssRNA) are major initiators. TLR4 signals via both MyD88-dependent (leading to NF-κB/AP-1 and early-phase TNF-α/IL-6) and TRIF-dependent (leading to IRF3 and Type I IFN) pathways. TLR3 signals solely via TRIF, while TLR7/8/9 signal via MyD88, which can also activate IRF7 for Type I IFN production.
RIG-I-like Receptors (RLRs): Cytosolic sensors (RIG-I and MDA5) for viral RNA signal via the mitochondrial adapter MAVS, leading to the activation of both NF-κB and IRF3/IRF7.
Other Sensors: cGAS-STING pathway for cytosolic DNA activates IRF3 and NF-κB.
Core Transcription Factors
- NF-κB: Master regulator of TNF-α, IL-6, and other pro-inflammatory genes. Activated via canonical (IKKβ-dependent) and non-canonical pathways.
- IRF3 & IRF7: Critical for Type I IFN (IFN-α/β) gene transcription. IRF3 is constitutively expressed, while IRF7 is IFN-inducible, creating a positive feedback loop.
- AP-1: Heterodimer (e.g., c-Fos/c-Jun) that cooperates with NF-κB to enhance pro-inflammatory gene expression.
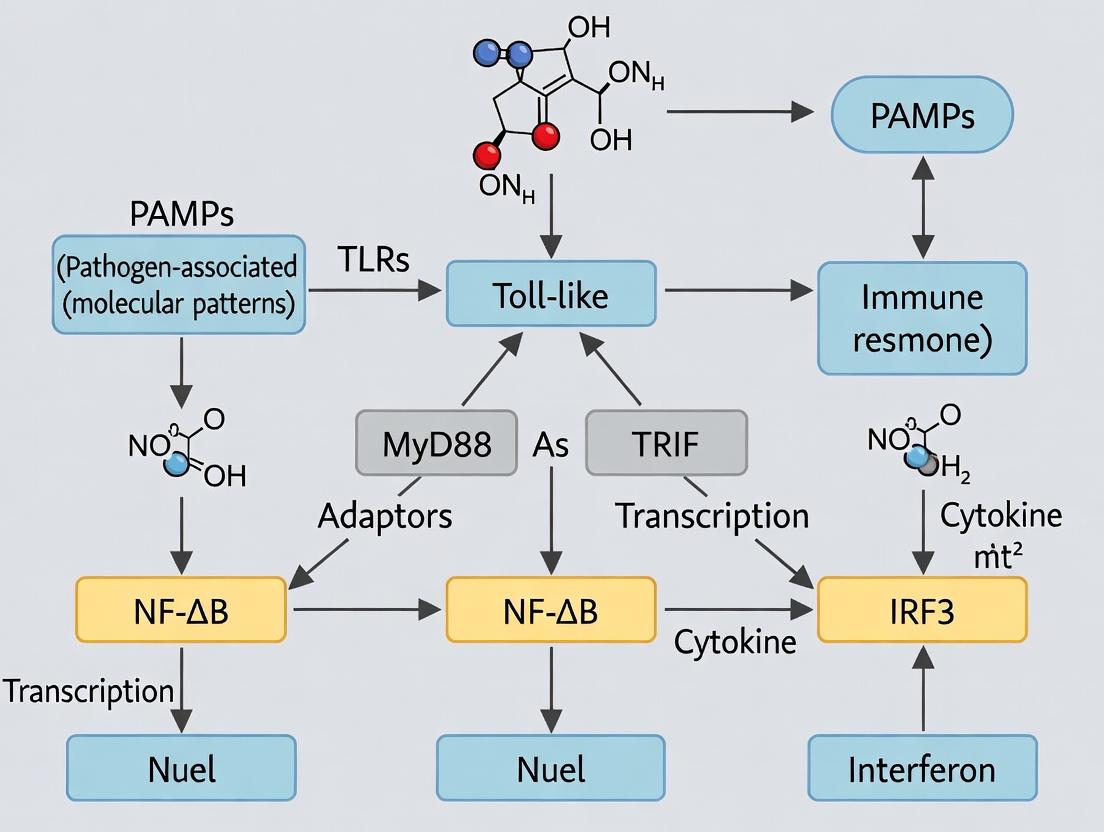
Figure 1: Core Signaling Pathways from PAMPs to Pro-inflammatory Mediators
Quantitative Data on Cytokine Dynamics
Table 1: Representative Quantitative Data on Key Cytokines in Clinical & Experimental Cytokine Storms
| Cytokine | Normal Serum Level (pg/mL) | Severe COVID-19 / Sepsis (pg/mL) | Primary Cellular Source in Storm | Key Activating PRR Pathway |
|---|---|---|---|---|
| TNF-α | < 5 - 10 | 20 - 100+ | Macrophages, Monocytes, T cells | TLR4/MyD88, TLR3/TRIF |
| IL-6 | < 1 - 5 | 50 - 10,000+ | Macrophages, Dendritic cells, Fibroblasts | TLR4/MyD88, RLR/MAVS |
| IFN-α | < 10 - 20 | 100 - 1,000+ (variable) | pDCs (IFN-α), Macrophages | TLR7/MyD88/IRF7, cGAS-STING |
| IFN-β | Low/undetectable | Elevated | Fibroblasts, Macrophages | TLR3/TRIF/IRF3, RLR/MAVS |
Table 2: Common Experimental Models for Studying Cytokine Storm Initiation
| Model System | Inducing Agent (PAMP Mimic) | Key Readouts | Advantages | Limitations |
|---|---|---|---|---|
| Human PBMCs | LPS (TLR4), R848 (TLR7/8), Poly(I:C) (TLR3) | Cytokine ELISA/MSD, qPCR (mRNA), phospho-flow | Primary human cells, high relevance. | Donor variability, limited in vivo context. |
| Mouse (in vivo) | LPS, Poly(I:C), viral infection (e.g., influenza) | Serum cytokines, histopathology, survival. | Whole-system physiology. | Mouse-human cytokine differences. |
| Macrophage Cell Lines (e.g., THP-1, RAW264.7) | Various PAMPs | Signaling studies (WB), supernatant cytokines. | Reproducible, genetically tractable. | May not fully replicate primary cell behavior. |
Detailed Experimental Protocols
Protocol:In VitroCytokine Storm Induction in Human Primary Macrophages
Objective: To measure the synergistic production of TNF-α, IL-6, and Type I IFNs following stimulation with combined PAMPs.
Materials: See "The Scientist's Toolkit" below.
Method:
- Monocyte Isolation & Differentiation: Isolate CD14+ monocytes from human PBMCs using magnetic beads. Culture monocytes for 6-7 days in RPMI-1640 + 10% FBS + 50 ng/mL recombinant human M-CSF to differentiate into M0 macrophages.
- Priming and Stimulation: Seed macrophages at 5x10^5 cells/well in a 24-well plate.
- Group 1 (Control): Media only.
- Group 2 (TLR4): 100 ng/mL ultrapure LPS.
- Group 3 (RLR): 1 μg/mL high-molecular-weight Poly(I:C) transfected using 1 μL/μg lipofectamine 2000.
- Group 4 (Synergistic): LPS (100 ng/mL) + transfected Poly(I:C) (1 μg/mL).
- Sample Collection:
- Supernatant: Collect at 6h (peak TNF-α) and 24h (peak IL-6/IFN-β). Centrifuge to clear cells, aliquot, and store at -80°C.
- Cell Lysate: For signaling analysis, lyse cells in RIPA buffer at 30, 60, and 120 min post-stimulation for phospho-protein immunoblotting.
- Analysis:
- Cytokine Quantification: Use high-sensitivity ELISA or multiplex electrochemiluminescence (MSD) assay kits per manufacturer's instructions for TNF-α, IL-6, and IFN-β.
- Signaling Analysis: Perform Western blotting for phospho-IRF3 (Ser396), phospho-IκBα, and total proteins.
Protocol: Assessing Signaling Pathway Dependency using Pharmacological Inhibitors
Objective: To dissect the contribution of specific kinases (IKKβ, TBK1) to cytokine production.
Method:
- Pre-treat macrophages for 1 hour with:
- IKKβ inhibitor (e.g., IMD-0354, 10 μM)
- TBK1 inhibitor (e.g., BX795, 5 μM)
- DMSO vehicle control.
- Stimulate with inducing agents (e.g., LPS+Poly(I:C)) as in Protocol 4.1.
- Collect supernatants and lysates.
- Expected Outcome: IKKβ inhibition will ablate TNF-α and IL-6 but spare IFN-β. TBK1 inhibition will primarily reduce IFN-β but may partially affect IL-6.
The Scientist's Toolkit
Table 3: Key Research Reagent Solutions for Cytokine Storm Studies
| Reagent / Material | Supplier Examples | Function / Specificity | Key Application |
|---|---|---|---|
| Ultrapure LPS (E. coli K12) | InvivoGen, Sigma-Aldrich | TLR4 agonist; minimal protein contamination. | Specific activation of TLR4-MyD88/TRIF pathways. |
| High-Molecular-Weight Poly(I:C) | InvivoGen, MilliporeSigma | Synthetic dsRNA; agonist for TLR3 (endosomal) and RIG-I/MDA5 (transfected). | Mimics viral infection, induces Type I IFNs & IL-6. |
| R848 (Resiquimod) | Tocris, InvivoGen | Synthetic imidazoquinoline; agonist for TLR7/8. | Activates MyD88-IRF7 pathway in pDCs for IFN-α. |
| cGAMP | InvivoGen, Merck | STING agonist; cyclic dinucleotide. | Direct activator of the cGAS-STING-DNA sensing pathway. |
| Recombinant Human M-CSF | PeproTech, R&D Systems | Differentiates human monocytes into M0 macrophages. | Generating primary macrophage models. |
| Phospho-IRF3 (Ser396) Antibody | Cell Signaling Tech | Detects activated, phosphorylated IRF3. | Confirming IRF3 pathway activation via WB/IF. |
| MSD U-PLEX Assay Kits | Meso Scale Discovery | Multiplex electrochemiluminescence for cytokine detection. | Simultaneous, high-sensitivity quantitation of multiple cytokines from small sample volumes. |
| IKKβ Inhibitor (IMD-0354) | Tocris, MedChemExpress | Selective ATP-competitive inhibitor of IKKβ. | Dissecting NF-κB-dependent cytokine production. |
| TBK1 Inhibitor (BX795) | Selleckchem, Abcam | Potent and selective inhibitor of TBK1/IKKε. | Blocking IRF3 activation and Type I IFN production. |
1. Introduction Pathogen-Associated Molecular Patterns (PAMPs), once defined strictly as exogenous motifs from microbes, are now recognized as key drivers of inflammation in the absence of infection—a state termed sterile inflammation. This paradigm shift implicates endogenous molecules, termed damage-associated molecular patterns (DAMPs), and, controversially, host-derived molecules that can structurally mimic PAMPs, in perpetuating chronic disease. This whitepaper details the mechanisms of PAMP-mimicry in sterile inflammation, experimental approaches for its study, and its implications for therapeutic intervention, framed within the broader thesis of understanding how PAMP-sensing machinery activates the innate immune response.
2. Mechanisms of PAMP Recognition in Sterile Contexts In sterile inflammation, pattern recognition receptors (PRRs) such as Toll-like receptors (TLRs) and NOD-like receptors (NLRs) are activated not by microbes, but by endogenous ligands that share molecular or structural homology with canonical PAMPs.
- Molecular Mimicry: Host-derived nucleic acids (e.g., mitochondrial DNA, self-RNA), extracellular matrix components (e.g., hyaluronan fragments), and heat-shock proteins can engage TLRs (TLR9, TLR7/8, TLR4, TLR2) typically reserved for bacterial or viral products.
- Bystander Sensing of Non-Host PAMPs: PAMPs from commensal microbiota (e.g., bacterial LPS, peptidoglycan) can translocate across compromised epithelial barriers (a "leaky gut") into systemic circulation, activating immune responses in sterile tissues.
- Integrated Stress Response: Cellular stress (oxidative, ER) leads to the release of DAMPs and the upregulation of endogenous molecules that form complexes capable of activating PRR pathways.
3. Key Signaling Pathways: From PRR Engagement to Inflammation The core signaling cascades initiated by PAMP/DAMP engagement converge on NF-κB and IRF transcription factors, driving pro-inflammatory cytokine (TNF-α, IL-1β, IL-6, type I IFNs) and chemokine production.
Diagram 1: TLR4 Signaling in Sterile Inflammation
4. Experimental Protocols for PAMP Research in Sterile Models 4.1. Protocol: Assessing Endosomal TLR Activation by Self-Nucleic Acids
- Objective: To determine if host-derived nucleic acids activate TLR7/8/9 in antigen-presenting cells.
- Materials: Primary bone marrow-derived dendritic cells (BMDCs) from WT and Tlr7/9 KO mice, synthetic TLR agonists (R848, CpG ODN), purified mitochondrial DNA (mtDNA) or self-RNA from cell lines, transfection reagent (e.g., Lipofectamine 2000), ELISA kits for IFN-α and IL-6.
- Method:
- Isolate and culture BMDCs for 7 days.
- Seed BMDCs (1x10^5/well) in a 96-well plate.
- Stimulate: a) media control, b) R848/CpG (positive control), c) naked mtDNA/RNA (10-1000 ng/mL), d) transfected mtDNA/RNA (complexed with Lipofectamine, 100 ng/mL).
- Incubate for 18-24h.
- Collect supernatants for cytokine ELISA and cells for flow cytometry (CD86/MHC-II upregulation).
- Key Control: Include Tlr7/9 KO BMDCs to confirm specificity.
- Interpretation: Significant cytokine production/activation only with transfected self-nucleic acids in WT, but not KO cells, confirms endosomal TLR engagement.
4.2. Protocol: In Vivo Model of Microbiota-Derived PAMP Translocation
- Objective: To model and measure systemic inflammation due to gut barrier breach.
- Materials: C57BL/6 mice, dextran sulfate sodium (DSS), FITC-dextran (4 kDa), serum endotoxin (LPS) detection kit (LAL assay), anti-LPS ELISA, tissue collection supplies.
- Method:
- Induce colitis by administering 2-3% DSS in drinking water for 5-7 days.
- On day 6, orally gavage mice with FITC-dextran (600 mg/kg).
- After 4h, collect blood via cardiac puncture.
- Measure serum FITC-dextran fluorescence (ex/em: 485/535) to quantify gut permeability.
- Use separate serum for LAL assay to quantify circulating endotoxin.
- Analyze colonic and liver tissue for histology (H&E) and phospho-NF-κB p65 immunohistochemistry.
- Interpretation: Correlated increases in serum FITC-dextran, endotoxin, and hepatic inflammation demonstrate systemic sterile inflammation driven by translocated bacterial PAMPs.
5. Quantitative Data in Sterile Inflammatory Diseases
Table 1: Clinical & Experimental Correlates of PAMP-Mediated Sterile Inflammation
| Disease Model / Context | Elevated PAMP/DAMP Ligand | PRR Implicated | Key Cytokine Elevation (Measured) | Experimental Intervention & Outcome |
|---|---|---|---|---|
| Atherosclerosis (Human plaques, murine ApoE-/- model) | Oxidized LDL, HSP60, bacterial LPS (from gut/soral microbiota) | TLR2, TLR4 | IL-1β (2-5 fold ↑ in plaque), TNF-α | TLR4 antagonist TAK-242 reduces plaque area by ~40% in mice. |
| Systemic Lupus Erythematosus (SLE patient serum, MRL/lpr mouse) | Self-DNA/RNA immune complexes, mitochondrial DNA | TLR7, TLR9 | IFN-α (serum: >50 pg/mL vs. undetectable in healthy) | Anti-TLR7 monoclonal antibody reduces IFN signature and glomerulonephritis. |
| Alcoholic & NAFLD (Patient liver biopsies, mouse ethanol/choline-deficient models) | Serum endotoxin (LPS), HMGB1, mtDNA | TLR4, TLR9 | IL-1β, IL-6 (hepatic mRNA ↑ 10-20 fold) | Gut sterilization (antibiotics) or TLR4 KO abrogates steatohepatitis. |
| Rheumatoid Arthritis (Synovial fluid, CIA mouse model) | Citrullinated proteins, HSPs, bacterial peptidoglycan | TLR2, TLR4 | TNF-α, IL-6 (synovial fluid: ng/mL range) | TLR2/4 dual inhibitor reduces joint swelling and erosion score by >50%. |
6. The Scientist's Toolkit: Key Research Reagents
Table 2: Essential Reagents for Studying PAMPs in Sterile Inflammation
| Reagent / Solution | Primary Function in Research | Example & Rationale |
|---|---|---|
| PRR-Specific Agonists & Antagonists | Positive controls and pathway inhibition. | Ultrapure LPS (TLR4), R848 (TLR7/8), CpG ODN (TLR9). TAK-242 (TLR4 inhibitor), ODN TTAGGG (TLR9 antagonist). Essential for validating receptor involvement. |
| Recombinant DAMP Proteins | Stimulate cells with defined endogenous ligands. | HMGB1, S100A8/A9 proteins. Used to directly test their inflammatory potential on PRR-expressing cells. |
| Neutralizing/Antibody Arrays | Detect and quantify multiple PAMPs/DAMPs and cytokines. | Mouse/Ruman Cytokine 30-plex Array, HMGB1 ELISA, LAL Assay for Endotoxin. Allows comprehensive profiling of inflammatory mediators. |
| Genetic Mouse Models | Establish causal roles of specific PRRs in vivo. | Global or cell-specific Tlr2/4/7/9 KO, Myd88 KO, Nlrp3 KO mice. Gold standard for dissecting signaling pathways in disease models. |
| Transfection Reagents | Deliver nucleic acid PAMP/DAMPs to intracellular PRRs. | Lipofectamine 2000, polyethylenimine (PEI). Required to study endosomal TLR activation by self-DNA/RNA, mimicking immune complex internalization. |
| Gut Permeability Probes | Quantify breach of intestinal barrier. | FITC-dextran (4 kDa), Sugar absorption tests. Direct measurement of a critical step for microbiota-derived PAMP translocation. |
7. Conclusion and Therapeutic Outlook The involvement of PAMP-sensing pathways in sterile inflammation redefines their role from mere infection sentinels to central mediators of chronic disease pathogenesis. Therapeutic strategies now aim to selectively inhibit these pathways without compromising host defense. These include small-molecule PRR inhibitors, biologics targeting endogenous ligands (anti-HMGB1), and interventions to restore barrier integrity (pre/probiotics). Future research must delineate the precise structural features shared by pathogenic PAMPs and their endogenous mimics to enable the development of highly targeted immunomodulators, advancing the core thesis of PAMP-driven innate immune activation into a new era of precision medicine.
From Bench to Bedside: Techniques to Study PAMP Immunology and Therapeutic Applications
In the context of research on how Pathogen-Associated Molecular Patterns (PAMPs) activate the innate immune response, the selection of appropriate in vitro models is a critical determinant of experimental validity and biological relevance. This guide provides a technical overview of three foundational approaches: immortalized cell line stimulation, primary cell assays, and genetic reporter systems, each offering distinct advantages and limitations for dissecting innate immune signaling pathways.
Cell Line Stimulation
Immortalized cell lines provide a reproducible, scalable, and genetically tractable platform for initial PAMP screening and mechanistic studies.
Key Cell Lines in Innate Immunity Research
| Cell Line | Origin | Key Pattern Recognition Receptors (PRRs) Expressed | Common PAMP Stimuli | Primary Applications |
|---|---|---|---|---|
| THP-1 | Human monocytic leukemia | TLR2, TLR4, TLR5, TLR9, NOD2 | LPS (TLR4), Pam3CSK4 (TLR2/1), Flagellin (TLR5) | Monocyte/macrophage differentiation, cytokine profiling, NLRP3 inflammasome studies. |
| HEK293 | Human embryonic kidney | Low endogenous TLRs; often transfected | Used with overexpression of specific TLRs or adaptors | Signaling pathway deconstruction, receptor-ligand interaction studies, reporter assay host. |
| RAW 264.7 | Mouse macrophage | TLR4, TLR2, TLR9, others | LPS, Poly(I:C) (TLR3 mimic), CpG DNA (TLR9) | Mouse macrophage biology, phagocytosis assays, nitric oxide production. |
| U937 | Human histiocytic lymphoma | TLR2, TLR4 | Similar to THP-1 | Differentiation into macrophage-like cells, studies of inflammatory gene expression. |
Detailed Protocol: THP-1 Cell Stimulation with LPS for Cytokine Analysis
- Materials: THP-1 cells, RPMI-1640 + 10% FBS + 1% Pen/Strep, Phorbol 12-myristate 13-acetate (PMA), Ultrapure LPS (e.g., E. coli O111:B4), cell culture plates, ELISA or Luminex kits for TNF-α, IL-6, IL-1β.
- Method:
- Maintain THP-1 cells in suspension culture at 0.2-1.0 x 10^6 cells/mL.
- For differentiation, seed cells in 24-well plates at 2.5 x 10^5 cells/well in complete media containing 100 nM PMA. Incubate for 48-72 hours.
- Wash adherent, differentiated cells twice with warm PBS and rest in fresh media without PMA for 24 hours.
- Stimulate with a titration of LPS (e.g., 0.1, 1, 10, 100 ng/mL) for 4-24 hours. Include an unstimulated control.
- Collect supernatants by centrifugation (500 x g, 5 min) to remove cells/debris.
- Analyze cytokine levels via ELISA or multiplex assay according to manufacturer protocols.
- Data Interpretation: Dose- and time-dependent secretion of TNF-α and IL-6 confirms functional TLR4/MyD88/NF-κB signaling.
Primary Cell Assays
Primary cells, isolated directly from tissues (e.g., peripheral blood, bone marrow), offer physiological relevance with native receptor expression levels and metabolic states.
Comparison of Primary Innate Immune Cells
| Cell Type | Isolation Source | Key PAMP Sensors | Functional Readouts | Advantages | Challenges |
|---|---|---|---|---|---|
| Human Peripheral Blood Mononuclear Cells (PBMCs) | Blood (via density gradient) | Broad TLR repertoire, Cytosolic sensors | Cytokine secretion, cell surface marker (CD80/86, HLA-DR) upregulation, proliferation. | Contains multiple interacting cell types (monocytes, lymphocytes). Reflects donor variability. | Heterogeneous population; requires donor recruitment. |
| Bone Marrow-Derived Macrophages (BMDMs) | Mouse bone marrow (cultured with M-CSF) | TLRs, NLRs, inflammasomes | Cytokine release, phagocytosis, gene expression profiling, metabolic assays. | Can be polarized (M1/M2), genetically modified (from transgenic mice). | 7-10 day differentiation protocol; murine origin. |
| Human Monocyte-Derived Macrophages (hMDMs) | PBMC-derived CD14+ monocytes (cultured with GM-CSF or M-CSF) | Full complement of human PRRs | Similar to BMDMs; species-specific pathogen responses. | Most physiologically relevant human macrophage model. | Donor-to-donor variability; limited expansion capacity. |
Detailed Protocol: Isolation and Stimulation of Human PBMCs
- Materials: Leukopak or whole blood, Ficoll-Paque PLUS, PBS + 2% FBS, Cell strainers (70 µm), Centrifuge, LPS or other PAMPs.
- Method:
- Dilute blood 1:1 with PBS + 2% FBS.
- Carefully layer 35 mL of diluted blood over 15 mL of Ficoll-Paque in a 50 mL conical tube.
- Centrifuge at 400 x g for 30-35 minutes at 20°C with the brake OFF.
- Aspirate the upper plasma layer. Carefully collect the opaque PBMC layer at the interface and transfer to a new tube.
- Wash cells with 3-4 volumes of PBS + 2% FBS. Centrifuge at 300 x g for 10 min. Repeat wash.
- Count cells and resuspend in complete media (e.g., RPMI-1640 + 10% FBS).
- Seed plates at desired density (e.g., 1 x 10^6 cells/well in 24-well plate). Stimulate with PAMPs. Supernatants can be harvested typically at 6-24h for cytokine analysis.
Reporter Systems
Reporter assays quantify transcriptional activity downstream of PRR signaling, providing a sensitive, high-throughput readout.
Common Reporter Genes and Their Applications
| Reporter Gene | Detection Method | Dynamic Range | Key Advantage | Common Application in Innate Immunity |
|---|---|---|---|---|
| Luciferase (Firefly) | Bioluminescence (Luciferin substrate) | Very High (>10^7) | High sensitivity, low background. | NF-κB, IRF, or AP-1 pathway activation. |
| SEAP (Secreted Alkaline Phosphatase) | Colorimetry or Chemiluminescence of culture supernatant | High (>10^5) | Easy, non-lytic; enables kinetic monitoring. | High-throughput screening of TLR agonists/antagonists. |
| GFP/RFP | Fluorescence (Flow Cytometry, Microscopy) | Moderate (10^3) | Enables single-cell analysis and sorting. | Live-cell imaging of pathway activation heterogeneity. |
| NanoLuc | Bioluminescence (Furimazine substrate) | Very High | Brighter signal, smaller protein than firefly luc. | Sensitive measurement of weak promoter activity. |
Detailed Protocol: HEK293 TLR4 Reporter Assay for Agonist Screening
- Materials: HEK293 cells, reporter plasmid (e.g., NF-κB-firefly luciferase), co-transfection control (e.g., Renilla luciferase under constitutive promoter), expression plasmid for human TLR4/MD2/CD14, transfection reagent, Dual-Luciferase Reporter Assay System, LPS or test compounds.
- Method:
- Seed HEK293 cells in 96-well plates for transfection.
- Co-transfect cells with the TLR4/MD2/CD14 complex plasmids, the NF-κB-firefly luciferase reporter, and the constitutive Renilla luciferase control using a suitable transfection reagent.
- 24-48 hours post-transfection, stimulate cells with serial dilutions of test compounds or controls (ultrapure LPS as positive control, media as negative control) for 6-8 hours.
- Lyse cells and measure firefly and Renilla luciferase activities sequentially using the Dual-Luciferase Assay System on a luminometer.
- Data Analysis: Normalize firefly luciferase activity (NF-κB signal) to Renilla luciferase activity (transfection control) for each well. Plot fold-induction over untreated control versus agonist concentration.
The Scientist's Toolkit: Key Research Reagent Solutions
| Item | Function & Importance in PAMP Research | Example/Note |
|---|---|---|
| Ultrapure PAMPs | Defined, low-contamination ligands for specific PRRs (e.g., LPS for TLR4, Poly(I:C) for TLR3). Essential for specificity. | InvivoGen, Sigma-Aldrich. Critical to avoid contaminating endotoxins in other ligands. |
| PRR-Specific Inhibitors | Pharmacological tools to block specific pathways (e.g., TAK-242 for TLR4, MCC950 for NLRP3). Validates mechanistic involvement. | Available from Tocris, MedChemExpress. Requires careful dose-response and off-target effect assessment. |
| Cytokine Detection Kits | Quantify downstream immune outputs (ELISA, Luminex, Ella). Measures functional response to PAMP stimulation. | R&D Systems, BioLegend, Thermo Fisher. Multiplex panels enable kinetic profiling of many cytokines from small samples. |
| Reporter Plasmids | Engineered constructs with inducible promoters driving luciferase/GFP. Enables quantification of pathway activation. | Addgene repositories, Promega, Clontech. Often include minimal promoter with multiple transcription factor binding sites. |
| Cell Differentiation Kits | Standardized cytokine mixes (M-CSF, GM-CSF, IFN-γ) to polarize primary cells or cell lines into specific states (M1/M2 macrophages). | BioLegend, PeproTech. Ensures consistency in generating target cell types. |
| CRISPR/Cas9 Tools | For knockout of specific PRRs or signaling adaptors (e.g., MyD88, TRIF) in cell lines to establish genetic dependency. | Synthego, IDT. Enables generation of isogenic control and knockout lines for definitive functional studies. |
Visualization of Key Pathways and Workflows
TLR4-NFkB Pathway Diagram
Reporter Assay Workflow Diagram
Model Selection Logic Diagram
Within the broader thesis on how Pathogen-Associated Molecular Patterns (PAMPs) activate the innate immune response, understanding the precise biophysical nature of PAMP-PRR (Pattern Recognition Receptor) interactions is fundamental. These initial binding events dictate the specificity, amplitude, and kinetics of downstream signaling, ultimately determining the host's defensive outcome. This whitepaper provides an in-depth technical guide to advanced imaging and biophysical methodologies that enable researchers to dissect these critical interactions at molecular and cellular resolutions.
Core Biophysical & Imaging Techniques: Principles and Applications
High-Resolution Structural Imaging
Cryo-Electron Microscopy (Cryo-EM) and X-ray Crystallography remain pillars for determining static, high-resolution structures of PRRs (e.g., TLRs, NLRs, RLRs) in complex with their cognate PAMPs (e.g., LPS, dsRNA, flagellin).
- Protocol for Cryo-EM Sample Preparation & Data Collection:
- Complex Purification: Co-express and purify the PRR (e.g., TLR4-MD2 complex) and its PAMP (e.g., Lipid A). Ensure homogeneity via size-exclusion chromatography.
- Vitrification: Apply 3-4 µL of sample (~3 mg/mL) to a glow-discharged Quantifoil grid. Blot excess liquid and plunge-freeze in liquid ethane using a Vitrobot (blot time 3-6s, 100% humidity).
- Data Acquisition: Image grids on a 300 keV cryo-electron microscope (e.g., Titan Krios) equipped with a direct electron detector (e.g., Gatan K3). Collect ~5,000-10,000 movies at a nominal magnification of 105,000x (resulting pixel size ~0.83 Å), with a total electron dose of ~50 e⁻/Ų fractionated over 40 frames.
- Processing: Motion-correct and dose-weight frames. Perform particle picking, 2D classification, ab initio model generation, 3D refinement, and post-processing using software suites like RELION or cryoSPARC.
Quantifying Binding Kinetics and Affinity
Surface Plasmon Resonance (SPR) and Bio-Layer Interferometry (BLI) are label-free techniques for measuring real-time binding kinetics (ka, kd) and affinity (KD).
- Protocol for SPR Analysis of TLR5-Flagellin Interaction:
- Sensor Chip Preparation: Dock a Series S CM5 sensor chip into a Biacore T200 system. Prime with HBS-EP+ buffer (10 mM HEPES, 150 mM NaCl, 3 mM EDTA, 0.05% v/v Surfactant P20, pH 7.4).
- Ligand Immobilization: Activate carboxyl groups on flow cell 2 with a 1:1 mixture of 0.4 M EDC and 0.1 M NHS for 7 minutes. Inject anti-His antibody (10 µg/mL in 10 mM sodium acetate, pH 4.5) over the surface for ~10,000 RU. Deactivate with 1 M ethanolamine-HCl pH 8.5. Use flow cell 1 as a reference.
- Capture: Inject His-tagged TLR5 ectodomain (5 µg/mL) over flow cell 2 for 2 minutes, achieving a capture level of ~200 Response Units (RU).
- Binding Analysis: Inject a concentration series of purified flagellin (0.78 nM to 200 nM) over both flow cells at a flow rate of 30 µL/min for 180s association, followed by 300s dissociation. Regenerate surface with two 30s pulses of 10 mM glycine-HCl, pH 1.5.
- Data Processing: Subtract reference cell data. Fit the resulting sensograms globally to a 1:1 binding model using the Biacore Evaluation software to determine ka, kd, and KD.
Table 1: Representative Kinetic Data for PAMP-PRR Interactions
| PAMP | PRR | Technique | ka (1/Ms) | kd (1/s) | KD (nM) | Reference (Year) |
|---|---|---|---|---|---|---|
| Lipid IVa | TLR4/MD2 | SPR | 1.2 x 10^5 | 2.8 x 10^-3 | 23 | Park et al. (2012) |
| dsRNA (poly I:C) | TLR3 (ECD) | BLI | 5.7 x 10^4 | 4.1 x x10^-4 | 7.2 | Liu et al. (2008) |
| Flagellin | TLR5 (ECD) | SPR | 1.9 x 10^5 | 1.1 x 10^-3 | 5.8 | Yoon et al. (2012) |
| cGAMP | STING | ITC | N/A | N/A | 4.1 | Zhang et al. (2013) |
Imaging Spatiotemporal Dynamics in Live Cells
Total Internal Reflection Fluorescence (TIRF) Microscopy and Fluorescence Correlation Spectroscopy (FCS) reveal the real-time dynamics of PAMP-PRR interactions on plasma membranes.
- Protocol for TIRF Imaging of TLR4 Clustering upon LPS Stimulation:
- Cell Preparation: Seed RAW 264.7 macrophages stably expressing TLR4-GFP on a high-precision #1.5 glass-bottom dish. Culture for 24h.
- Stimulation & Imaging: Replace medium with pre-warmed, phenol-red free imaging buffer. Position dish on a TIRF microscope (e.g., Nikon N-STORM) equipped with a 100x oil immersion TIRF objective (NA 1.49) and a sCMOS camera. Set the TIRF laser (488 nm) to a critical angle achieving an evanescent field depth of ~100 nm. Acquire a time series (1 frame/10s for 10 minutes). At t=30s, add ultrapure LPS (100 ng/mL) via a micro-injector.
- Analysis: Use ImageJ/Fiji to quantify cluster formation. Apply a Gaussian blur, subtract background, and threshold to identify TLR4-GFP puncta. Track the mean fluorescence intensity and number of puncta per cell over time.
TIRF Workflow for LPS-TLR4 Dynamics
Mapping Nanoscale Organization
Stochastic Optical Reconstruction Microscopy (STORM) provides super-resolution imaging (<20 nm) to visualize the nanoscale organization of PRRs before and after activation.
- Protocol for dSTORM Imaging of NLRP3 Inflammasome Assembly:
- Sample Labeling: Differentiate THP-1 cells into macrophages, seed on coverslips, and stimulate with LPS (1 µg/mL, 4h) followed by nigericin (10 µM, 1h). Fix with 4% PFA. Permeabilize with 0.1% Triton X-100. Block with 5% BSA.
- Immunostaining: Incubate with primary antibodies against NLRP3 (mouse) and ASC (rabbit) overnight at 4°C. Label with secondary antibodies conjugated to photoswitchable dyes: anti-mouse Alexa Fluor 647 and anti-rabbit CF568.
- Imaging Buffer: Use a STORM imaging buffer: 50 mM Tris-HCl pH 8.0, 10 mM NaCl, 10% glucose, 0.5 mg/mL glucose oxidase, 40 µg/mL catalase, and 100 mM mercaptoethylamine (MEA).
- dSTORM Acquisition: Image on a Nikon N-STORM system with 640 nm and 561 nm lasers at high power (3-5 kW/cm²) in TIRF mode. Acquire 30,000-50,000 frames with an exposure time of 10-30 ms.
- Reconstruction & Analysis: Localize single-molecule blinking events using NIS-Elements or ThunderSTORM software. Render a super-resolution image. Calculate cluster size and intermolecular distances between NLRP3 and ASC signals.
Integrated Signaling Pathway Visualization
Core PAMP-PRR Signaling Pathway
The Scientist's Toolkit: Key Research Reagent Solutions
Table 2: Essential Materials for PAMP-PRR Interaction Studies
| Item | Function & Application | Example Product/Catalog # |
|---|---|---|
| Ultrapure PAMPs | Minimize confounding signaling from contaminants (e.g., endotoxin in flagellin prep). Essential for specific receptor activation. | InvivoGen tlrl-3pelps (ultrapure E. coli LPS) |
| Recombinant PRR Proteins | Full-length or ectodomain proteins for structural studies, SPR/BLI, and in vitro assays. | Sino Biological TNFRSF13B-31H (soluble TACI-Fc) |
| Fluorescent Protein-Conjugated PRRs/PAMPs | For live-cell imaging (TIRF, FRAP, confocal) of receptor trafficking and ligand binding. | Novus Biologicals FcyRIIA-eGFP Lentivirus |
| Photoactivatable/Photoswitchable Dyes | For super-resolution microscopy (STORM, PALM). Allows single-molecule localization. | Abberior STAR 580* or Alexa Fluor 647* |
| Biosensor Cell Lines | Reporter cells (e.g., SEAP, Lucia, GFP under NF-κB/ISG promoter) for functional validation of binding events. | InvivoGen HEK-Blue TLR4 cells |
| Microscopy-Specific Chambered Coverslips | #1.5H precision glass for high-resolution, live-cell imaging. Maintains cell health and optical clarity. | CellVis C4-1.5H-N (4-well plate) |
| Kinetics Analysis Software | For fitting and interpreting data from SPR, BLI, and other binding assays. | Sartorius BLItz Pro Software, Biacore Insight Evaluation Software |
Within the broader thesis investigating How PAMPs activate innate immune response research, the dual approach of genetic and pharmacological manipulation serves as a cornerstone for mechanistic discovery and therapeutic intervention. Pathogen-Associated Molecular Patterns (PAMPs) are recognized by a repertoire of germline-encoded Pattern Recognition Receptors (PRRs), initiating signaling cascades that drive antimicrobial and inflammatory responses. This technical guide details the application of knockout models to delineate the non-redundant functions of specific PRRs and the use of PRR inhibitors to pharmacologically modulate these pathways, offering a comprehensive toolkit for target validation and drug development.
PRR Signaling Pathways: A Primer for Intervention
PAMP engagement of PRRs such as Toll-like receptors (TLRs), RIG-I-like receptors (RLRs), NOD-like receptors (NLRs), and C-type lectin receptors (CLRs) triggers defined signaling modules. Key adaptor proteins (e.g., MyD88, TRIF, MAVS, ASC) nucleate complexes leading to the activation of transcription factors (NF-κB, IRFs, AP-1) and the production of cytokines, type I interferons, and effector molecules.
Diagram: Core PAMP-PRR Signaling Pathways for Therapeutic Targeting
Genetic Manipulation: Knockout Models
Gene knockout models, particularly in mice, are indispensable for establishing the causal role of a specific PRR or signaling component in vivo.
Experimental Protocol: Generation and Validation of a Conventional PRR Knockout Mouse
Objective: To generate a global knockout of a specific PRR gene (e.g., Tlr4) and validate its impact on PAMP response.
Methodology:
- Targeting Vector Design: Design a vector to replace a critical exon of the target gene with a positive selection marker (e.g., neomycin resistance gene neoʳ), flanked by homologous arms.
- Embryonic Stem (ES) Cell Manipulation:
- Electroporate the targeting vector into mouse embryonic stem (ES) cells.
- Select with G418 (neomycin analog). Resistant clones are screened via Southern blot or long-range PCR for homologous recombination.
- Generation of Chimeric Mice: Microinject validated ES cell clones into mouse blastocysts. Implant into pseudopregnant females.
- Germline Transmission & Breeding: Cross chimeric males with wild-type females. Agouti offspring are screened for germline transmission via PCR. Heterozygotes are intercrossed to generate homozygous knockout (KO), heterozygous (HET), and wild-type (WT) littermates.
- Phenotypic Validation:
- Genotypic: Confirm by genomic PCR and/or qRT-PCR.
- Protein Level: Confirm absence by Western blot or flow cytometry on relevant cells (e.g., macrophages).
- Functional In Vivo Challenge: Challenge age/sex-matched WT and KO mice with a cognate PAMP (e.g., LPS for TLR4). Measure:
- Serum cytokines (IL-6, TNF-α) via ELISA at 2, 6, and 24h.
- Survival and clinical scores over 72h.
- Inflammatory cell influx in peritoneal lavage or tissue at 24h.
Quantitative Data from Representative PRR Knockout Studies
Table 1: Phenotypic Outcomes of PRR Knockout Mouse Models in Response to PAMP Challenge
| PRR Gene Knocked Out | PAMP Challenge (Dose, Route) | Key Quantitative Readout (Wild-Type vs. KO) | Implication for Pathway |
|---|---|---|---|
| Tlr4 | LPS (5 mg/kg, i.p.) | Serum TNF-α at 2h: WT: 1250 ± 210 pg/ml, KO: 85 ± 30 pg/ml (p<0.001). 7-day survival: WT: 20%, KO: 100%. | TLR4 is essential for systemic LPS response. |
| Myd88 | CpG ODN (10 nmol, footpad) | Local IL-12p40 at 8h: WT: 450 ± 75 pg/ml, KO: 22 ± 10 pg/ml (p<0.001). Dendritic cell activation (MHC II MFI): WT: +320%, KO: +15%. | MyD88 is central for TLR9 signaling in DCs. |
| Mavs | Poly(I:C) (2 mg/kg, i.v.) | Serum IFN-β at 6h: WT: 650 ± 120 pg/ml, KO: 40 ± 15 pg/ml (p<0.001). Antiviral gene (Mx1) in spleen: WT: 500-fold induction, KO: 2-fold. | MAVS is critical for RLR-mediated IFN production. |
| Nlrp3 | Nigericin (10 µM, in vitro BMDM) + LPS priming | IL-1β in supernatant: WT: 8500 ± 1100 pg/ml, KO: 250 ± 90 pg/ml (p<0.001). Caspase-1 cleavage: Absent in KO. | NLRP3 is required for canonical inflammasome activation. |
Pharmacological Manipulation: PRR Inhibitors
Small-molecule and biologic inhibitors provide a means to acutely and reversibly block PRR signaling, offering therapeutic potential.
Experimental Protocol: In Vitro Screening of a Putative TLR4 Inhibitor
Objective: To assess the potency and specificity of a compound (e.g., TAK-242) in inhibiting TLR4-driven responses.
Methodology:
- Cell Culture: Seed immortalized macrophage cells (e.g., RAW 264.7) or primary bone marrow-derived macrophages (BMDMs) in 96-well plates.
- Pre-treatment & Stimulation: Pre-treat cells with a dose range of the inhibitor (e.g., 0.01 nM – 10 µM) or vehicle control (DMSO) for 1 hour. Subsequently, stimulate with TLR4 agonist LPS (e.g., 100 ng/ml) and/or a control agonist for a different PRR (e.g., R848 for TLR7/8, 1 µg/ml).
- Readouts at 6h and 24h:
- Cytokine Secretion: Collect supernatant. Quantify TNF-α and IL-6 via ELISA.
- Gene Expression: Harvest cells for RNA isolation. Perform qRT-PCR for Tnfa, Il6, and housekeeping gene (Gapdh).
- Cell Viability: Perform MTT or CellTiter-Glo assay in parallel to rule out cytotoxicity.
- Data Analysis: Calculate IC₅₀ values for inhibition of cytokine production in LPS-treated cells. Assess specificity by comparing inhibition of LPS vs. R848 response.
Quantitative Data on Selected PRR Inhibitors
Table 2: Profile of Representative Pharmacological PRR Inhibitors
| Inhibitor Name | Target PRR/PATHWAY | Mechanism of Action | Reported Potency (IC₅₀ / Ki) | Development Stage |
|---|---|---|---|---|
| TAK-242 (Resatorvid) | TLR4 | Binds Cys747 in TLR4-TIR domain, blocking interactions with adaptors. | IC₅₀: 11 nM (LPS-induced TNF-α in human monocytes). | Phase III (failed in septic shock). |
| IMO-8400 | TLR7, TLR8, TLR9 | Antisense oligonucleotide that binds to TLR ectodomain, inhibiting signaling. | IC₅₀: ~1 µM (CpG-induced cytokine production in human PBMCs). | Phase II (discoid lupus). |
| MCC950 | NLRP3 | Directly binds and inhibits NLRP3 ATP hydrolysis, blocking inflammasome assembly. | IC₅₀: 7.5 nM (NLRP3-dependent IL-1β release in mouse macrophages). | Preclinical/Phase I (inflammatory diseases). |
| BX795 | TBK1/IKKε | ATP-competitive inhibitor of the kinases downstream of RLR and STING pathways. | Ki: 6 nM for TBK1. IC₅₀: 10-30 nM (IRF3 phosphorylation). | Tool compound (research use). |
Diagram: Points of Intervention for PRR Inhibitors
The Scientist's Toolkit: Research Reagent Solutions
Table 3: Essential Reagents for PRR Knockout and Inhibition Studies
| Category | Item / Reagent | Function & Application | Example Vendor/Model |
|---|---|---|---|
| Genetic Models | C57BL/6-Tlr4lps-del/J Mice | Global TLR4 knockout model for in vivo loss-of-function studies. | The Jackson Laboratory (Stock #007227) |
| CRISPR/Cas9 Gene Editing System | For generating knockout cell lines (e.g., in iBMDMs or THP-1 cells) of specific PRR genes. | Synthego (sgRNA + Cas9) | |
| PAMP Agonists | Ultra-Pure LPS (E. coli K12) | Canonical TLR4 agonist for specific activation. | InvivoGen (tlrl-3pelps) |
| High-MW Poly(I:C) (HMW) | RLR (MDA5) and TLR3 agonist. | InvivoGen (tlrl-pic) | |
| CL097 | TLR7/8 agonist for endosomal pathway activation. | InvivoGen (tlrl-cl97) | |
| PRR Inhibitors | TAK-242 (Resatorvid) | Selective TLR4 signaling inhibitor for in vitro and in vivo pharmacological blockade. | MedChemExpress (HY-11109) |
| MCC950 (CRID3) | Potent and selective NLRP3 inflammasome inhibitor. | Cayman Chemical (17273) | |
| Detection Assays | Mouse TNF-α ELISA Kit | Quantification of key cytokine output from PRR signaling. | BioLegend (430904) |
| Phospho-IRF3 (Ser396) Antibody | Detection of RLR/STING pathway activation via Western blot. | Cell Signaling Technology (#4947) | |
| CellTiter-Glo Luminescent Assay | Measurement of cell viability to control for cytotoxicity in inhibitor studies. | Promega (G7570) | |
| Cell Culture | Primary Bone Marrow-Derived Macrophage (BMDM) Media | Differentiation of mouse bone marrow progenitors into macrophages for primary cell assays. | Supplemented DMEM with M-CSF |
| THP-1 Dual Cells | Reporter cell line with inducible PRR signaling pathways (NF-κB/IRF) and secreted luciferase. | InvivoGen (thpd-nfis) |
Within the broader thesis on "How PAMPs activate innate immune response research," the development of Pattern Recognition Receptor (PRR) agonists as vaccine adjuvants represents a direct translational application. Pathogen-Associated Molecular Patterns (PAMPs) are conserved microbial structures recognized by innate immune cells via PRRs such as Toll-like Receptors (TLRs). This recognition triggers tailored inflammatory and immunomodulatory responses, providing the "danger signal" necessary to bridge innate and adaptive immunity. By incorporating synthetic PAMP analogs into vaccine formulations, we can deliberately engineer the quality, magnitude, and durability of the antigen-specific adaptive response. This whitepaper provides an in-depth technical analysis of the mechanisms and clinical progress of leading PAMP adjuvants, with a focus on CpG ODN (TLR9 agonist) and MPLA (TLR4 agonist).
Mechanisms of PAMP-Mediated Adjuvanticity
The adjuvant effect of PAMPs is not a simple immune stimulation but a coordinated induction of specific innate programs that shape subsequent adaptive immunity.
Core Signaling Pathways: PAMP adjuvants primarily signal through TLRs expressed on Antigen-Presenting Cells (APCs), particularly dendritic cells (DCs). Ligation triggers two primary signaling branches:
- MyD88-Dependent Pathway: Common to most TLRs (except TLR3), leading to early-phase NF-κB activation and pro-inflammatory cytokine production (e.g., IL-6, TNF-α).
- TRIF-Dependent Pathway: Used by TLR3 and TLR4, leading to late-phase NF-κB and IRF3 activation, inducing Type I Interferons (IFN-α/β).
Functional Outcomes in APCs:
- Maturation: Upregulation of MHC and costimulatory molecules (CD80, CD86, CD40).
- Cytokine/Chemokine Secretion: Creates a local immunomodulatory milieu.
- Antigen Presentation Enhancement: Improved antigen processing and loading onto MHC.
- Migration: Directed travel to draining lymph nodes. These activated DCs then prime naïve T cells, directing their differentiation (e.g., Th1, Th2, Th17) and promoting B cell isotype switching and affinity maturation.
Diagram 1: Core signaling pathways of TLR-mediated adjuvant activity
Leading Clinical PAMP Adjuvant Candidates
Current clinical development focuses on well-defined PAMP analogs that offer predictable safety and efficacy profiles.
Table 1: Key PAMP Adjuvant Candidates in Licensed Vaccines & Clinical Trials
| Adjuvant (PAMP Class) | Target PRR | Composition / Source | Key Licensed Vaccine Use (Approx. Doses) | Primary Immune Polarization | Clinical Trial Stage (Examples) |
|---|---|---|---|---|---|
| MPL / MPLA (Lipid A analog) | TLR4 | Monophosphoryl Lipid A from S. minnesota | Cervarix (HPV), Fendrix (Hep B) >100M doses | Th1 bias, strong Ab | Approved in multiple vaccines |
| CpG 1018 (ODN) | TLR9 | 22-mer unmethylated CpG phosphorothioate ODN | Heplisav-B (Hep B) ~10M+ doses | Strong Th1/CTL, IgG2 bias | Licensed; in trials for COVID, influenza |
| AS01 (Liposome + PAMPs) | TLR4 | Liposome containing MPL + QS-21 (saponin) | Shingrix (shingles) >50M doses | Strong CD4+ T cell, Th1 | Licensed; in trials for malaria, HIV |
| AS04 (Alum + PAMP) | TLR4 | Alum adsorbed with MPL | Cervarix (HPV) >100M doses | Enhanced Th1 vs. alum alone | Licensed |
Data synthesized from FDA/EMA documents and recent clinical trial registries (2023-2024).
Experimental Protocols for Evaluating PAMP AdjuvantsIn VitroandIn Vivo
Standardized assays are critical for characterizing adjuvant mechanism and potency.
Protocol 4.1: In Vitro Human Dendritic Cell Activation Assay
- Objective: Quantify the maturation and cytokine profile of DCs in response to a PAMP adjuvant candidate.
- Materials: Human monocyte-derived DCs (moDCs) or primary blood DC subsets, PAMP adjuvant (e.g., CpG ODN, MPLA), control ligands (LPS, R848), culture media, flow cytometry antibodies (anti-CD80, CD86, HLA-DR, CD83), cytokine ELISA/LEGENDplex kits (for IL-6, IL-12p70, TNF-α, IFN-α).
- Method:
- Differentiate moDCs from CD14+ monocytes using GM-CSF and IL-4 over 5-7 days.
- Harvest immature DCs and seed at 1x10^5 cells/well in a 96-well plate.
- Stimulate cells with a titration of the PAMP adjuvant (e.g., 0.01, 0.1, 1 µM CpG) and controls for 18-24 hours.
- Harvest supernatant for cytokine analysis by multiplex assay.
- Harvest cells, stain with fluorescently-labeled antibodies against surface markers, and analyze by flow cytometry.
- Calculate geometric mean fluorescence intensity (gMFI) for maturation markers and cytokine concentration.
Protocol 4.2: In Vivo Mouse Immunogenicity and Efficacy Study
- Objective: Evaluate the adjuvant's ability to enhance antigen-specific antibody and T cell responses and provide protection in a challenge model.
- Materials: 6-8 week old female C57BL/6 mice (n=8-10/group), PAMP adjuvant, antigen (e.g., OVA, recombinant protein), sterile PBS, alum (control adjuvant), ELISA plates, antigen for coating, enzyme-conjugated detection antibodies, peptides for T cell stimulation, ELISpot plates.
- Immunization & Sample Collection Workflow:
Diagram 2: In vivo mouse immunization and analysis workflow
- Method:
- Formulate groups: (1) Antigen alone, (2) Antigen + Alum, (3) Antigen + PAMP adjuvant, (4) Placebo.
- Immunize mice subcutaneously with 10 µg antigen ± adjuvant on Day 0 and Day 21.
- Collect serum on Day 14 (prime) and Day 28 (boost) via retro-orbital bleeding.
- Measure antigen-specific antibody titers (total IgG, IgG1, IgG2c) by endpoint dilution ELISA.
- On Day 35, euthanize mice, harvest spleens, and prepare single-cell suspensions.
- Perform IFN-γ ELISpot using splenocytes stimulated with antigen-derived peptides to quantify antigen-specific T cell frequency.
- (For challenge models) Immunize mice, then challenge with live pathogen at a set time post-boost. Monitor survival, pathogen load (qPCR), or clinical score.
Table 2: Key Quantitative Readouts from Protocol 4.2
| Readout | Assay | Indication | Typical Positive Result (vs. Antigen Alone) |
|---|---|---|---|
| Antibody Titer | ELISA | B cell / Humoral response | 10- to 1000-fold increase in endpoint titer |
| IgG2c/IgG1 Ratio | Isotype-specific ELISA | Th1 vs. Th2 bias (mouse) | Ratio >1 indicates Th1 skew (for CpG, MPLA) |
| T Cell Frequency | IFN-γ ELISpot | Antigen-specific CD4+/CD8+ T cells | >100 Spot Forming Units (SFU)/10^6 cells |
| Protective Efficacy | Challenge (survival, load) | In vivo functional protection | >80% survival vs. 0% in control; >2-log pathogen reduction |
The Scientist's Toolkit: Key Research Reagent Solutions
Table 3: Essential Reagents for PAMP Adjuvant Research
| Reagent / Material | Supplier Examples | Function in Research |
|---|---|---|
| Ultrapure TLR Ligands (LPS, Pam3CSK4, CpG ODN classes A/B/C) | InvivoGen, Sigma-Aldrich | Positive controls for specific TLR pathways in in vitro validation assays. |
| Human/Mouse TLR Reporter Cell Lines (HEK-Blue) | InvivoGen | Simplified, quantitative assessment of specific TLR agonist activity via SEAP reporter. |
| MyD88 or TRIF Inhibitory Peptides (e.g., Pepinh-MYD, Pepinh-TRIF) | InvivoGen | To mechanistically dissect the signaling pathway responsible for adjuvant effects. |
| Recombinant PRR Proteins (e.g., soluble TLR4/MD2, Decitin-1-Fc) | R&D Systems, Sino Biological | For binding studies (SPR, ELISA) to confirm direct target engagement of adjuvant candidates. |
| Cytokine Multiplex Panels (LEGENDplex, ProcartaPlex) | BioLegend, Thermo Fisher | High-throughput, precise quantification of the broad cytokine/chemokine profile induced by adjuvants. |
| Fluorochrome-Conjugated Antibody Panels (for DC maturation, T cell subsets) | BD Biosciences, BioLegend | Detailed immunophenotyping by flow cytometry to assess APC activation and T cell polarization. |
| Model Antigens (OVA, KLH, HA peptides) | Sigma-Aldrich, GenScript | Standardized, immunogenic antigens for proof-of-concept immunogenicity studies in mice. |
| Adju-Phos / Alhydrogel (Alum) | InvivoGen, Croda | The benchmark Th2 adjuvant control for comparative studies in vivo. |
Targeting PRR Pathways in Immunotherapy and Inflammatory Disease
This whitepaper is framed within the broader thesis research on How Pathogen-Associated Molecular Patterns (PAMPs) activate innate immune response. The activation of Pattern Recognition Receptors (PRRs) by PAMPs constitutes the foundational signaling event that bridges innate immune detection to adaptive immunity and chronic inflammation. Targeting these pathways offers a precise strategy for modulating immune responses in immunotherapy and treating inflammatory diseases.
PRR Classes, Ligands, and Key Signaling Adaptors
Table 1: Major PRR Classes, Their PAMP Ligands, and Downstream Adaptors
| PRR Class | Prototype Receptors | Exemplary PAMPs (Ligands) | Key Signaling Adaptor Molecules | Primary Effector Output |
|---|---|---|---|---|
| Toll-like Receptors (TLRs) | TLR4 (LPS), TLR3 (dsRNA), TLR9 (CpG DNA) | Lipopolysaccharide, Viral dsRNA, Unmethylated CpG DNA | MyD88, TRIF, MAL, TRAM | Pro-inflammatory cytokines (TNF-α, IL-6, IL-1β), Type I IFNs |
| RIG-I-like Receptors (RLRs) | RIG-I, MDA5 | Viral ssRNA, dsRNA | MAVS (IPS-1) | Type I and III Interferons |
| NOD-like Receptors (NLRs) | NOD1, NOD2, NLRP3 | iE-DAP, MDP, Crystalline Structures | RIP2, ASC (for inflammasome) | NF-κB activation, Inflammasome assembly (IL-1β, IL-18) |
| C-type Lectin Receptors (CLRs) | Dectin-1, Mincle | β-glucans, Mycobacterial glycolipids | CARD9, Syk | Pro-inflammatory cytokines, Th17 responses |
| DNA Sensors (cGAS) | cGAS | Cytosolic dsDNA | STING | Type I Interferons |
Detailed Experimental Protocol: Assessing TLR4 Activation and Inhibition
Objective: To quantify the activation of the TLR4 pathway in primary human macrophages in response to LPS and its inhibition by a small-molecule antagonist.
Materials:
- Primary human monocyte-derived macrophages (MDMs).
- Ultra-pure LPS (E. coli O111:B4) as a TLR4-specific PAMP.
- Small-molecule TLR4 inhibitor (e.g., TAK-242/Resatorvid).
- Cell culture media (RPMI-1640 + 10% FBS).
- RNA extraction kit (e.g., Qiagen RNeasy).
- cDNA synthesis kit.
- Quantitative PCR (qPCR) system with primers for IL6, TNF, IFNB1, and housekeeping gene (e.g., GAPDH).
- ELISA kits for human IL-6, TNF-α, and IFN-β.
- Phospho-specific antibodies for p-IRF3, p-p65 (NF-κB), and total protein load controls.
- Western blot equipment.
Methodology:
- Cell Preparation & Treatment: Differentiate monocytes into MDMs over 7 days with GM-CSF. Seed cells in 12-well plates. Pre-treat cells with TLR4 inhibitor (e.g., 1µM TAK-242) or vehicle control (DMSO) for 1 hour.
- Stimulation: Stimulate cells with LPS (10 ng/mL) for varying timepoints (e.g., 30min for phosphorylation, 4h for mRNA, 24h for secreted protein).
- Signal Transduction Analysis (Western Blot):
- Lyse cells in RIPA buffer at 30 min post-stimulation.
- Perform SDS-PAGE and Western blotting using anti-p-IRF3, anti-p-p65, and corresponding total antibodies.
- Visualize bands using chemiluminescence; quantify densitometry.
- Gene Expression Analysis (qRT-PCR):
- Extract total RNA at 4h post-stimulation.
- Synthesize cDNA. Perform qPCR in triplicate for target genes. Calculate fold change using the 2^(-ΔΔCt) method normalized to GAPDH and vehicle control.
- Cytokine Secretion Analysis (ELISA):
- Collect cell culture supernatants at 24h.
- Perform ELISA for IL-6, TNF-α, and IFN-β according to manufacturer protocols. Use a standard curve to determine cytokine concentration (pg/mL).
PRR Signaling Pathways Visualization
Diagram Title: Core PRR Signaling Pathways Converge on NF-κB and IRF3.
Experimental Workflow for PRR Pathway Analysis
Diagram Title: Multimodal Workflow for PRR Pathway Interrogation.
The Scientist's Toolkit: Key Research Reagent Solutions
Table 2: Essential Reagents for PRR Pathway Research
| Reagent Category | Specific Example | Function in PRR Research |
|---|---|---|
| Defined PAMP Agonists | Ultrapure LPS (TLR4), Poly(I:C) HMW (TLR3/RIG-I/MDA5), 2'3'-cGAMP (STING) | High-purity, specific ligands to activate a single PRR pathway without contamination from other PAMPs. Critical for clean experimental readouts. |
| PRR-Specific Inhibitors | TAK-242 (TLR4), BX795 (TBK1/IKKε), MCC950 (NLRP3) | Pharmacological tools to block specific nodes in PRR signaling, enabling validation of target involvement and therapeutic potential. |
| Phospho-Specific Antibodies | Anti-phospho-IRF3 (Ser396), Anti-phospho-NF-κB p65 (Ser536) | Detect activation-specific phosphorylation events on key transcription factors downstream of PRRs via Western blot or flow cytometry. |
| Cytokine Detection Assays | ELISA kits for human/mouse IL-1β, IL-6, TNF-α, IFN-β; Luminex multiplex panels | Quantify the functional cytokine output of PRR activation (e.g., inflammasome activity, pro-inflammatory, or interferon response). |
| Gene Expression Tools | qPCR primers for IFNB1, IL6, TNFA; siRNA/shRNA kits for MYD88, MAVS, STING | Measure transcriptional upregulation of PRR target genes or genetically knock down pathway components to establish necessity. |
| Reporter Cell Lines | THP-1-Dual cells (NF-κB/IRF SEAP reporter), HEK-Blue hTLR4 cells | Engineered cells that produce a quantifiable enzyme (e.g., SEAP, Lucia) upon PRR pathway activation, enabling high-throughput screening. |
Therapeutic Targeting and Clinical Relevance
The quantitative understanding of PAMP-PRR signaling has directly enabled drug development. Agonists targeting STING (e.g., ADU-S100) and TLRs (e.g., Imiquimod, TLR7) are in clinical trials for cancer immunotherapy, aiming to convert "cold" tumors into immunologically "hot" ones. Conversely, inhibitors targeting TLR4 (TAK-242), NLRP3 (MCC950 derivatives), and IL-1β (Canakinumab) are being evaluated for septic shock, inflammatory diseases (NLRP3-associated), and atherosclerosis. The core challenge remains achieving cell- and context-specific modulation to avoid global immunosuppression or excessive inflammation.
Navigating Experimental Pitfalls in PAMP Research: Contamination, Specificity, and Reproducibility
The innate immune system provides the first line of defense against pathogens through the recognition of conserved microbial structures known as Pathogen-Associated Molecular Patterns (PAMPs). A central PAMP is bacterial lipopolysaccharide (LPS), or endotoxin, a major component of the outer membrane of Gram-negative bacteria. The contamination of biological reagents, pharmaceutical products, and laboratory materials with endotoxin is a critical menace, as trace amounts can potently activate innate immune pathways, leading to skewed experimental results, cytokine storms, and severe clinical adverse events. This technical guide frames LPS contamination within the broader thesis of PAMP-driven innate immune activation, providing researchers with current methodologies for detection, removal, and control.
LPS Structure and Innate Immune Recognition
LPS is an amphiphilic molecule consisting of a hydrophobic lipid A domain, a core oligosaccharide, and a distal O-antigen polysaccharide. The lipid A moiety is the immunostimulatory core recognized by the innate immune system.
Signaling Pathway: TLR4-Mediated LPS Detection The primary receptor for LPS is the Toll-like Receptor 4 (TLR4) complex, which, upon ligand binding, initiates a potent pro-inflammatory signaling cascade.
Diagram Title: TLR4 Signaling Pathway for LPS-Induced Immune Activation
Detection of Endotoxin Contamination
Accurate detection is paramount. The Limulus Amebocyte Lysate (LAL) assay is the gold standard.
Key Quantitative Data: Common LAL Assay Formats
| Assay Type | Principle | Detection Range | Time to Result | Key Interferents |
|---|---|---|---|---|
| Gel-Clot | Gel formation via clotable protein | 0.03 - 0.5 EU/mL | ~60 min | High viscosity, proteases |
| Chromogenic | Cleavage of p-nitroaniline (pNA) substrate; measure OD 405nm | 0.005 - 50 EU/mL | 15-30 min | Color, absorbance |
| Turbidimetric | Measurement of turbidity increase from precipitated coagulin | 0.001 - 100 EU/mL | 15-30 min | Particulate matter |
| Fluorogenic | Cleavage of fluorescent substrate; measure fluorescence | 0.0005 - 50 EU/mL | 15-30 min | Fluorescent compounds |
EU = Endotoxin Unit. 1 EU ≈ 0.1 - 0.2 ng of standard LPS.
Experimental Protocol: Kinetic Chromogenic LAL Assay
- Objective: Quantify endotoxin concentration in a protein sample.
- Materials: See "Scientist's Toolkit" below.
- Procedure:
- Reconstitution: Reconstitute LAL reagent and chromogenic substrate with provided LAL reagent water.
- Standard Curve: Prepare a series of 2-fold dilutions of the Control Standard Endotoxin (CSE) in endotoxin-free water (e.g., 5.0, 2.5, 1.25, 0.625, 0.313, 0.156 EU/mL).
- Sample Prep: Dilute test samples in endotoxin-free water or buffer. Adjust pH to 6.0-8.0 if necessary.
- Plate Setup: In a 96-well pyrogen-free microplate, add 50 µL of each standard, sample, and negative control (water) per well in duplicate.
- Reaction: Add 50 µL of LAL reagent to each well using a multichannel pipette. Seal and incubate at 37°C ± 1°C for 10 min.
- Substrate Addition: Add 100 µL of pre-warmed chromogenic substrate solution to each well.
- Kinetic Reading: Immediately place plate in a pre-warmed (37°C) microplate reader. Shake and measure absorbance at 405 nm every 30-60 seconds for 60-90 minutes.
- Analysis: Determine the reaction time (onset time) for each well as the time to reach a predetermined absorbance threshold. Plot log[Endotoxin] vs. log(onset time) for standards to generate a linear standard curve. Calculate sample endotoxin concentration from the curve, applying any valid dilution factor.
Removal and Inactivation of Endotoxin
Removal is challenging due to LPS's stability and tendency to form micelles.
Quantitative Data: Endotoxin Removal Techniques
| Method | Mechanism | Typical Reduction | Sample Compatibility | Limitations |
|---|---|---|---|---|
| Ion-Exchange Chromatography | Binding of negatively charged LPS to positively charged resin | 3-4 log reduction | Proteins, buffers | High salt elution can co-elute LPS |
| Two-Phase Extraction (Triton X-114) | Temperature-dependent partitioning of LPS into detergent phase | >4 log reduction | Hydrophobic proteins | Triton contamination; not for therapeutics |
| Affinity Adsorbents (PMB, LAL) | Specific binding to Lipid A (Polymyxin B) or coagulogen (LAL beads) | 2-4 log reduction | Antibodies, sensitive proteins | Capacity limitations, ligand leakage |
| Size-Exclusion Chromatography | Separation based on micelle vs. protein size | 1-2 log reduction | All | Poor efficiency; LPS micelle size varies |
| Ultrafiltration | Size-based retention of LPS micelles | 1-3 log reduction | >10 kDa molecules | Fouling, variable micelle size |
| Dry-Heat Depyrogenation | Pyrolytic destruction at high temperature | >3 log reduction | Glassware, metal | Only for heat-stable items |
Experimental Protocol: Endotoxin Removal via Polymyxin B Affinity Chromatography
- Objective: Remove LPS from a monoclonal antibody (mAb) solution.
- Procedure:
- Column Preparation: Pack a chromatography column with polymyxin B-agarose resin. Equilibrate with 10 column volumes (CV) of endotoxin-free binding buffer (e.g., 20 mM Tris, 150 mM NaCl, pH 7.4).
- Sample Preparation: Dilute or dialyze the mAb sample into the binding buffer. Filter through a 0.22 µm low-protein-binding filter.
- Loading: Apply the sample to the column at a slow flow rate (e.g., 0.5 mL/min for a 1 mL column). Collect flow-through.
- Washing: Wash the column with 5-10 CV of binding buffer to remove unbound protein.
- Elution: Elute the bound mAb using a buffer with higher ionic strength or a mild chaotrope (e.g., 1 M NaCl in binding buffer or 1 M arginine, pH 7.4). Collect fractions.
- Cleaning & Storage: Strip any residual bound LPS with 2 CV of 0.1 M NaOH. Re-equilibrate with storage buffer (20% ethanol).
- Analysis: Measure protein concentration (A280) and endotoxin level (LAL assay) in the starting material, flow-through, and eluted fractions. Calculate binding efficiency and endotoxin removal factor.
Controls and Preventative Strategies
A robust control strategy is essential for reliable research and manufacturing.
Signaling Pathway: Control Points for LPS Contamination
Diagram Title: Control Strategy Workflow for LPS Contamination Management
The Scientist's Toolkit: Key Research Reagent Solutions
| Item | Function & Rationale |
|---|---|
| Limulus Amebocyte Lysate (LAL) | Enzymatic cascade reagent derived from horseshoe crab blood; the core component of all modern endotoxin detection assays. |
| Control Standard Endotoxin (CSE) | A standardized LPS preparation used to generate calibration curves for quantitative LAL assays. |
| Endotoxin-Free Water | USP-grade water with <0.001 EU/mL; used for reagent reconstitution, sample dilution, and negative controls. |
| Pyrogen-Free Labware | Tubes, tips, and plates treated (e.g., via dry-heat) to destroy residual endotoxin, preventing sample introduction. |
| Polymyxin B Affinity Resin | Immobilized antibiotic that binds Lipid A with high specificity for selective LPS removal from protein solutions. |
| Recombinant Factor C Assay | Animal-free, recombinant alternative to LAL based on the first enzyme in the clotting cascade; specific for LPS. |
| Endotoxin Removal Detergents (e.g., Triton X-114) | Non-ionic detergents used in cold-phase separation protocols to physically partition LPS away from proteins. |
| TLR4/MD-2 Inhibitors (e.g., TAK-242, LPS-RS) | Pharmacological tools to specifically block TLR4 signaling, used to confirm LPS-specific effects in cellular assays. |
Within the broader thesis of understanding how Pathogen-Associated Molecular Patterns (PAMPs) activate the innate immune response, a critical and persistent challenge is the validation of signaling specificity. Many commercial and experimental PAMP preparations are contaminated with molecules capable of triggering overlapping or identical signaling cascades, most notably bacterial lipoproteins or lipopolysaccharide (LPS). This guide provides a detailed technical framework for researchers to definitively rule out contaminant-driven responses, ensuring that observed immune activation is attributable to the PAMP of interest.
Common Contaminants and Confounding Signals
Contaminants often co-purify with recombinant proteins or nucleic acid preparations. Their presence can lead to the erroneous attribution of immune activation.
| PAMP of Interest | Common Contaminant | Primary PRR Triggered by Contaminant | Potential Overlapping Readout |
|---|---|---|---|
| Recombinant Flagellin | Bacterial Lipoproteins (BLP) | TLR2/1 or TLR2/6 | NF-κB activation, cytokine (IL-6, TNF-α) secretion |
| dsRNA (poly I:C) | LPS (Endotoxin) | TLR4 | Type I Interferon production, inflammatory cytokines |
| CpG ODN (Class B) | LPS (Endotoxin) | TLR4 | B cell activation, IL-6 production |
| RIG-I ligands (short dsRNA) | LPS or BLP | TLR4/TLR2 | IRF3 activation, IFN-β production |
Core Validation Strategies & Experimental Protocols
Strategy 1: Pharmacological and Genetic Inhibition of Contaminant-Sensing Pathways
This is the first line of validation to demonstrate that a response is independent of common contaminant receptors.
Experimental Protocol 1: TLR4 Inhibition Assay for LPS Contamination
- Objective: To determine if LPS contamination is responsible for observed TLR-mediated signaling.
- Methodology:
- Cell Culture: Seed appropriate reporter cells (e.g., HEK-Blue hTLR4, primary macrophages) in a 96-well plate.
- Pre-treatment: Treat cells with a specific TLR4 inhibitor (e.g., TAK-242 (Resatorvid) at 1 µM, Polymyxin B at 10-100 µg/ml) or an isotype control for 30-60 minutes.
- Stimulation: Add the PAMP preparation of interest across a dose range. Include controls: ultrapure LPS (positive control for TLR4), ligand solvent (negative control), and inhibitor solvent control.
- Readout: Measure NF-κB/AP-1 activation (e.g., SEAP reporter assay) or cytokine release (ELISA for TNF-α/IL-6) at 6-24 hours post-stimulation.
- Interpretation: If the response to the PAMP is unabated by TLR4-specific inhibition, LPS contamination is unlikely to be the driver. Similar protocols apply using TLR2 inhibitors (e.g., CU-CPT22) for lipoprotein contamination.
Experimental Protocol 2: Genetic Knockout/KD Validation
- Objective: To conclusively rule out signaling through a specific PRR.
- Methodology:
- Cell Models: Use isogenic paired cell lines: Wild-type vs. CRISPR-Cas9 knockout of the gene encoding the contaminant-sensing PRR (e.g., TLR4, TLR2, MYD88).
- Stimulation: Stimulate both cell lines with the PAMP preparation and known ligands for the knocked-out receptor.
- Readout: Quantify downstream signaling (phospho-IRF3, p65, p38 MAPK via immunoblot) and gene induction (qPCR for IFNB1, TNFA, IL6).
- Interpretation: A maintained response in TLR4 KO cells, but ablated response to pure LPS, confirms the PAMP signal is TLR4-independent.
Strategy 2: Direct Detection and Quantification of Contaminants
Experimental Protocol 3: High-Sensitivity LAL and HEK-Blue Reporter Assays
- Objective: To quantify endotoxin and lipoprotein levels.
- Methodology:
- Endotoxin Test: Use the Limulus Amebocyte Lysate (LAL) chromogenic assay. Perform in pyrogen-free tubes with appropriate dilutions of the PAMP sample to avoid interference. Follow manufacturer's protocol precisely.
- Lipoprotein Test: Use HEK-Blue hTLR2 reporter cells. Stimulate with the PAMP sample and compare the SEAP activity to a standard curve generated with a known synthetic lipopeptide (e.g., Pam3CSK4).
- Data Presentation:
| PAMP Sample | LAL Assay (EU/mL) | HEK-TLR2 Activity (Fold over Baseline) | Acceptable for Specific Studies? |
|---|---|---|---|
| Commercial Flagellin Prep A | 0.5 | 12.5 | No (High BLP) |
| HPLC-purified CpG ODN | <0.01 | 1.2 | Yes |
| Lab-synthesized dsRNA | 1.2 | 1.5 | No (High LPS) |
| Recombinant Protein (His-tag purified) | 5.8 | 8.4 | No (High LPS & BLP) |
Strategy 3: Biochemical Purity Validation and Functional Blocking
Experimental Protocol 4: Enzymatic/Digestion Specificity Control
- Objective: To abolish the activity of the target PAMP while leaving contaminant activity intact.
- Methodology:
- Targeted Degradation: Treat the PAMP sample with an enzyme specific to its class.
- For dsRNA (poly I:C): Use RNase III (dsRNA-specific) or RNase A/T1 (ssRNA-specific as control).
- For Flagellin: Use proteinase K.
- For CpG DNA: Use DNase I.
- Control Digestion: Perform a parallel mock digestion (enzyme buffer only).
- Stimulation Assay: Apply digested and mock-digested samples to primary dendritic cells or macrophages.
- Readout: Measure PAMP-specific responses (e.g., IRF3 phosphorylation for RIG-I ligands, IL-1β secretion for flagellin in primed cells via NLR inflammasome).
- Targeted Degradation: Treat the PAMP sample with an enzyme specific to its class.
- Interpretation: Ablation of the expected immune readout after specific digestion confirms it was driven by the target PAMP. Persistence of a signal suggests contaminant activity.
The Scientist's Toolkit: Research Reagent Solutions
| Reagent/Material | Function & Purpose | Key Consideration |
|---|---|---|
| Ultrapure, Low-Endotoxin BSA | Carrier protein for diluting PAMPs; prevents non-specific binding. | Standard BSA can be high in endotoxin, introducing artifact. |
| Pyrogen-Free Water/Tubes | Solvent and labware for preparing PAMP stocks. | Critical for avoiding introduction of LPS during sample handling. |
| TLR-Specific Inhibitors (TAK-242, CU-CPT22) | Pharmacological blockade of TLR4 or TLR2 signaling. | Must titrate for efficacy and cytotoxicity in each cell system. |
| HEK-Blue Reporter Cell Lines (hTLR4, hTLR2, hTLR3, etc.) | Specific, sensitive biosensors for contaminant activity. | Use with secreted embryonic alkaline phosphatase (SEAP) detection. |
| Chromogenic LAL Assay Kit | Gold-standard for quantifying endotoxin contamination. | More sensitive and quantitative than gel-clot assays. |
| Polymyxin B Agarose/Sepharose | Affinity resin for depleting LPS from protein solutions. | Can be used for sample clean-up prior to critical experiments. |
| CRISPR-Modified Isogenic Cell Lines | Definitive genetic tools to rule out specific PRR pathways. | Requires rigorous validation of knockout (e.g., sequencing, functional assay). |
Visualizing Validation Workflows and Signaling Pathways
Title: PAMP Specificity Validation Decision Workflow
Title: Contaminant vs. Target PAMP Signaling Convergence
Ensuring PAMP specificity is not a single experiment but a mandatory cascade of controls. The integration of sensitive contaminant detection, pharmacological and genetic pathway inhibition, and biochemical validation is essential for attributing innate immune activation correctly. Adherence to these strategies, as framed within the rigorous study of PAMP-mediated signaling, is fundamental for generating reproducible, high-quality data that advances our understanding of innate immunity and its therapeutic modulation.
This technical guide addresses the critical parameters for optimizing the use of Pathogen-Associated Molecular Patterns (PAMPs) in innate immunity research, framed within the broader thesis of understanding how PAMPs activate the innate immune response. Precise control of dosage, timing, and cell state is paramount for generating reproducible, physiologically relevant data that can inform therapeutic development.
Core Parameters for PAMP Stimulation
Dosage Considerations
PAMP potency varies dramatically. Establishing a dose-response curve is non-negotiable for each new cell type or experimental system. Suboptimal doses fail to elicit a robust signal, while supra-physiological doses can cause non-specific effects or cell death.
Timing and Kinetics
Innate immune signaling is highly dynamic. Early events (e.g., NF-κB translocation) may occur within minutes, while cytokine secretion peaks hours later. The optimal readout timepoint is pathway- and output-specific.
Cell State Variables
The response to a PAMP is heavily influenced by the cell's state, including its differentiation status (e.g., M0 vs. M1 macrophage), metabolic health, cell cycle stage, and baseline inflammatory tone.
Table 1: Common PAMPs and Typical Dosage Ranges for In Vitro Human Cell Studies
| PAMP | Target Receptor | Common Cell Types | Typical Dosage Range | Key Readouts (Time Post-Stimulation) |
|---|---|---|---|---|
| LPS (E. coli) | TLR4/MD2 | Macrophages, Monocytes, DCs | 1-100 ng/mL | p-IRAK1/4 (5-15 min), NF-κB translocation (30-60 min), TNF-α secretion (4-24 h) |
| Poly(I:C) | TLR3 (endosomal) | Macrophages, Fibroblasts, Epithelial cells | 1-25 µg/mL | IRF3 phosphorylation (1-3 h), IFN-β mRNA (3-6 h), IP-10 secretion (12-24 h) |
| CpG ODN | TLR9 (endosomal) | pDCs, B cells | 0.5-5 µM | p-IRAK1 (15-30 min), IFN-α secretion (12-24 h), MHC-II upregulation (24-48 h) |
| R848 (Resiquimod) | TLR7/8 | Monocytes, pDCs, mDCs | 0.1-5 µg/mL | IRF7 activation (2-4 h), IL-6/IL-12 secretion (12-24 h) |
| Pam3CSK4 | TLR1/2 | Macrophages, Neutrophils, Epithelial cells | 10-500 ng/mL | NF-κB activation (1-2 h), IL-8 secretion (6-18 h) |
| cGAMP (2'3'-) | STING | Macrophages, DCs, T cells (transfected) | 1-20 µg/mL (transfection) | p-STING (2-4 h), p-TBK1 (2-4 h), IFN-β mRNA (6-12 h) |
Table 2: Impact of Cell State on Response to LPS (TLR4 Agonist)
| Cell State Variable | Experimental Modulation | Effect on LPS-Induced TNF-α Output | Implications for Experimental Design |
|---|---|---|---|
| Differentiation | GM-CSF vs. M-CSF derived human macrophages | GM-CSF (M1-like): Higher, faster output | Standardize differentiation protocol. |
| Metabolic State | Pre-treatment with 2-Deoxy-D-glucose (glycolysis inhibitor) | Severely attenuated cytokine production | Ensure consistent nutrient media; report serum batch. |
| Cell Density | Plating at 50% vs. 90% confluence | Higher density can potentiate response via autocrine signaling | Control for seeding density and plate format. |
| Pre-Priming ("Tolerization") | Low-dose LPS pre-treatment 24h prior to challenge | Significantly reduced output (tolerance) | Account for potential prior microbial exposure. |
| Cell Cycle | Synchronization at G1/S boundary using double thymidine block | Enhanced signaling in G1 phase | Consider asynchronous populations as a variable. |
Detailed Experimental Protocols
Protocol 1: Establishing a PAMP Dose-Response Curve for Cytokine Secretion
Objective: To determine the optimal and sub-toxic concentration of a PAMP for stimulating primary human monocyte-derived macrophages (MDMs).
Materials: (See "The Scientist's Toolkit" below) Procedure:
- Differentiate MDMs from CD14+ monocytes using 50 ng/mL M-CSF for 6 days in 96-well plates.
- Prepare a 2-fold serial dilution of the PAMP (e.g., LPS) in complete media across 10 concentrations, plus a vehicle control.
- Aspirate media from MDMs and add 200 µL of each PAMP dilution in triplicate.
- Incubate cells at 37°C, 5% CO2 for 18 hours.
- Carefully collect supernatants without disturbing the cell monolayer.
- Assess cell viability in the remaining wells using an MTT or CellTiter-Glo assay.
- Analyze supernatants for target cytokines (e.g., TNF-α, IL-6) via ELISA.
- Data Analysis: Plot cytokine concentration (Y-axis) vs. log PAMP dose (X-axis). Plot viability on a separate graph. The optimal dose is the highest concentration that yields maximal cytokine output without reducing viability below 90%.
Protocol 2: Kinetic Analysis of Early Signaling Events via Western Blot
Objective: To characterize the phosphorylation kinetics of signaling intermediates (e.g., TBK1, IRF3) post-STING activation.
Materials: (See "The Scientist's Toolkit" below) Procedure:
- Seed HEK293T cells stably expressing STING in 6-well plates.
- At 90% confluence, transfert cells with 2'3'-cGAMP (2 µg/mL) using a lipofection reagent. Note the exact start time.
- At defined timepoints post-transfection (e.g., 0, 30, 60, 120, 240 minutes), rapidly aspirate media and lyse cells directly in 200 µL of hot 1x Laemmli SDS sample buffer containing phosphatase/protease inhibitors.
- Sonicate lysates briefly, boil for 5 minutes, and centrifuge.
- Load equal protein amounts on SDS-PAGE gels, transfer to PVDF membranes, and block.
- Probe with primary antibodies against p-TBK1 (Ser172), total TBK1, p-IRF3 (Ser386), and a loading control (e.g., β-Actin).
- Data Analysis: Quantify band density. Plot the ratio of p-TBK1/TBK1 over time to identify peak activation.
The Scientist's Toolkit: Key Research Reagent Solutions
Table 3: Essential Materials for PAMP Stimulation Experiments
| Item / Reagent | Function & Importance | Example Product/Catalog # (for reference) |
|---|---|---|
| Ultra-Pure PAMPs | Minimizes confounding activation by contaminants (e.g., protein in LPS preps). Critical for reproducibility. | InvivoGen ultrapure LPS-EB, Poly(I:C) HMW. |
| TLR-Specific Agonists/Antagonists | For positive controls and pathway blocking to confirm receptor specificity. | CLI-095 (TAK-242) for TLR4 inhibition. |
| Mycoplasma Detection Kit | Mycoplasma contamination potently primes innate sensing pathways, skewing results. | Lonza MycoAlert. |
| Endotoxin-Free Labware | Prevents unintended TLR4 activation from plasticware. Essential for low-dose work. | Corning Costar Cell Culture Plates, Certified Endotoxin-Free. |
| High-Sensitivity ELISA/Cytometric Bead Array | Quantifies low-abundance cytokines/chemokines from limited cell numbers. | R&D Systems DuoSet ELISA, BioLegend LEGENDplex. |
| Phospho-Specific Flow Cytometry Antibodies | Enables single-cell kinetic analysis of signaling in heterogeneous populations. | BD Phosflow p-NF-κB p65 (Ser529). |
| Cell Viability Assay (Luminescent) | Accurately normalizes secreted readouts to viable cell number. | Promega CellTiter-Glo 2.0. |
| STING Agonists (Cell-Permeant) | Allows study of cytosolic DNA sensing without transfection artifacts. | InvivoGen diABZI (STING agonist). |
Signaling Pathway & Workflow Visualizations
Within the broader thesis on How PAMPs Activate Innate Immune Response Research, a critical technical variable is the source and preparation of Pathogen-Associated Molecular Patterns (PAMPs). The choice between synthetic and natural PAMPs fundamentally impacts the reproducibility, specificity, and biological relevance of experimental outcomes in immunology, vaccine development, and therapeutic discovery. This guide provides a technical framework for researchers to navigate this variability.
Natural PAMPs are isolated directly from microbial organisms (e.g., LPS from E. coli, peptidoglycan from S. aureus, viral RNA from influenza). Their preparation involves extraction and purification protocols, which can introduce heterogeneity, including contaminating microbial products that synergize or confound signaling.
Synthetic PAMPs are chemically defined molecules produced in vitro (e.g., synthetic lipopeptides, CpG oligonucleotides, pure lipid A structures). They offer high batch-to-batch consistency and allow for precise structural modifications to probe receptor-ligand interactions.
| Characteristic | Natural PAMPs | Synthetic PAMPs |
|---|---|---|
| Molecular Homogeneity | Low to Moderate; complex mixtures common. | Very High; chemically defined. |
| Contaminant Risk | High (e.g., endotoxin in non-LPS preps, other MAMPs). | Negligible with proper QC. |
| Biological Relevance | High; represents natural pathogen surface. | Can be tailored; may lack contextual milieu. |
| Reproducibility | Variable between batches and suppliers. | Excellent. |
| Cost & Complexity | Moderate isolation cost; high characterization cost. | High upfront synthesis cost; lower QC cost. |
| Common Examples | LOS from N. meningitidis, Zymosan from S. cerevisiae. | Pam3CSK4, Poly(I:C), high-purity Lipid IVa. |
Technical Protocols for Preparation and Validation
Protocol: Extraction and Purification of Natural LPS (Hot Phenol-Water Method)
This classic method isolates rough-form LPS.
- Lyse Cells: Suspend 10g wet-weight bacterial paste in 140ml DEPC-treated water at 68°C.
- Phenol Extraction: Add an equal volume of 90% phenol (pre-warmed to 68°C). Stir vigorously for 30 min at 68°C.
- Phase Separation: Cool on ice and centrifuge at 10,000 x g for 30 min at 4°C. The upper aqueous phase contains LPS.
- Recovery & Dialysis: Collect the aqueous phase. Re-extract the phenol phase with an equal volume of hot water. Pool aqueous phases. Dialyze extensively against distilled water for 72h to remove phenol.
- Lyophilization: Lyophilize the dialysate to obtain crude LPS.
- Further Purification: Subject to enzymatic digestion (DNase/RNase, proteinase K), ultracentrifugation (100,000 x g, 4h), or column chromatography (e.g., Sepharose 4B) for smooth LPS.
- Validation: Analyze via SDS-PAGE/silver staining, Limulus Amebocyte Lysate (LAL) assay for specific activity, and mass spectrometry.
Protocol: Handling and Reconstitution of Synthetic PAMPs (e.g., Lyophilized Lipopeptide)
- Calculation: Calculate required mass to achieve stock concentration (e.g., 1 mg/ml).
- Solubilization: Briefly centrifuge vial to bring contents to bottom. Add appropriate sterile solvent (e.g., endotoxin-free water for Pam3CSK4; DMSO for some TLR7/8 ligands) slowly along the vial wall.
- Vortexing & Sonication: Vortex for 30-60 seconds. Place in a water bath sonicator for 5-10 minutes to ensure complete dissolution and disaggregation.
- Aliquoting: Prepare small, single-use aliquots to avoid freeze-thaw cycles.
- Storage: Store at ≤ -20°C (or as recommended); desiccate if hygroscopic.
- Validation: Verify concentration via spectrophotometry (for nucleotides) or mass spectrometry. Confirm biological activity and absence of endotoxin via LAL assay (<0.1 EU/ml).
Protocol: Standardized Cell-Based Potency Assay (e.g., HEK-Blue Reporter System)
This assay quantifies PAMP activity via TLR activation.
- Seed Cells: Seed HEK-Blue TLR4 cells (InvivoGen) at 5x10^4 cells/well in a 96-well plate in DMEM + 10% FBS, 1x Normocin.
- Prepare PAMP Dilutions: Prepare 8-point, 1:3 serial dilutions of natural or synthetic PAMP in assay medium. Include a positive control (e.g., ultrapure LPS) and negative control (medium alone).
- Stimulate: After 24h, replace medium with 180µl of fresh medium and add 20µl of PAMP dilution per well. Incubate at 37°C, 5% CO2 for 16-24h.
- Develop: Transfer 20µl of supernatant to a new plate. Add 180µl of QUANTI-Blue detection reagent. Incubate 30min-2h at 37°C.
- Readout: Measure absorbance at 620-655 nm. Plot dose-response curve and calculate EC50 values for batch comparison.
Signaling Pathway Context: TLR4 Activation by LPS
TLR4 Signaling Pathway by LPS Source
Experimental Workflow for PAMP Comparison
PAMP Source Comparison Workflow
The Scientist's Toolkit: Essential Reagent Solutions
| Reagent / Material | Function & Importance | Example Supplier / Catalog |
|---|---|---|
| Endotoxin-Free Water | Solvent for reconstitution; critical to avoid spurious TLR4 activation. | Thermo Fisher, InvivoGen (aqua-eps) |
| Limulus Amebocyte Lysate (LAL) | Gold-standard assay to quantify endotoxin contamination (EU/ml). | Lonza, Associates of Cape Cod |
| HEK-Blue Reporter Cells | Engineered cell lines expressing specific TLRs and a SEAP reporter for quantitative potency assays. | InvivoGen |
| Ultrapure Natural PAMPs | Benchmarks for comparison (e.g., E. coli K12 LPS). | InvivoGen (tlrl-eklps), Sigma |
| Synthetic TLR Agonists | Chemically defined standards (e.g., Pam3CSK4 for TLR1/2). | InvivoGen, EMC Microcollections |
| Proteinase K & DNase/RNase | For removing contaminating proteins/nucleic acids from natural PAMP preps. | Roche, Thermo Fisher |
| Density Gradient Media (e.g., OptiPrep) | For ultracentrifugation-based purification of natural PAMPs like vesicles. | Sigma-Aldrich |
| Size-Exclusion Chromatography Columns | For final polishing steps to separate PAMPs by molecular weight. | Cytiva (Sepharose), Bio-Rad |
| Sterile, Low-Binding Tubes/Pipette Tips | Minimizes adsorption of precious synthetic PAMP stocks. | Axygen, Eppendorf (LoBind) |
Troubleshooting Common Assay Failures in Cytokine and Pathway Analysis
Introduction Within the broader thesis on "How PAMPs activate innate immune response research," accurate cytokine and pathway analysis is paramount. Pathogen-Associated Molecular Patterns (PAMPs) trigger intricate signaling cascades (e.g., via TLRs, RIG-I, NLRs) leading to the production of key cytokines (e.g., TNF-α, IL-6, IL-1β, Type I IFNs). Assay failures in this domain can obscure critical data on immune activation kinetics, magnitude, and specificity. This guide provides a technical framework for diagnosing and resolving these failures.
Common Failure Modes & Quantitative Data Summary The table below consolidates common failure points, their potential causes, and quantitative impact data.
Table 1: Common Assay Failures, Causes, and Impact Data
| Assay Type | Failure Mode | Common Causes | Typical Impact (Quantitative) |
|---|---|---|---|
| ELISA/MSD | High Background | Non-specific binding, plate washing issues, contaminated reagents. | Signal in negative control > 0.2 OD or 500 RFU. |
| ELISA/MSD | Low Signal/ Sensitivity | Degraded antibodies, expired detection reagent, improper standard dilution. | Standard curve R² < 0.98, Max signal < 2.0 OD or < 10,000 RFU. |
| Multiplex Bead Array | High CVs & Poor Standard Curve | Bead aggregation, improper calibration of fluidics, degraded analytes. | Intra-assay CV > 15%, Inter-assay CV > 20%. |
| Western Blot (Phospho-Proteins) | No Phospho-Signal | Inadequate cell stimulation, phosphatase activity, improper transfer. | Phospho-protein signal indistinguishable from control. |
| qPCR (Cytokine mRNA) | Inconsistent Ct Values | Poor RNA integrity, inefficient reverse transcription, PCR inhibitors. | RNA Integrity Number (RIN) < 8.0, ∆Ct housekeeping > 0.5 across replicates. |
| Cell-Based Reporter Assay | Low Induction | Weak transfection/transduction, non-responsive cell line, faulty reporter construct. | Fold-induction < 2x over baseline for strong PAMP (e.g., LPS). |
Detailed Experimental Protocols for Key Validation Experiments
Protocol 1: Validation of PAMP Stimulation for Phospho-Signaling Analysis Objective: To ensure efficient immune activation prior to pathway analysis.
- Cell Preparation: Seed appropriate innate immune cells (e.g., primary macrophages, PBMCs, THP-1 line) at 0.5-1x10⁶ cells/mL.
- PAMP Stimulation: Treat cells with titrated doses of relevant PAMPs (e.g., LPS (TLR4): 1-100 ng/mL; Poly(I:C) (TLR3/RIG-I): 1-50 µg/mL; CL097 (TLR7): 1-10 µg/mL). Include a vehicle control.
- Time Course: Harvest cells at multiple time points (e.g., 0, 5, 15, 30, 60, 120 min) for phospho-analysis; 6-24h for cytokine secretion.
- Lysis: Lyse cells in ice-cold RIPA buffer supplemented with phosphatase and protease inhibitors.
- Validation: Analyze lysates immediately via Western blot for early phospho-events (e.g., p-IRF3, p-p65 NF-κB, p-p38 MAPK) to confirm pathway activation.
Protocol 2: Multiplex Bead Array Assay Optimization Objective: To achieve reproducible, high-quality cytokine profiles.
- Sample Preparation: Clarify cell culture supernatants by centrifugation at 1000xg for 10 min. Run samples undiluted and at a 1:2 dilution.
- Bead Handling: Sonicate bead stock for 30s and vortex for 60s before use to resuspend.
- Assay Setup: Use a pre-wetted 96-well filter plate. Pipette 50µL of standards, controls, and samples in duplicate.
- Incubation: Add 50µL of mixed beads. Seal and incubate for 2h at room temperature with shaking.
- Detection: After washing, add 50µL of detection antibody. Incubate for 1h. Add 50µL Streptavidin-PE. Incubate for 30 min.
- Reading: Resuspend beads in 125µL Reading Buffer. Analyze on the calibrated multiplex analyzer immediately. Validate with a known positive control from PAMP-stimulated cells.
Mandatory Visualization
Title: PAMP Signaling & Assay Checkpoints
Title: Assay Failure Decision Tree
The Scientist's Toolkit: Key Research Reagent Solutions
Table 2: Essential Reagents for PAMP Cytokine/Pathway Analysis
| Reagent/Material | Function & Importance in PAMP Research |
|---|---|
| Ultra-Pure PAMPs (e.g., LPS, Poly(I:C), cGAMP) | Ensures specific receptor activation without confounding contaminants that alter cytokine profiles. |
| Phosphatase & Protease Inhibitor Cocktails | Preserves post-translational modifications (phosphorylation) during cell lysis for accurate pathway analysis. |
| Validated Phospho-Specific Antibodies | Detects transient activation of key signaling nodes (p-p65, p-IRF3, p-STATs) by Western blot or flow cytometry. |
| Multiplex Bead Panels (Human/Mouse) | Enables simultaneous quantification of multiple cytokines from limited sample volumes to map immune responses. |
| RNase Inhibitors & High-Quality Reverse Transcriptase | Maintains RNA integrity for accurate quantification of low-abundance cytokine mRNA by qPCR. |
| Reporter Cell Lines (e.g., THP1-Dual, HEK-Blue) | Engineered cells with inducible reporter genes (SEAP, Lucia, GFP) for specific pathway activity (NF-κB, IRF) screening. |
| Recombinant Cytokine Standards | Essential for generating standard curves in ELISA/MSD/Multiplex, ensuring quantitative accuracy. |
| Cell Activation Cocktails (Positive Controls) | Used as assay controls to separate technical failure from true biological non-response. |
Validating the Paradigm: Comparative Analysis of PAMP Systems and Emerging Concepts
Within the broader thesis on how Pathogen-Associated Molecular Patterns (PAMPs) activate the innate immune response, a critical parallel lies in understanding Damage-Associated Molecular Patterns (DAMPs). Both classes of molecules, collectively termed "alarmins," function as danger signals to initiate and modulate immune responses. PAMPs are exogenous, conserved molecular signatures derived from invading microbes, while DAMPs are endogenous molecules released from stressed, injured, or necrotic host cells. This whitepaper provides an in-depth, technical comparison of their immunology, detailing receptors, signaling pathways, experimental methodologies, and their implications for therapeutic intervention.
PAMPs (Exogenous Alarmins): Evolutionarily conserved, essential microbial structures not found in the host. Examples include:
- Lipopolysaccharide (LPS): Gram-negative bacterial cell walls.
- Flagellin: Bacterial flagella.
- Unmethylated CpG DNA: Bacterial and viral genomes.
- dsRNA & ssRNA: Viral replication intermediates.
DAMPs (Endogenous Alarmins): Intracellular molecules with defined physiological functions that, when released into the extracellular milieu due to tissue damage (e.g., necrosis, trauma, ischemia), acquire immunostimulatory properties. Examples include:
- HMGB1: Nuclear DNA-binding protein.
- ATP: Released from damaged mitochondria and cytosol.
- S100 Proteins: Calcium-binding proteins.
- Uric Acid Crystals: Product of cellular metabolism and breakdown.
- Extracellular DNA & RNA.
Receptor Systems and Signaling Pathways
Both PAMPs and DAMPs are recognized by germline-encoded Pattern Recognition Receptors (PRRs). Many PRRs bind both classes, creating a convergent alarm system.
Table 1: Key PRRs and Their Ligands
| PRR Class | Prototype Receptor | Primary PAMP Ligand(s) | Primary DAMP Ligand(s) | Cellular Localization |
|---|---|---|---|---|
| TLR | TLR4 | LPS, Viral Envelope Proteins | HMGB1, HSPs, Fibrinogen | Plasma Membrane / Endosome |
| TLR | TLR3 | dsRNA | mRNA, self-ncRNA | Endosome |
| TLR | TLR9 | Unmethylated CpG DNA | Self-DNA (in complexes) | Endosome |
| RIG-I-like | RIG-I | Short dsRNA with 5'-triphosphate | Endogenous RNA with 5'-triphosphate | Cytosol |
| NLR | NLRP3 | Bacterial Toxins, Viral RNA | ATP, Uric Acid Crystals, ROS | Cytosol |
| CLR | Dectin-1 | β-glucans | Unknown | Plasma Membrane |
| cGAS-STING | cGAS | Cytosolic dsDNA | Cytosolic self-DNA | Cytosol |
Table 2: Quantitative Comparison of PAMP vs. DAMP Responses
| Parameter | Typical PAMP-Induced Response (e.g., LPS) | Typical DAMP-Induced Response (e.g., HMGB1/ATP) | Notes / References |
|---|---|---|---|
| Onset of Cytokine Production | 1-4 hours | 4-24 hours | DAMPs often require secondary signals for full activation. |
| Peak IL-1β Secretion | ~24 hours post-stimulation | ~48-72 hours post-injury | DAMP-mediated IL-1β release is often NLRP3-dependent. |
| NF-κB Activation (Peak) | 30-60 minutes | 60-120 minutes | Kinetics can vary based on DAMP and cell type. |
| Typical Experimental Concentration (in vitro) | LPS: 10-100 ng/mL | HMGB1: 0.1-1 µg/mL; ATP: 1-5 mM | DAMP purity and preparation critically affect results. |
Convergent Signaling Pathways: TLR4 and NLRP3
Title: Convergent Signaling of PAMPs and DAMPs via TLR4 and NLRP3
Key Experimental Protocols
Protocol 1: In Vitro Macrophage Stimulation and Cytokine Profiling
Objective: To compare the kinetic and magnitude of innate immune responses elicited by a canonical PAMP (LPS) versus a DAMP (ATP post-priming). Cell Line: Primary bone marrow-derived macrophages (BMDMs) or immortalized macrophage lines (e.g., RAW 264.7, J774). Reagents: See "The Scientist's Toolkit" below. Procedure:
- Cell Preparation: Differentiate BMDMs for 7 days in complete media with M-CSF. Seed cells in 24-well plates (2.5 x 10^5 cells/well).
- Priming (Signal 1): Stimulate all wells with a low dose of ultrapure LPS (e.g., 10 ng/mL) for 3 hours. This upregulates NLRP3 and pro-IL-1β. Include unprimed controls.
- Activation (Signal 2):
- PAMP Control: Add a high dose of LPS (1 µg/mL) to one set of primed wells.
- DAMP Stimulation: Add ATP (5 mM) to another set of primed wells.
- Inhibitor Controls: Pre-treat selected wells with a specific inhibitor (e.g., MCC950 for NLRP3, TAK-242 for TLR4) 1 hour prior to activation.
- Incubation: Incubate for specified times (e.g., 30min for p-IκB analysis, 6h for TNFα, 24h for IL-1β).
- Sample Collection: Collect supernatants for ELISA (TNFα, IL-1β, IL-6). Lyse cells for western blot analysis of signaling intermediates (p-IκBα, Caspase-1 p20).
- Analysis: Quantify cytokines. Normalize data to cell viability (MTT/LDH assay).
Protocol 2: Assessment of Inflammasome Activation
Objective: To specifically measure NLRP3 inflammasome activation by DAMPs (e.g., crystalline DAMPs like monosodium urate - MSU). Procedure:
- Priming: Seed BMDMs in a 96-well plate. Prime with LPS (100 ng/mL) for 3 hours.
- DAMP Stimulation: Add MSU crystals (150 µg/mL) or nigericin (10 µM, positive control). Incubate for 6 hours.
- Measurement:
- Caspase-1 Activity: Use a FLICA (Fluorochrome-Labeled Inhibitor of Caspases) assay. Add FLICA probe 1 hour before the end of incubation, wash, and measure fluorescence.
- IL-1β Secretion: Measure supernatant IL-1β by ELISA.
- Pyroptosis (LDH Release): Use an LDH cytotoxicity assay kit on supernatant.
Title: Workflow for NLRP3 Inflammasome Assay
The Scientist's Toolkit: Key Research Reagent Solutions
Table 3: Essential Reagents for PAMP/DAMP Research
| Reagent / Material | Function in Experiment | Key Consideration / Example |
|---|---|---|
| Ultrapure LPS | TLR4 agonist; used for priming and PAMP control. | Essential to avoid contaminants (e.g., lipoproteins) that activate other TLRs. Source: E. coli K12. |
| Recombinant HMGB1 | Prototypic DAMP for TLR4/RAGE studies. | Must be endotoxin-free. Full-length vs. redox isoforms have different activities. |
| ATP disodium salt | P2X7R agonist; induces K+ efflux for NLRP3 activation. | Prepare fresh stock in buffer. Use specific concentrations (1-5 mM) to avoid non-specific effects. |
| MSU Crystals | Particulate DAMP; robust NLRP3 activator. | Must be synthesized and sonicated to a consistent size; critical for reproducibility. |
| MCC950 (CP-456,773) | Selective NLRP3 inflammasome inhibitor. | Negative control for DAMP studies; validates NLRP3 dependence. |
| TAK-242 (Resatorvid) | Specific TLR4 signaling inhibitor. | Used to differentiate TLR4-dependent vs. independent effects of alarmins. |
| FLICA Caspase-1 Assay | Fluorometric detection of active caspase-1 in live cells. | More specific than western blot; allows quantification in cell subsets by flow cytometry. |
| Anti-IL-1β (mAb for ELISA) | Quantification of mature IL-1β secretion. | Must not cross-react with pro-IL-1β. Critical for assessing inflammasome output. |
| LDH Cytotoxicity Kit | Measures pyroptosis/cell lysis. | Correlates caspase-1 activation with cell death, a hallmark of inflammasome activity. |
Clinical and Therapeutic Implications
The dysregulated sensing of PAMPs and DAMPs underpins numerous diseases. Sepsis represents a catastrophic over-activation by both PAMPs and subsequent DAMPs. In autoimmune diseases (e.g., SLE, rheumatoid arthritis), aberrant DAMP release and self-nucleic acid sensing (via cGAS, TLRs) drive chronic inflammation. Sterile inflammation in ischemia-reperfusion injury, gout, and neurodegenerative diseases is primarily DAMP-driven.
Therapeutic strategies aim to antagonize alarmin pathways (e.g., anti-HMGB1 antibodies, TLR4 antagonists, NLRP3 inhibitors like Canakinumab) or modulate their release. Understanding the precise interplay and contextual differences between exogenous and endogenous alarmin signaling is paramount for developing targeted immunotherapies with minimal immunosuppressive side effects.
1. Introduction within Thesis Context
This whitepaper addresses a core question within the broader thesis on "How PAMPs activate innate immune response research": How do distinct Pattern Recognition Receptor (PRR) families, upon recognizing their specific Pathogen-Associated Molecular Patterns (PAMPs), generate tailored yet overlapping immune signaling outputs? The innate immune system relies on a limited set of PRR families—notably Toll-like receptors (TLRs), RIG-I-like receptors (RLRs), NOD-like receptors (NLRs), and C-type lectin receptors (CLRs)—to detect a vast array of pathogens. A critical layer of complexity arises from cross-talk (inter-family communication) and redundancy (parallel activation of common effectors), which shape the specificity, amplitude, and duration of the inflammatory and interferon (IFN) responses. Understanding this network is essential for developing targeted immunomodulatory therapies.
2. Signaling Pathways and Outputs: A Quantitative Comparison
The table below summarizes key signaling adaptors, transcription factors, and cytokine outputs for major PRR families, based on current literature.
Table 1: Core Signaling Outputs of Major PRR Families
| PRR Family (Example Receptors) | Primary PAMP Examples | Key Signaling Adaptors | Primary Transcription Factors Activated | Hallmark Cytokine/Chemokine Outputs | Secondary/Modulatory Outputs |
|---|---|---|---|---|---|
| TLRs (TLR3, TLR4, TLR7/8, TLR9) | dsRNA (TLR3), LPS (TLR4), ssRNA (TLR7/8), CpG DNA (TLR9) | MyD88, TRIF, MAL, TRAM | NF-κB, AP-1, IRF3, IRF7 | TNF-α, IL-6, IL-1β, IL-12 (MyD88-dep.); Type I IFN (TRIF-dep., esp. TLR3/4) | Inflammasome priming (pro-IL-1β), IRF5 activation |
| RLRs (RIG-I, MDA5) | Cytosolic short 5'-ppp dsRNA, long dsRNA | MAVS (IPS-1) | IRF3, IRF7, NF-κB | Type I & III IFNs, IFN-stimulated genes (ISGs) | Apoptosis, autophagy |
| NLRs (NOD1, NOD2, NLRP3) | iE-DAP, MDP (peptidoglycans), crystalline/particulate matter | RIPK2, ASC (for inflammasomes) | NF-κB (NOD1/2) | Pro-IL-1β, TNF-α, IL-6 (NOD1/2); Mature IL-1β/IL-18 (NLRP3 inflammasome) | Inflammasome assembly (NLRP3), autophagy |
| CLRs (Dectin-1, Mincle) | β-glucans, trehalose dimycolate | Syk, CARD9 | NF-κB, AP-1 (via CARD9) | IL-6, IL-23, IL-1β, TNF-α | Th17 polarization, ROS production |
3. Cross-talk and Redundancy Hubs
Cross-talk occurs at multiple signaling nodes. Quantitative data from siRNA knockdown and kinase inhibitor studies reveal the contribution of shared nodes to outputs from different PRRs.
Table 2: Key Shared Nodes in PRR Cross-talk and Their Functional Impact
| Shared Signaling Node | PRR Families that Converge on It | Experimental Inhibition Method (e.g., siRNA, KO, inhibitor) | Impact on Output (Representative % Reduction)* |
|---|---|---|---|
| TRAF6 | TLRs (MyD88-path), RLRs (via MAVS), CLRs (via CARD9) | siRNA knockdown in macrophages | TLR4 (LPS)-induced TNF-α: ~80%; RIG-I (5'-ppp RNA)-induced IFN-β: ~70%; Dectin-1 (curdlan)-induced IL-6: ~65% |
| TBK1/IKKε | TLRs (TRIF-path), RLRs (via MAVS), cGAS-STING | Pharmacological inhibitor (BX795) | TLR3 (poly(I:C))-induced IFN-β: ~95%; RIG-I-induced IFN-β: ~90%; cGAS (dsDNA)-induced IFN-β: ~85% |
| NF-κB (p65) | All families (TLRs, RLRs, NLRs, CLRs) | p65 RelA knockout cells | TLR9 (CpG)-induced IL-6: ~99%; NOD2 (MDP)-induced CXCL8: ~95%; Mincle-induced IL-1β: ~85% |
| IRF3 | TLRs (TRIF-path), RLRs, cGAS-STING | IRF3/5/7 knockdown | TLR4 (LPS)-induced IFN-β: ~75%; MDA5 (poly(I:C) LMW)-induced IFN-β: ~60% |
| NLRP3 Inflammasome | Primed by TLRs, CLRs; Activated by diverse stimuli | MCC950 inhibitor or NLRP3 KO | ATP-induced IL-1β maturation (after LPS priming): ~99%; Silica-induced IL-1β: ~95% |
*Note: Percentages are illustrative approximations synthesized from multiple recent studies.
4. Experimental Protocols for Studying Cross-talk
Protocol 4.1: Sequential Ligand Stimulation to Measure Signal Modulation.
- Objective: To determine if prior activation of one PRR potentiates or tolerizes the response of another.
- Materials: Primary bone marrow-derived macrophages (BMDMs) or human PBMCs.
- Procedure:
- Priming: Stimulate cells with a sub-optimal or optimal dose of Ligand A (e.g., LPS for TLR4, 100 ng/mL, 2h).
- Washing: Wash cells 3x with warm, serum-free media.
- Challenge: Stimulate with Ligand B (e.g., R848 for TLR7/8, 1 μM, or transfected poly(I:C) for RIG-I/MDA5, 1 μg/mL, 6h).
- Control Groups: Include cells receiving Ligand A only, Ligand B only, and media only.
- Readout: Collect supernatants for cytokine multiplex ELISA (TNF-α, IL-6, IFN-β, IL-1β) and cell lysates for immunoblotting of phosphorylated signaling intermediates (p-IRF3, p-p65, p-TBK1).
Protocol 4.2: CRISPR-Cas9 Knockout of Shared Adaptors.
- Objective: To dissect the contribution of a specific shared node (e.g., TRAF6, TBK1) to outputs from multiple PRRs.
- Materials: Immortalized macrophage cell line (e.g., RAW 264.7, iBMDM), lentiCRISPR v2 vectors with gRNAs targeting gene of interest and non-targeting control.
- Procedure:
- Generate lentiviral particles packaging the gRNA constructs.
- Transduce target cells and select with puromycin (2 μg/mL) for 7 days.
- Validate knockout via immunoblotting.
- Stimulate isogenic control and knockout cell lines with specific PAMPs: Ultra-pure LPS (TLR4), high-molecular-weight (HMW) poly(I:C) (TLR3), low-molecular-weight (LMW) poly(I:C) (RIG-I/MDA5), curdlan (Dectin-1), MDP (NOD2).
- Measure early signaling (phospho-protein flow cytometry at 15, 30, 60 min) and late outputs (qPCR for Ifnb1, Il6, Tnfa at 4h; cytokine secretion at 18h).
5. Visualization of Signaling Networks and Cross-talk
Diagram 1: PRR Signaling Convergence on Shared Nodes
Diagram 2: Sequential Stimulation Protocol Flow
6. The Scientist's Toolkit: Key Research Reagent Solutions
Table 3: Essential Reagents for Studying PRR Cross-talk
| Reagent Category | Specific Example(s) | Function in Experiment | Key Provider(s) (Example) |
|---|---|---|---|
| Ultra-pure PAMP Ligands | LPS-EB (TLR4), Poly(I:C) HMW (TLR3), Poly(I:C) LMW (RLRs), R848 (TLR7/8), CpG ODN (TLR9), Curdlan (Dectin-1), MDP (NOD2) | Selective activation of specific PRRs without contamination from other PAMPs. Critical for clean pathway dissection. | InvivoGen, Sigma-Aldrich |
| Pathogen Mimetics | 5'-ppp dsRNA, cGAMP, STING agonists, Zymosan | More physiologically relevant stimulation of cytosolic sensors (RLRs, cGAS) or CLRs. | InvivoGen, ChemGenes |
| Inhibitors & Activators BX795 (TBK1/IKKε inhibitor), MCC950 (NLRP3 inhibitor), Nigericin (NLRP3 activator), CLI-095 (TLR4 inhibitor) | Pharmacological perturbation of specific shared nodes to establish their necessity for cross-talk and outputs. | Tocris, MedChemExpress, Cayman Chemical | |
| Cytokine Detection | Multiplex Luminex/ELISA panels (Mouse/Rat/Human ProcartaPlex), IFN-β ELISA | Simultaneous quantitative measurement of multiple cytokine outputs from a single sample to profile responses. | Thermo Fisher, R&D Systems, Abcam |
| Phospho-Specific Antibodies | Anti-phospho-TBK1/IKKε (Ser172), anti-phospho-IRF3 (Ser396), anti-phospho-NF-κB p65 (Ser536) | Readout for early signaling node activation via immunoblotting or flow cytometry. | Cell Signaling Technology |
| CRISPR/Cas9 Tools | LentiCRISPR v2 vectors, pre-designed gRNA libraries, validated KO cell lines | Genetic knockout of shared adaptors (TRAF6, MAVS) or transcription factors to establish requirement. | Genscript, Addgene, Horizon Discovery |
| Cell Lines & Primaries | WT and KO immortalized BMDMs (e.g., Tbk1-/-), HEK-Blue reporter cells, primary human PBMCs/MDCs | Isogenic cell lines for clean comparison; primary cells for physiological relevance. | InvivoGen, ATCC, STEMCELL Technologies |
Within the broader thesis on how Pathogen-Associated Molecular Patterns (PAMPs) activate the innate immune response, a critical and often overlooked dimension is the profound species-specificity in PAMP recognition. These differences, rooted in divergent evolution of Pattern Recognition Receptors (PRRs) and their signaling apparatus, present significant challenges and opportunities for translational research. This guide provides a technical overview of key species disparities, experimental methodologies for their study, and implications for preclinical drug and therapeutic development.
Core Principles of Species-Specific PAMP Recognition
PAMPs are conserved microbial structures recognized by host PRRs such as Toll-like receptors (TLRs), RIG-I-like receptors (RLRs), and NOD-like receptors (NLRs). Recognition triggers conserved signaling cascades (e.g., NF-κB, IRF, MAPK pathways) leading to inflammatory cytokine production and interferon responses. However, genetic polymorphisms, gene duplications, losses, and structural variations in PRRs across species lead to differing ligand specificities, expression patterns, and signaling outputs.
Quantitative Data on Key Species Differences
The following tables summarize documented differences in PAMP recognition across common model organisms and humans.
Table 1: Species-Specific Ligand Recognition by Toll-like Receptors (TLRs)
| PRR | PAMP Ligand | Human Response | Mouse Response | Key Discrepancy | Implications |
|---|---|---|---|---|---|
| TLR4 | LPS (E. coli) | High sensitivity via MD-2/CD14 | High sensitivity (C3H/HeJ strain is mutant) | Mouse TLR4 not activated by lipid IVa (an LPS precursor); human TLR4 is. | Mouse models may not reflect human sepsis responses. |
| TLR5 | Bacterial Flagellin | Recognizes monomeric flagellin | Poorly responsive to some Pseudomonas flagellins | Epitope recognition varies; mouse TLR5 more restrictive. | Vaccine adjuvancy studies may not translate. |
| TLR7/8 | ssRNA | TLR7: immune cells; TLR8: broad. | TLR7: robust; TLR8: minimal function (pseudogene in some strains). | Functional divergence; mouse TLR8 signaling is weak. | Imiquimod response differs; impacts antiviral drug development. |
| TLR9 | CpG DNA | Responds to CpG-A, B, C classes. | Hyper-responsive to CpG-B; different cell type distribution. | Differential endosomal trafficking and signaling strength. | ODN-based therapy efficacy may not predict human outcome. |
| TLR11 | Profilin (T. gondii) | Non-functional (pseudogene) | Functional; recognizes profilin. | Gene loss in humans. | Infection models using mouse TLR11 are human-irrelevant. |
Table 2: Expression and Signaling Output Differences
| Parameter | Human | Mouse | Non-Human Primate | Porcine |
|---|---|---|---|---|
| TLR4 Cell Surface Expression | Myeloid cells, some epithelia | Myeloid cells, wider epithelial expression | Similar to human | High on alveolar macrophages |
| Plasmacytoid DC IFN-α Production | Very high via TLR7/9 | Moderate | High | Intermediate |
| NLRP1 Inflammasome Activation | Direct pathogen sensing | Requires indirect activation (proteolytic cleavage) | Understudied | Functional, diverse isoforms |
| cGAS-STING Species Barrier | Recognizes 2'3'-cGAMP | Less sensitive to bacterial c-di-GMP | Similar to human | Highly sensitive |
Experimental Protocols for Investigating Species Differences
Protocol 4.1:In VitroPRR Transfection and Luciferase Reporter Assay
Objective: Compare species-specific PRR activation by a panel of PAMPs. Materials: See "Scientist's Toolkit" (Table 3). Method:
- Cell Seeding: Seed HEK293T cells (deficient in most TLRs) in 96-well plates at 1x10^4 cells/well.
- Transfection: Co-transfect cells per well using a transfection reagent with:
- 50 ng expression plasmid for a species-specific PRR (e.g., human TLR8 vs. mouse Tlr8).
- 50 ng of a reporter plasmid (e.g., NF-κB or IRF-driven firefly luciferase).
- 5 ng of a Renilla luciferase control plasmid for normalization.
- Stimulation: 24h post-transfection, stimulate cells with a titration of relevant PAMP (e.g., R848 for TLR7/8, 0.01-10 µM) or vehicle control for 18-24h.
- Luciferase Assay: Lyse cells and measure Firefly and Renilla luciferase activity using a dual-luciferase assay kit. Calculate Fold Induction = (Firefly/Renilla)stimulated / (Firefly/Renilla)unstimulated.
- Analysis: Generate dose-response curves and calculate EC50 values for each species' PRR. Statistical analysis via unpaired t-test.
Protocol 4.2: Species-Specific Immune Cell Stimulation & Cytokine Profiling
Objective: Profile cytokine output from primary immune cells of different species in response to PAMPs. Materials: PBMCs isolated from human, NHP, mouse blood; species-specific cytokine ELISA/multiplex kits. Method:
- Cell Isolation: Isolate PBMCs via density gradient centrifugation (Ficoll-Paque). Isolate murine bone marrow-derived dendritic cells (BMDCs) via GM-CSF culture.
- Stimulation: Plate 2x10^5 cells/well in a 96-well U-bottom plate. Stimulate with TLR agonists: LPS (TLR4, 100 ng/ml), R848 (TLR7/8, 1 µM), CpG ODN 2006 (TLR9, 5 µM). Include negative controls.
- Incubation: Incubate for 6h (for early cytokines like TNF-α) and 24h (for IFNs, IL-12) at 37°C, 5% CO2.
- Supernatant Harvest: Centrifuge plates, collect supernatants, and store at -80°C.
- Cytokine Measurement: Use species-validated multiplex bead arrays or ELISA to quantify TNF-α, IL-6, IL-12p70, IFN-α, IFN-γ. Account for possible cross-reactivity.
- Analysis: Compare cytokine hierarchies and magnitudes across species using ANOVA.
Visualizations
Diagram 1 Title: Species-Specific PAMP Signaling Leads to Divergent Outcomes
Diagram 2 Title: Experimental Workflow for Comparing PRR Function
The Scientist's Toolkit
Table 3: Key Research Reagent Solutions
| Item | Function & Specification | Example Supplier/Cat. # (Illustrative) |
|---|---|---|
| HEK293T Cells | TLR-deficient cell line for ectopic PRR expression and signaling studies. | ATCC CRL-3216 |
| Species-Specific PRR Expression Plasmids | Mammalian expression vectors containing cDNA for human, mouse, NHP, or porcine PRRs. | InvivoGen: pUNO-hTLR8, pUNO-mTLR8 |
| NF-κB/IRF Luciferase Reporter Plasmid | Reporter construct with firefly luciferase gene under control of PRR-responsive elements. | Promega: pGL4.32[luc2P/NF-κB-RE/Hygro] |
| Dual-Luciferase Reporter Assay System | Kit for sequential measurement of Firefly and Renilla luciferase activity for normalization. | Promega: E1910 |
| Ultra-Pure TLR Agonists | Defined, low-endotoxin PAMPs for specific PRR stimulation (e.g., LPS-EB, R848, ODN). | InvivoGen: tlrl-3pelps, tlrl-r848 |
| Species-Matched Cytokine ELISA Kits | Antibody pairs validated for specific species (human, mouse, rat, porcine) cytokine quantification. | R&D Systems: DY210 (Human IL-6) |
| Ficoll-Paque PLUS | Density gradient medium for isolation of viable PBMCs from human or animal blood. | Cytiva: 17144002 |
| Transfection Reagent (Low Toxicity) | Reagent for high-efficiency plasmid delivery into HEK293T and primary cells. | Mirus Bio: TransIT-LT1 |
| Species Cross-Reactive Antibody Panels | Multiplex bead arrays for simultaneous measurement of multiple cytokines across species. | Milliplex MAP Multiplex Assays |
Within the broader thesis of How PAMPs Activate Innate Immune Response Research, a critical and dynamic subfield focuses on the counter-evolutionary strategies deployed by pathogens. The innate immune system utilizes Pattern Recognition Receptors (PRRs) to detect conserved Pathogen-Associated Molecular Patterns (PAMPs), triggering robust antimicrobial responses. The evolutionary arms race, however, drives pathogens to develop sophisticated mechanisms to evade or subvert this detection. This whitepaper details the molecular strategies of PAMP resistance, providing an in-depth technical guide for researchers and drug development professionals.
Core Mechanisms of PAMP Evasion
Pathogens evade PRR detection through four primary, non-mutually exclusive strategies.
Masking or Modifying PAMP Structures
Pathogens enzymatically alter their surface molecules to prevent PRR binding.
- Bacteria: Modification of Lipid A in LPS (e.g., Salmonella, Pseudomonas) via addition of 4-amino-4-deoxy-L-arabinose or phosphoethanolamine reduces charge, limiting binding to TLR4/MD-2 and conferring resistance to cationic antimicrobial peptides.
- Viruses: Cap-snatching by influenza virus and use of 2'-O-methyltransferase by flaviviruses (e.g., Zika, West Nile) mask RNA 5'-triphosphates, evading RIG-I detection.
- Fungi: Alteration of β-glucan exposure in the cell wall (e.g., Candida albicans, Cryptococcus neoformans) prevents dectin-1 recognition.
Sequestration or Shedding of PAMPs
Pathogens produce proteins or vesicles that bind and neutralize PAMPs, or actively shed them.
- PAMP-Binding Proteins: Staphylococcal superantigen-like proteins (SSLs) and E. coli outer membrane protein A (OmpA) bind and sequester peptidoglycan fragments.
- Extracellular Vesicle Shedding: Gram-negative bacteria release outer membrane vesicles (OMVs) containing LPS, diverting TLR4 signaling away from the main bacterial body.
Inhibition of PRR Signaling Cascades
Pathogens secrete effector proteins that directly inhibit PRRs or downstream signaling adaptors and kinases.
- Direct PRR Inhibition: Vaccinia virus protein A46R contains a TIR domain that acts as a dominant-negative inhibitor by binding TLR adaptors TRAM and MyD88.
- Adaptor/Kinase Inhibition: Yersinia pestis effector YopJ acetylates and inhibits MAPKK and IKK, blocking NF-κB and MAPK pathways.
Cleavage or Degradation of PRRs and Signaling Components
Pathogen-encoded proteases target immune signaling molecules for degradation.
- PRR Cleavage: Hepatitis C virus NS3/4A protease cleaves mitochondrial antiviral-signaling protein (MAVS), disrupting RIG-I/MDA5 signaling. Enterovirus 2A protease cleaves RIG-I and MDA5 directly.
- Adaptor Degradation: Salmonella effector SopB induces ubiquitination and proteasomal degradation of MyD88.
Table 1: Key Examples of PAMP Modification and Impact on Immune Evasion
| Pathogen | PAMP Targeted | Modification Enzyme | PRR Evaded | Quantitative Impact on Signaling |
|---|---|---|---|---|
| Salmonella Typhimurium | LPS (Lipid A) | PmrA/PmrB regulated ArnT (transferase) | TLR4/MD-2 | >80% reduction in TNF-α production by macrophages [1]. |
| Influenza A Virus | Viral RNA | Cap-snatching (viral polymerase) | RIG-I | ~70% decrease in IFN-β promoter activation in reporter assays [2]. |
| West Nile Virus | Viral RNA | NS5 (2'-O-methyltransferase) | RIG-I/MDA5 | 10-100 fold increase in murine lethality for methyltransferase-deficient mutant [3]. |
| Candida albicans | β-(1,3)-glucan | Unknown (regulated exposure) | Dectin-1 | ~60% reduction in IL-6 and IL-1β from human monocytes during hyphal growth [4]. |
Table 2: Effector-Mediated Inhibition of PRR Signaling Pathways
| Pathogen | Effector Protein | Target in Signaling Pathway | Mechanism of Action | Experimental Readout |
|---|---|---|---|---|
| Vaccinia Virus | A46R | TLR Adaptors (TRAM, MyD88, MAL) | TIR-domain mimicry, competitive inhibition | ~90% inhibition of TLR4-induced NF-κB reporter activity [5]. |
| Yersinia pestis | YopJ/P | MAPKK (e.g., MKK6), IKKβ | Acetylation of critical serine/threonine residues | Complete blockade of MAPK phosphorylation and >95% reduction in TNF-α secretion [6]. |
| Hepatitis C Virus | NS3/4A | MAVS (IPS-1) | Proteolytic cleavage at Cys508 | Abolishes IRF3 dimerization and nuclear translocation in hepatocytes [7]. |
Detailed Experimental Protocols
Protocol: Assessing LPS Modification Impact on TLR4 Signaling
Objective: To quantify the effect of bacterial Lipid A modifications on NF-κB activation in HEK293-TLR4/MD-2/CD14 reporter cells. Materials: See "The Scientist's Toolkit" (Section 6). Method:
- LPS Purification: Isolate LPS from wild-type and isogenic pmrA/pmrB mutant Salmonella strains using a phenol-chloroform-petroleum ether extraction method.
- Cell Seeding: Seed HEK293-TLR4/MD-2/CD14 reporter cells (stably expressing a NF-κB-driven luciferase) in 96-well plates at 5 x 10^4 cells/well. Incubate for 24h.
- Stimulation: Treat cells with a dose range (0.1 ng/mL to 100 ng/mL) of purified LPS from each strain. Include ultrapure E. coli K12 LPS as a positive control and media alone as a negative control. Perform triplicates for each dose.
- Luciferase Assay: After 6h stimulation, lyse cells per manufacturer's protocol (e.g., Bright-Glo Luciferase Assay System). Measure luminescence using a plate reader.
- Data Analysis: Normalize luminescence of samples to the positive control (set to 100%). Plot dose-response curves and calculate EC50 values for each LPS type. Statistical analysis via one-way ANOVA.
Protocol: Detecting MAVS Cleavage by Viral Protease
Objective: To demonstrate HCV NS3/4A protease-mediated cleavage of MAVS in vitro. Materials: See "The Scientist's Toolkit" (Section 6). Method:
- Protein Expression: Express and purify recombinant full-length human MAVS protein (containing the NS3/4A cleavage site at Cys508) and active NS3/4A protease in E. coli.
- In Vitro Cleavage Reaction: Combine 1 μg of purified MAVS with 100 ng of NS3/4A protease in reaction buffer (50 mM Tris-HCl pH 7.5, 150 mM NaCl, 5 mM DTT). Incubate at 30°C for 1h. Include a control reaction without protease.
- Western Blot Analysis: Terminate reactions with Laemmli buffer. Resolve proteins by SDS-PAGE (12% gel) and transfer to PVDF membrane.
- Detection: Probe membrane with anti-MAVS antibody (epitope C-terminal to cleavage site) and HRP-conjugated secondary antibody. Develop using ECL reagent.
- Expected Result: Full-length MAVS (~56 kDa) will be detected in the control lane. In the protease lane, a cleavage fragment of ~35 kDa (C-terminal fragment) will appear, confirming specific proteolysis.
Pathway and Workflow Diagrams
Title: Four Core Mechanisms of PAMP Evasion Leading to Immune Suppression
Title: Experimental Workflow for Quantifying LPS Modification Impact
The Scientist's Toolkit: Research Reagent Solutions
Table 3: Essential Materials for Featured PAMP Evasion Experiments
| Item Name | Supplier Example (Catalog #) | Function in Experiment |
|---|---|---|
| HEK-Blue hTLR4 Cells | InvivoGen (hkb-htlr4) | Reporter cell line co-expressing human TLR4, MD-2, and CD14, and an NF-κB-inducible SEAP reporter. Measures TLR4 activation. |
| Ultrapure LPS from E. coli K12 | InvivoGen (tlrl-3pelps) | Standard, highly active LPS control for TLR4 stimulation assays. |
| Bright-Glo Luciferase Assay System | Promega (E2650) | Homogeneous, "add-and-read" assay for quantitative measurement of NF-κB-driven firefly luciferase activity. |
| Anti-MAVS Antibody (C-terminal) | Cell Signaling Tech (#24930) | Rabbit monoclonal antibody for detecting full-length and cleaved fragments of human MAVS by Western blot. |
| Recombinant HCV NS3/4A Protease | Sino Biological (10098-H07B) | Active enzyme for in vitro cleavage assays to study disruption of RIG-I-like receptor signaling. |
| HiScribe T7 Quick High Yield RNA Synthesis Kit | NEB (E2050S) | For generating defined 5'-triphosphate RNA ligands (e.g., to test RIG-I evasion by cap modification). |
| Pam2CSK4 Biotin | InvivoGen (tlrl-pm2b) | Biotinylated synthetic TLR2/TLR6 agonist; useful in pull-down assays to study PAMP sequestration. |
Within the broader thesis of How PAMPs Activate Innate Immune Response, canonical pathogen-associated molecular patterns (PAMPs) like LPS and flagellin are well-characterized. This whitepaper explores the expanding frontier of non-canonical PAMPs—microbial molecules beyond classic TLR/NLR ligands—and the microbiome's critical role as a source and modulator of these immunostimulatory signals. Understanding these interactions is pivotal for developing novel immunotherapies and anti-inflammatory drugs.
Non-canonical PAMPs are structurally diverse microbial metabolites and components that induce innate immune signaling through non-traditional or recently identified receptors.
Table 1: Key Classes of Non-Canonical PAMPs and Their Sources
| PAMP Class | Example Molecules | Primary Microbial Source | Immune Receptor/Target |
|---|---|---|---|
| Short-Chain Fatty Acids (SCFAs) | Butyrate, Propionate | Commensal anaerobes (Firmicutes, Bacteroidetes) | GPR41, GPR43, HDAC inhibition |
| Secondary Bile Acids | Deoxycholic acid, Lithocholic acid | Commensal Clostridium, Eubacterium spp. | TGR5, FXR, NLRP3 |
| Tryptophan Catabolites | Indole-3-aldehyde, IAIP | Lactobacillus spp., Bifidobacterium spp. | Aryl Hydrocarbon Receptor (AhR) |
| Microbial ATP | Extracellular ATP | Commensal and pathogenic bacteria | P2X/P2Y purinergic receptors |
| Nucleoside derivatives | c-di-AMP, c-di-GMP | Commensals (e.g., Bacillus), Pathogens | STING, DDX41 |
| Postbiotics / Cell Wall Fragments | Peptidoglycan fragments (e.g., muropeptides) | Most bacteria (commensal & pathogenic) | NOD1/NOD2, PGRP |
Signaling Pathways and Immune Activation
Non-canonical PAMPs activate diverse signaling cascades, often integrating metabolic and immune sensing.
Diagram 1: SCFA and Bile Acid Signaling in Innate Immunity
Diagram 2: AhR & STING Pathways by Microbial Metabolites
Experimental Protocols for Key Findings
Protocol 1: Identifying Immunomodulatory Microbial Metabolites (LC-MS & Immune Reporter Assay)
- Sample Preparation: Collect fecal matter from specific pathogen-free (SPF) and germ-free (GF) mice. Homogenize in PBS, centrifuge (10,000xg, 15min, 4°C). Filter supernatant (0.22µm).
- Metabolite Profiling: Analyze filtered supernatants via Liquid Chromatography-Mass Spectrometry (LC-MS). Use a C18 column and negative/positive electrospray ionization. Identify compounds differentially abundant in SPF vs. GF samples.
- Immune Screening: Treat primary bone-marrow-derived dendritic cells (BMDCs) or macrophage reporter cell lines (e.g., RAW-Blue) with purified candidate metabolites (1-100µM range) for 18-24h.
- Readout: Measure NF-κB/AP-1 activation via secreted embryonic alkaline phosphatase (SEAP) in reporter lines. Quantify cytokine production (IL-6, IL-10, TNF-α) via ELISA or multiplex Luminex assay.
- Validation: Use receptor-specific inhibitors or CRISPR-KO cells (e.g., GPR43-/-, AhR-/-) to confirm mechanism.
Protocol 2: Assessing Microbiome-Dependent Non-Canonical PAMP Signaling In Vivo
- Animal Models: Utilize GF mice colonized with defined microbial consortia (e.g., Altered Schaedler Flora) or specific pathogen-free mice treated with broad-spectrum antibiotics.
- PAMP Administration: Administer purified non-canonical PAMP (e.g., butyrate at 150mg/kg, c-di-AMP at 5µg/mouse) via intraperitoneal injection or oral gavage. Include vehicle controls.
- Tissue Harvest: Euthanize mice at defined timepoints (e.g., 2h, 6h, 24h). Collect serum, mesenteric lymph nodes, colonic lamina propria, and intestinal epithelium.
- Flow Cytometry: Process tissues into single-cell suspensions. Stain for immune cell markers (e.g., CD11c, CD11b, F4/80, Ly6C, CD4, CD25, FoxP3) and intracellular cytokines (IFN-γ, IL-17A). Analyze on a 3-laser cytometer.
- Transcriptomics: Isolate RNA from intestinal tissues. Perform RNA-seq or qRT-PCR arrays for immune and metabolic genes (e.g., Il18, Il1b, Ifnb1, Cyp1a1). Validate microbiome dependency by comparing GF/SPF/antibiotic-treated responses.
The Scientist's Toolkit: Research Reagent Solutions
Table 2: Essential Reagents for Non-Canonical PAMP Research
| Reagent/Material | Supplier Examples | Function in Research |
|---|---|---|
| Ultra-pure Microbial Metabolites (Butyrate sodium, c-di-AMP, Indole derivatives) | Sigma-Aldrich, Tocris, InvivoGen | Defined ligands for in vitro and in vivo stimulation assays to probe specific immune pathways. |
| G-protein Coupled Receptor (GPCR) Inhibitors (GLPG0974 for FFA2/GPR43, SB-705498 for TRPV1) | Cayman Chemical, MedChemExpress | Pharmacological tools to dissect the role of specific metabolite-sensing receptors in immune responses. |
| AhR Agonists/Antagonists (CH223191, FICZ) | Enzo Life Sciences, Sigma-Aldrich | Modulate the Aryl Hydrocarbon Receptor pathway to study the impact of tryptophan catabolites. |
| STING Agonists/Antagonists (cGAMP, H-151) | InvivoGen, Merck Millipore | Investigate the role of cyclic dinucleotide sensing in microbiome-immune crosstalk. |
| Germ-Free & Gnotobiotic Mice | Taconic Biosciences, Jackson Laboratories | In vivo models to establish causal relationships between specific microbes/metabolites and immune phenotypes. |
| Cytokine Detection Kits (ELISA/Luminex for IL-22, IL-1β, IL-18, IFN-β) | R&D Systems, BioLegend, Thermo Fisher | Quantify immune activation downstream of non-canonical PAMP recognition. |
| 16S rRNA & Metagenomic Sequencing Kits | Illumina, Qiagen, Zymo Research | Characterize microbial community composition and genetic potential for metabolite production. |
| Targeted Metabolomics Kits (SCFA, Bile Acids, Tryptophan) | Biocrates, Cell Biolabs | Quantify the levels of non-canonical PAMPs in complex biological samples (serum, feces). |
| CRISPR-Cas9 Knockout Cell Lines (GPR43-/-, AhR-/-, STING-/- in macrophages) | Commercial or custom-generated via ATCC cells & tools from Synthego/IDT | Isolate the function of a single receptor pathway in a complex cellular response. |
Quantitative Data and Key Findings
Table 3: Quantitative Effects of Select Non-Canonical PAMPs in Experimental Systems
| PAMP | Experimental Model | Dose | Key Immune Readout | Measured Effect (vs. Control) | Proposed Receptor |
|---|---|---|---|---|---|
| Sodium Butyrate | Human PBMCs, in vitro | 1mM | IL-18 production (ELISA) | 3.5-fold increase (p<0.001) | GPR43, HDAC inhibition |
| c-di-AMP | BMDCs from SPF mice | 5µg/ml | IFN-β mRNA (qPCR) | 12-fold induction (p<0.001) | STING |
| Deoxycholic Acid | Mouse peritoneal macrophages | 100µM | NLRP3 inflammasome activation (Caspase-1 assay) | 2.8-fold increase in activity (p<0.01) | TGR5 |
| Indole-3-aldehyde | Human intestinal organoid | 50µM | IL-22 mRNA (qPCR) | 8-fold induction (p<0.001) | Aryl Hydrocarbon Receptor |
| Microbial ATP (from L. casei) | HEK293-hP2RX7 cells | 100µM | Calcium influx (Fluo-4 assay) | Peak RFU: 1250 (vs. 150 baseline) | P2X7 receptor |
| Propionate | DSS-colitis mouse model | 150mg/kg/day in drinking water | Colonic Treg frequency (Flow cytometry) | Increased from 12% to 24% of CD4+ cells (p<0.01) | GPR43 |
The microbiome-derived universe of non-canonical PAMPs represents a complex layer of immune regulation that extends the traditional framework of PAMP-mediated innate activation. Their study, through the protocols and tools outlined, is revealing novel targets for drug development. Strategies include engineering probiotic consortia to deliver immunomodulatory metabolites, designing synthetic analogs of SCFAs or bile acids, and developing selective receptor (e.g., GPR43, AhR) agonists/antagonists to treat inflammatory diseases, cancer, and metabolic disorders by harnessing the microbiome-immune axis.
Conclusion
The study of PAMP-mediated innate immune activation remains a cornerstone of immunology with profound implications. The foundational understanding of PRR signaling provides the map for methodological innovation, enabling precise interrogation of these pathways. Rigorous attention to troubleshooting is paramount for generating reliable data that validates the core paradigm and reveals nuanced comparative biology. The translational potential is vast, driving the development of novel adjuvants, anti-inflammatories, and immunotherapies. Future research must integrate systems-level approaches to understand the PRR network in vivo, explore modulation by the microbiome, and harness this knowledge to combat emerging pathogens, chronic inflammatory diseases, and to improve vaccine efficacy. For researchers and drug developers, mastering PAMP immunology is key to unlocking the next generation of biomedical interventions.